Integrate lanes from all batches of EB pilot (Human data only, no doublets
Last updated: 2020-08-10
Checks: 7 0
Knit directory: Embryoid_Body_Pilot_Workflowr/analysis/
This reproducible R Markdown analysis was created with workflowr (version 1.6.2). The Checks tab describes the reproducibility checks that were applied when the results were created. The Past versions tab lists the development history.
Great! Since the R Markdown file has been committed to the Git repository, you know the exact version of the code that produced these results.
Great job! The global environment was empty. Objects defined in the global environment can affect the analysis in your R Markdown file in unknown ways. For reproduciblity it’s best to always run the code in an empty environment.
The command set.seed(20200804) was run prior to running the code in the R Markdown file. Setting a seed ensures that any results that rely on randomness, e.g. subsampling or permutations, are reproducible.
Great job! Recording the operating system, R version, and package versions is critical for reproducibility.
Nice! There were no cached chunks for this analysis, so you can be confident that you successfully produced the results during this run.
Great job! Using relative paths to the files within your workflowr project makes it easier to run your code on other machines.
Great! You are using Git for version control. Tracking code development and connecting the code version to the results is critical for reproducibility.
The results in this page were generated with repository version f50ebd3. See the Past versions tab to see a history of the changes made to the R Markdown and HTML files.
Note that you need to be careful to ensure that all relevant files for the analysis have been committed to Git prior to generating the results (you can use wflow_publish or wflow_git_commit). workflowr only checks the R Markdown file, but you know if there are other scripts or data files that it depends on. Below is the status of the Git repository when the results were generated:
Ignored files:
    Ignored:    .Rhistory
    Ignored:    .Rproj.user/
    Ignored:    output/.Rhistory

Untracked files:
    Untracked:  analysis/child/
    Untracked:  code/EB.getHumanMetadata.Rmd
    Untracked:  figure/
    Untracked:  output/mergedObjects/
    Untracked:  output/sampleQCrds/

Unstaged changes:
    Modified:   .Rprofile
    Modified:   .gitattributes
    Modified:   .gitignore
    Modified:   Embryoid_Body_Pilot_Workflowr.Rproj
    Modified:   README.md
    Modified:   _workflowr.yml
    Modified:   analysis/_site.yml
    Modified:   analysis/about.Rmd
    Modified:   analysis/index.Rmd
    Modified:   analysis/license.Rmd
    Modified:   code/README.md
    Modified:   data/README.md
    Modified:   output/README.md
Note that any generated files, e.g. HTML, png, CSS, etc., are not included in this status report because it is ok for generated content to have uncommitted changes.
These are the previous versions of the repository in which changes were made to the R Markdown (analysis/IntegrateAnalysis.afterFilter.HarmonyBatch.Rmd) and HTML (docs/IntegrateAnalysis.afterFilter.HarmonyBatch.html) files. If you’ve configured a remote Git repository (see ?wflow_git_remote), click on the hyperlinks in the table below to view the files as they were in that past version.
| File | Version | Author | Date | Message |
|---|---|---|---|---|
| Rmd | f50ebd3 | KLRhodes | 2020-08-10 | wflow_publish("analysis/Integrate*") |
| html | 421a225 | KLRhodes | 2020-08-10 | Build site. |
| Rmd | bc8ec6f | KLRhodes | 2020-08-10 | cleaning various versions of merging/intCurrent working directory |
library(Seurat)
library(harmony)
library(ggplot2)
library(DataCombine)
library(here)
library(RColorBrewer)
options(future.globals.maxSize= 15000*1024^2) #allow global exceeding 4Gb
Read in the files, add metadata, and create an object list
filelist<-list.files(here::here('output/sampleQCrds/'), full.names = T)
objectlist<- list()
for (i in 1:length(filelist)){
  rds<- readRDS(filelist[i])
  objectlist[i]<- rds

}
Warning in `[<-`(`*tmp*`, i, value = rds): implicit list embedding of S4 objects
is deprecated
Warning in `[<-`(`*tmp*`, i, value = rds): implicit list embedding of S4 objects
is deprecated
Warning in `[<-`(`*tmp*`, i, value = rds): implicit list embedding of S4 objects
is deprecated
Warning in `[<-`(`*tmp*`, i, value = rds): implicit list embedding of S4 objects
is deprecated
Warning in `[<-`(`*tmp*`, i, value = rds): implicit list embedding of S4 objects
is deprecated
Warning in `[<-`(`*tmp*`, i, value = rds): implicit list embedding of S4 objects
is deprecated
Warning in `[<-`(`*tmp*`, i, value = rds): implicit list embedding of S4 objects
is deprecated
Warning in `[<-`(`*tmp*`, i, value = rds): implicit list embedding of S4 objects
is deprecated
Warning in `[<-`(`*tmp*`, i, value = rds): implicit list embedding of S4 objects
is deprecated
Warning in `[<-`(`*tmp*`, i, value = rds): implicit list embedding of S4 objects
is deprecated
Warning in `[<-`(`*tmp*`, i, value = rds): implicit list embedding of S4 objects
is deprecated
Warning in `[<-`(`*tmp*`, i, value = rds): implicit list embedding of S4 objects
is deprecated
Warning in `[<-`(`*tmp*`, i, value = rds): implicit list embedding of S4 objects
is deprecated
Warning in `[<-`(`*tmp*`, i, value = rds): implicit list embedding of S4 objects
is deprecated
Warning in `[<-`(`*tmp*`, i, value = rds): implicit list embedding of S4 objects
is deprecated
Warning in `[<-`(`*tmp*`, i, value = rds): implicit list embedding of S4 objects
is deprecatedcreate a merged seurat object
ids<-substr(basename(filelist),1,12)
merged<- merge(objectlist[[1]], c(objectlist[[2]], objectlist[[3]],objectlist[[4]],objectlist[[5]],objectlist[[6]],objectlist[[7]],objectlist[[8]],objectlist[[9]],objectlist[[10]],objectlist[[11]],objectlist[[12]],objectlist[[13]],objectlist[[14]],objectlist[[15]],objectlist[[16]]),add.cell.ids=ids, merge.data=T)
#need to fix the individual names because they are slightly different from batch1
replacements<- data.frame(from= c("SNG-NA18511.variant2", "SNG-NA18858.variant2", "SNG-NA19160.variant2"), to=c("SNG-NA18511", "SNG-NA18858", "SNG-NA19160"))
merged@meta.data<-FindReplace(merged@meta.data, "individual", replacements, from = "from", to= "to", exact=T, vector=F )Only exact matches will be replaced.#run PCA on full dataset pre-alignment
all.genes= rownames(merged)
merged<-FindVariableFeatures(merged,selection.method="vst", nfeatures = 5000)
#have previously used all genes (nfeatures=25000) and clustering by individual rather than batch (based on proportion of cells per cluster) was still observed downstream. Now using 5000 because it is the upper bound of what has been recommended in the literature.
merged<- ScaleData(merged, features = all.genes)Centering and scaling data matrixmerged<-RunPCA(merged, npcs = 100, verbose=F)DimPlot(merged, reduction = "pca", group.by = "Batch")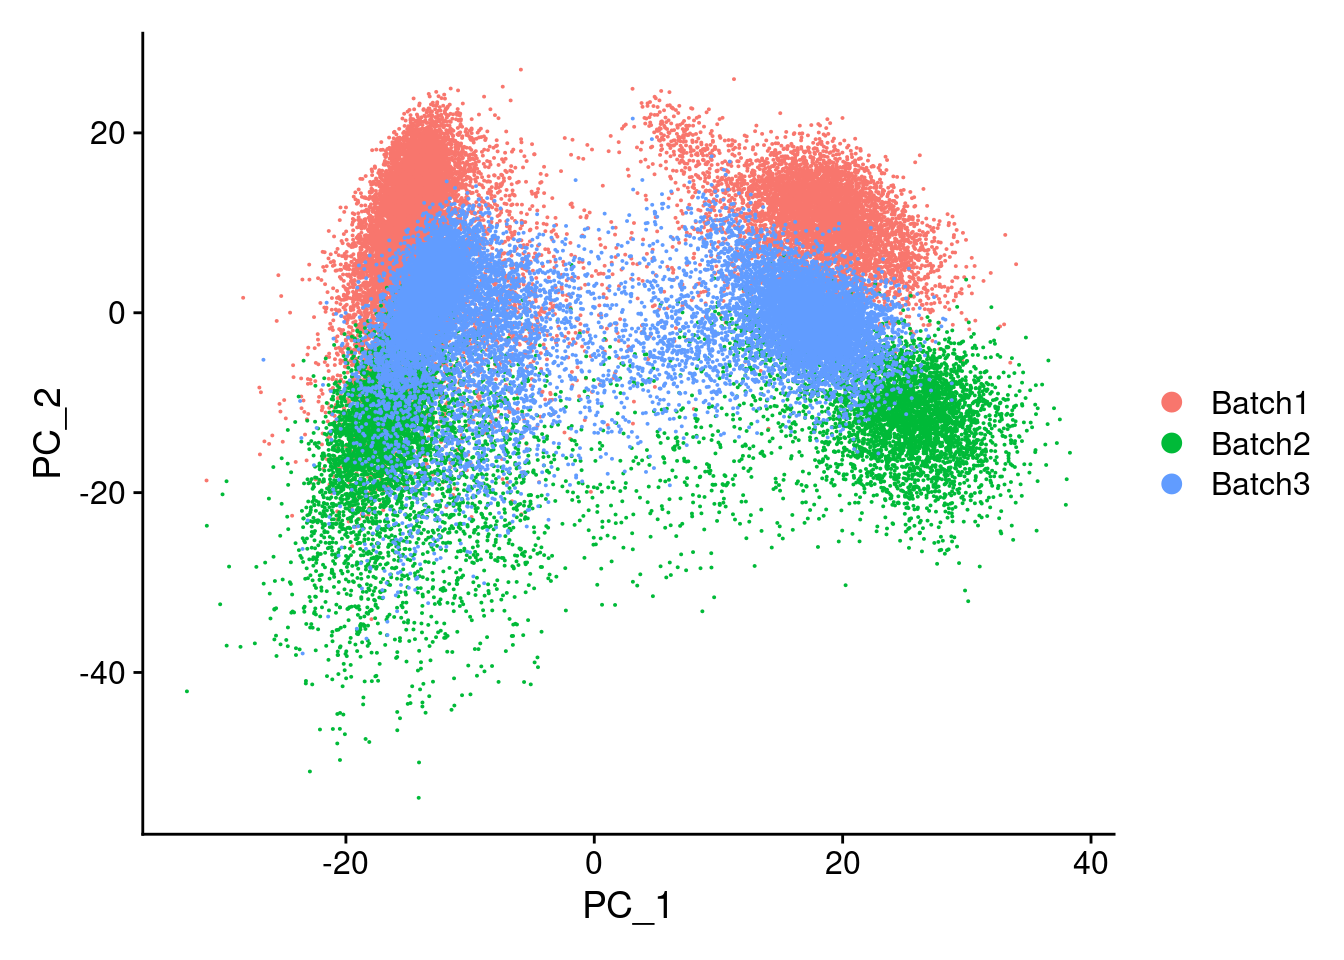
| Version | Author | Date |
|---|---|---|
| 421a225 | KLRhodes | 2020-08-10 |
Now, running harmony to integrate. Here, using Batch, SampleID(10x Lane), and individual to integrate. Since Batch and Lane are confounded, this may over correct for Batch.
merged<- RunHarmony(merged, c("Batch"), plot_convergence = T, assay.use = "SCT")Harmony 1/10Harmony 2/10Harmony 3/10Harmony 4/10Harmony 5/10Harmony 6/10Harmony 7/10Harmony converged after 7 iterationsWarning: Invalid name supplied, making object name syntactically valid. New
object name is Seurat..ProjectDim.SCT.harmony; see ?make.names for more details
on syntax validity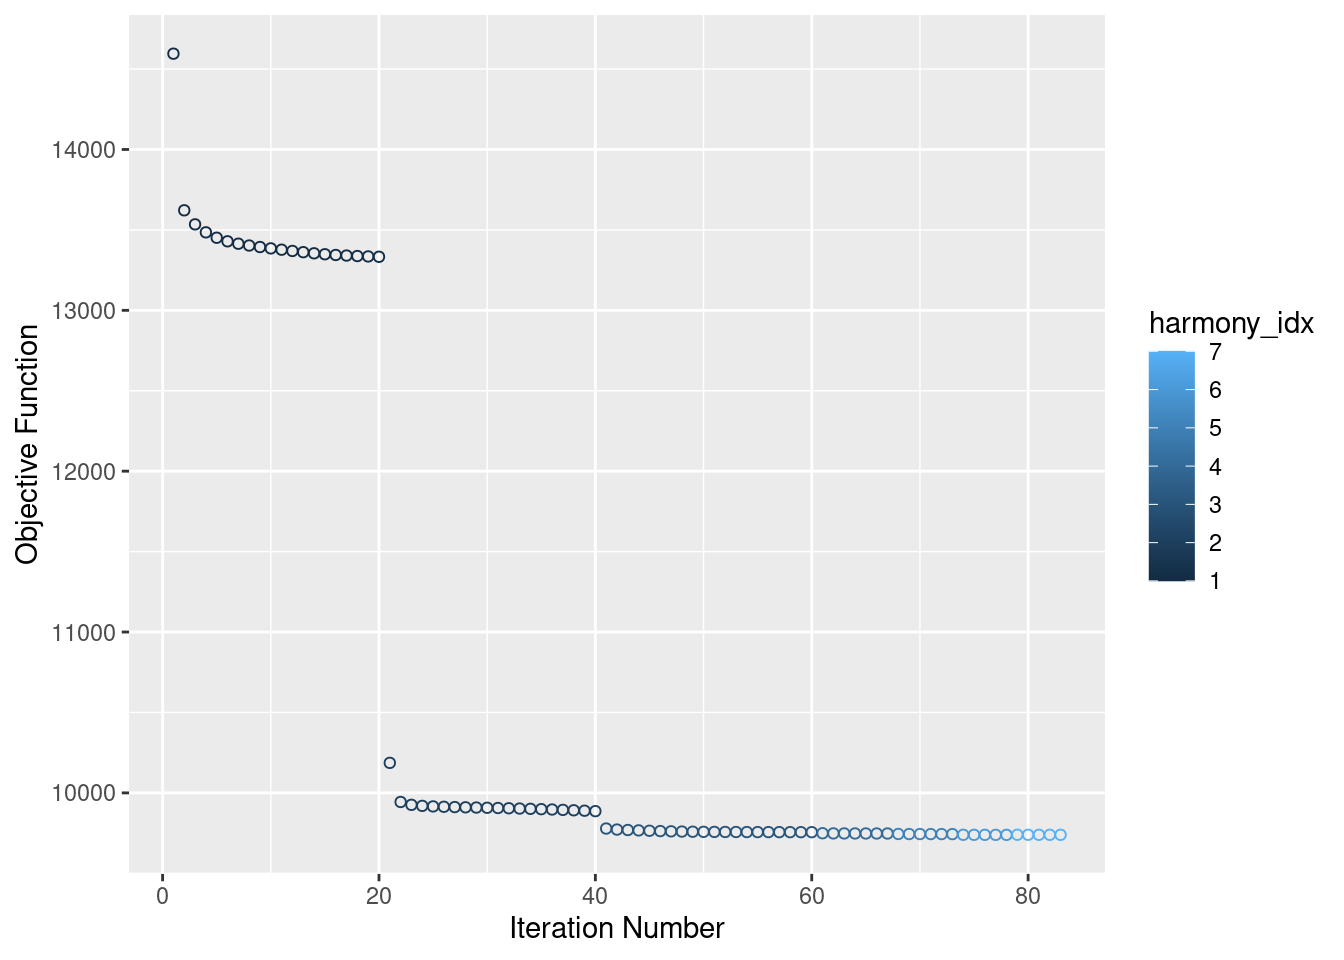
| Version | Author | Date |
|---|---|---|
| 421a225 | KLRhodes | 2020-08-10 |
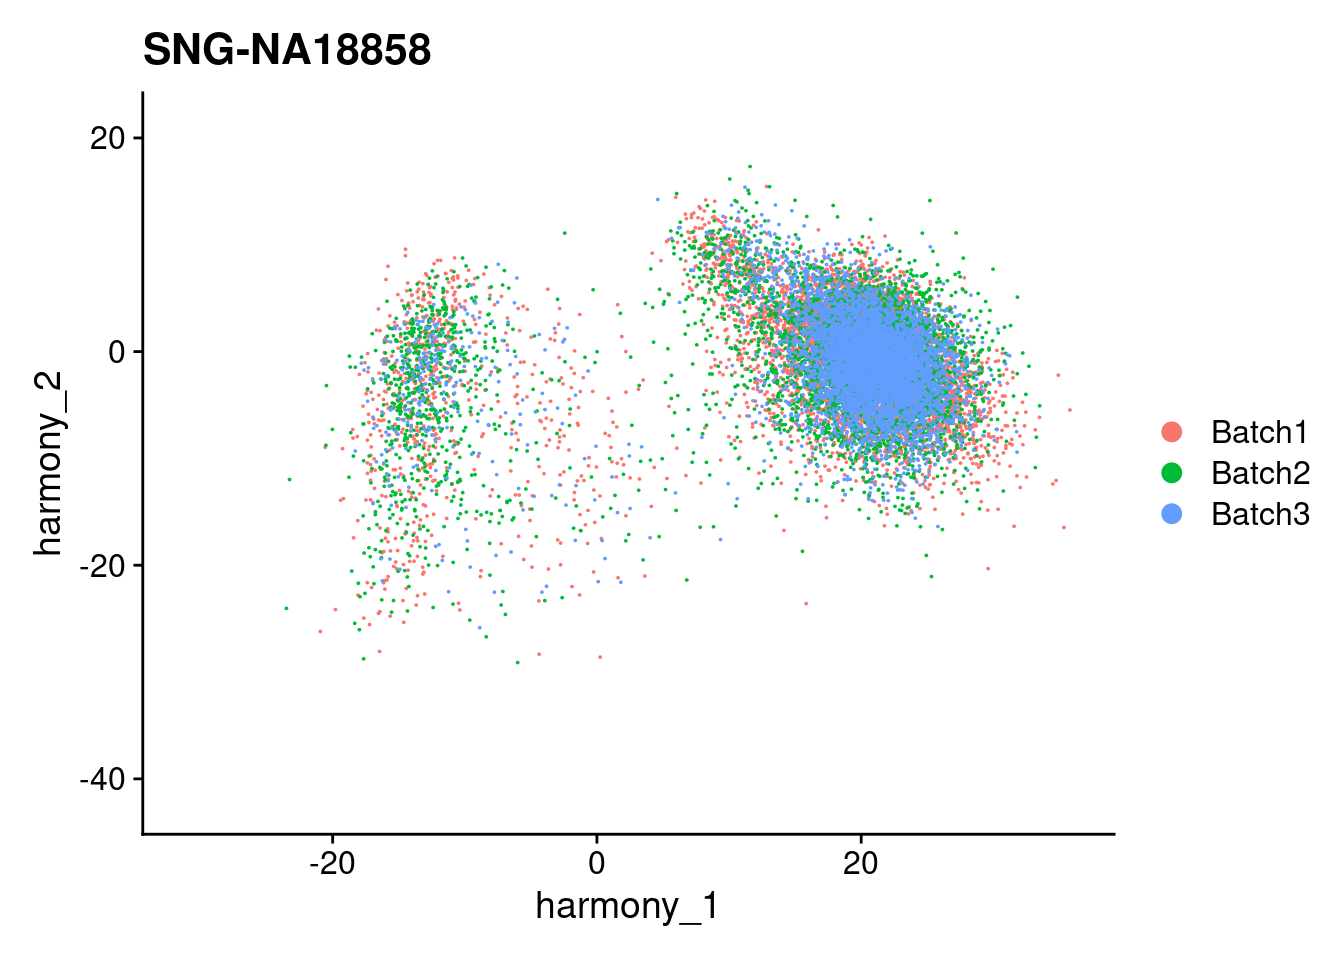
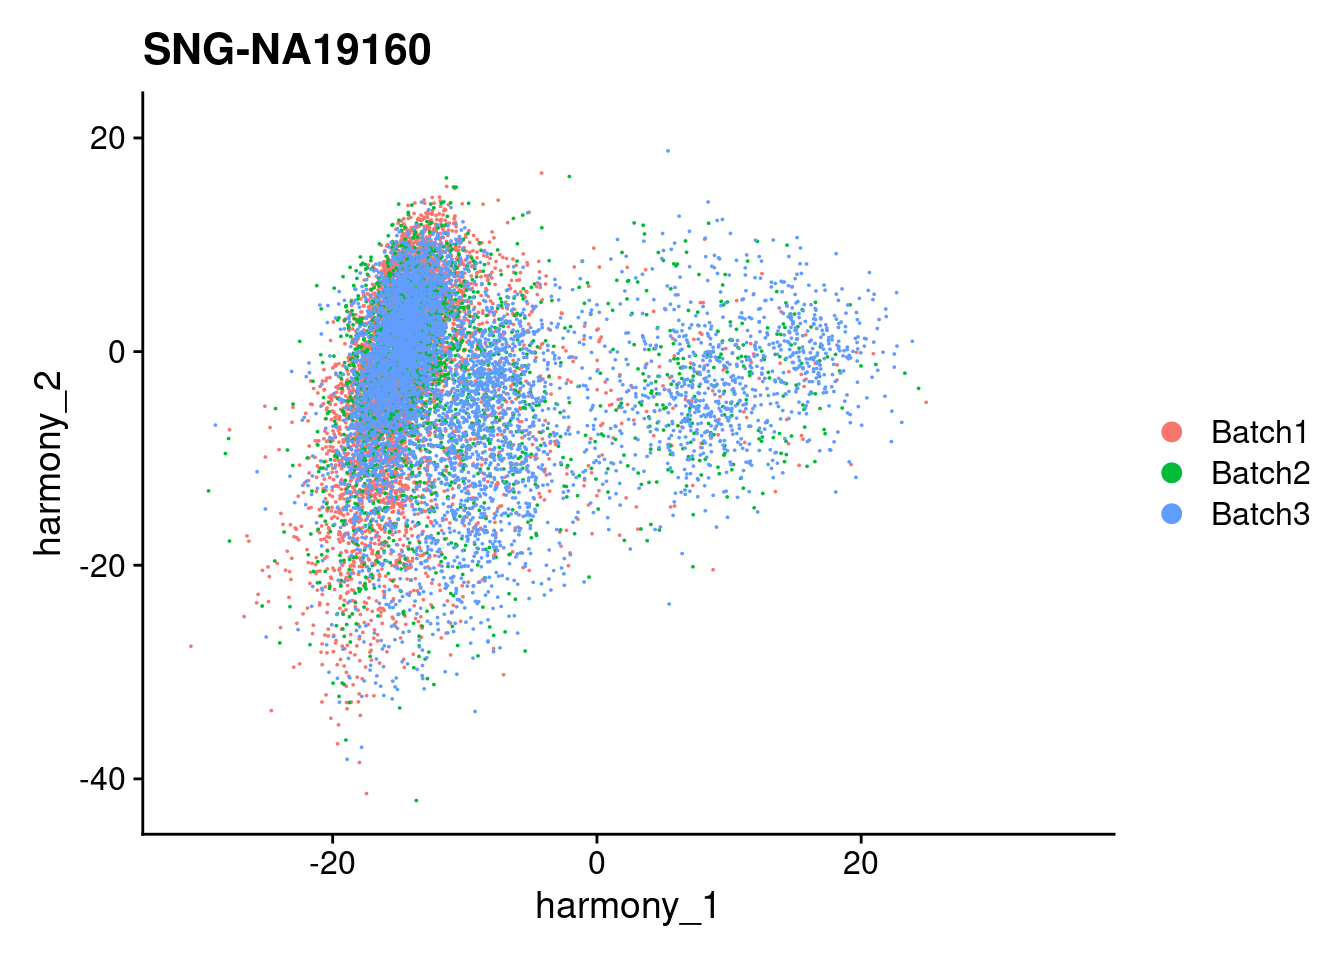
Visualize Harmony embeddings
DimPlot(merged, reduction="harmony", group.by= c("individual", "Batch"), combine=F)[[1]]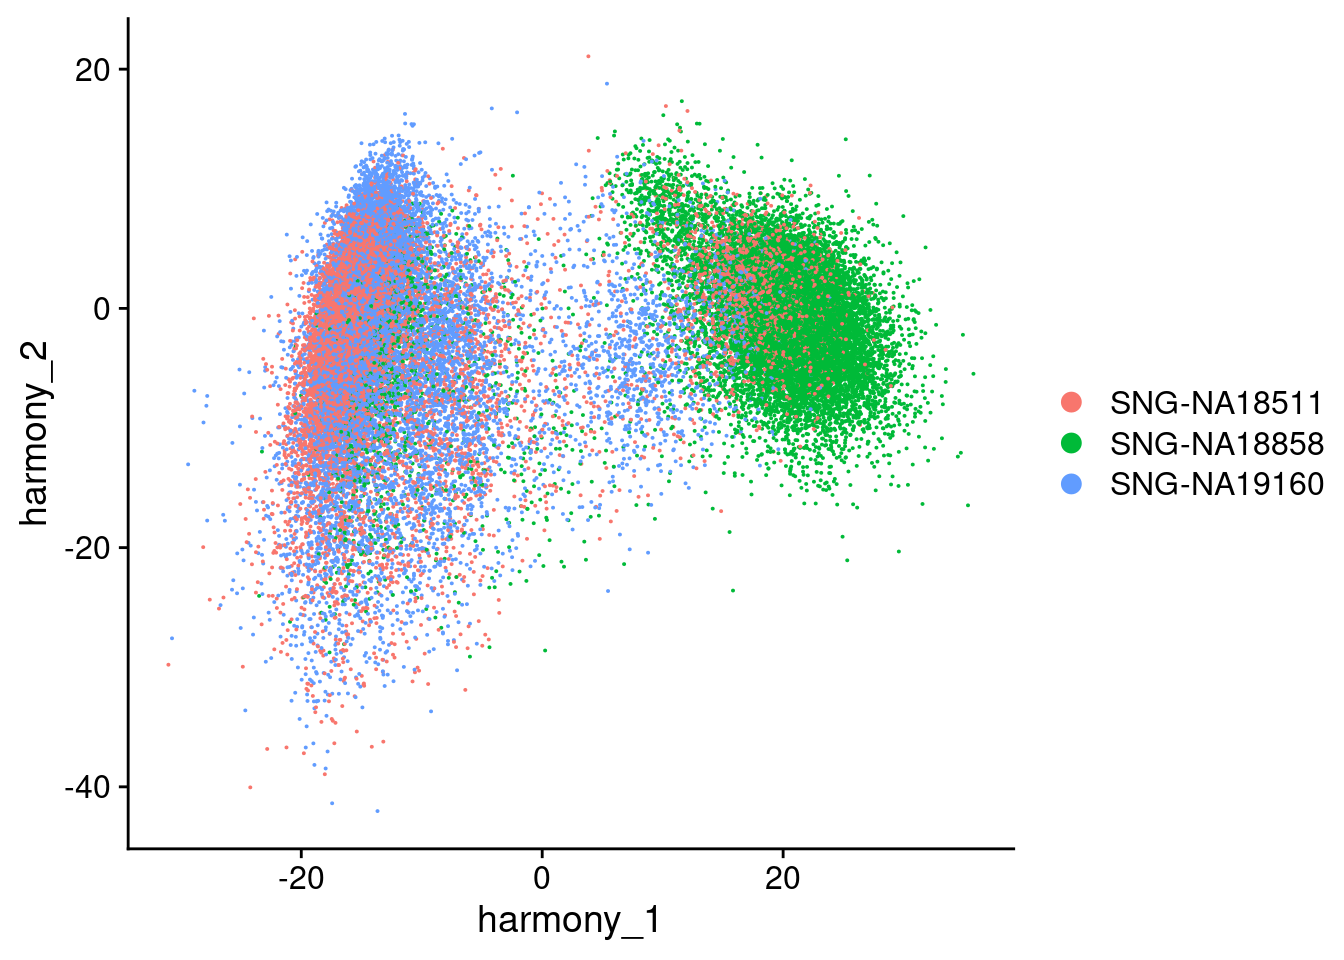
| Version | Author | Date |
|---|---|---|
| 421a225 | KLRhodes | 2020-08-10 |
[[2]]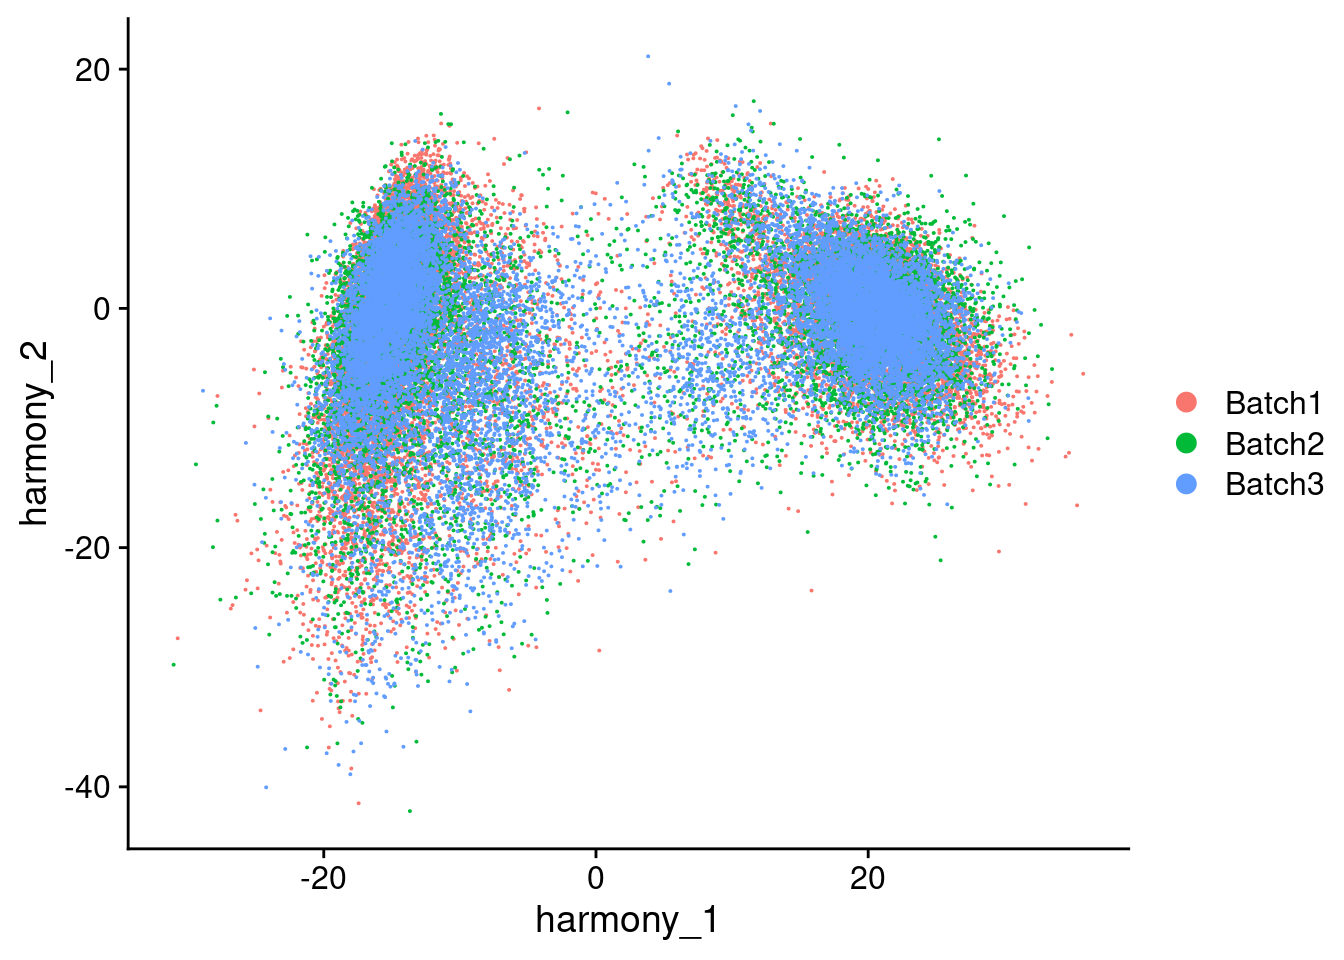
| Version | Author | Date |
|---|---|---|
| 421a225 | KLRhodes | 2020-08-10 |
Now Running UMAP and identifying clusters, etc
merged<- RunUMAP(merged, reduction = "harmony", dims = 1:100, verbose = F)Warning: The default method for RunUMAP has changed from calling Python UMAP via reticulate to the R-native UWOT using the cosine metric
To use Python UMAP via reticulate, set umap.method to 'umap-learn' and metric to 'correlation'
This message will be shown once per sessionmerged<- FindNeighbors(merged, reduction="harmony", dims = 1:100, verbose = F)
merged<- FindClusters(merged, resolution=1, verbose = F)
merged<- FindClusters(merged, resolution=0.8, verbose = F)
merged<- FindClusters(merged, resolution=0.5, verbose = F)
merged<- FindClusters(merged, resolution=0.1, verbose = F)SAVING merged/aligned/reclustered object
path<- here::here("output/mergedObjects/")
saveRDS(merged, file=paste0(path,'Harmony.Batch.rds'))
#reassign idents
Idents(merged)<- 'SCT_snn_res.1'VizDimLoadings(merged, dims = 1:2, reduction = "harmony")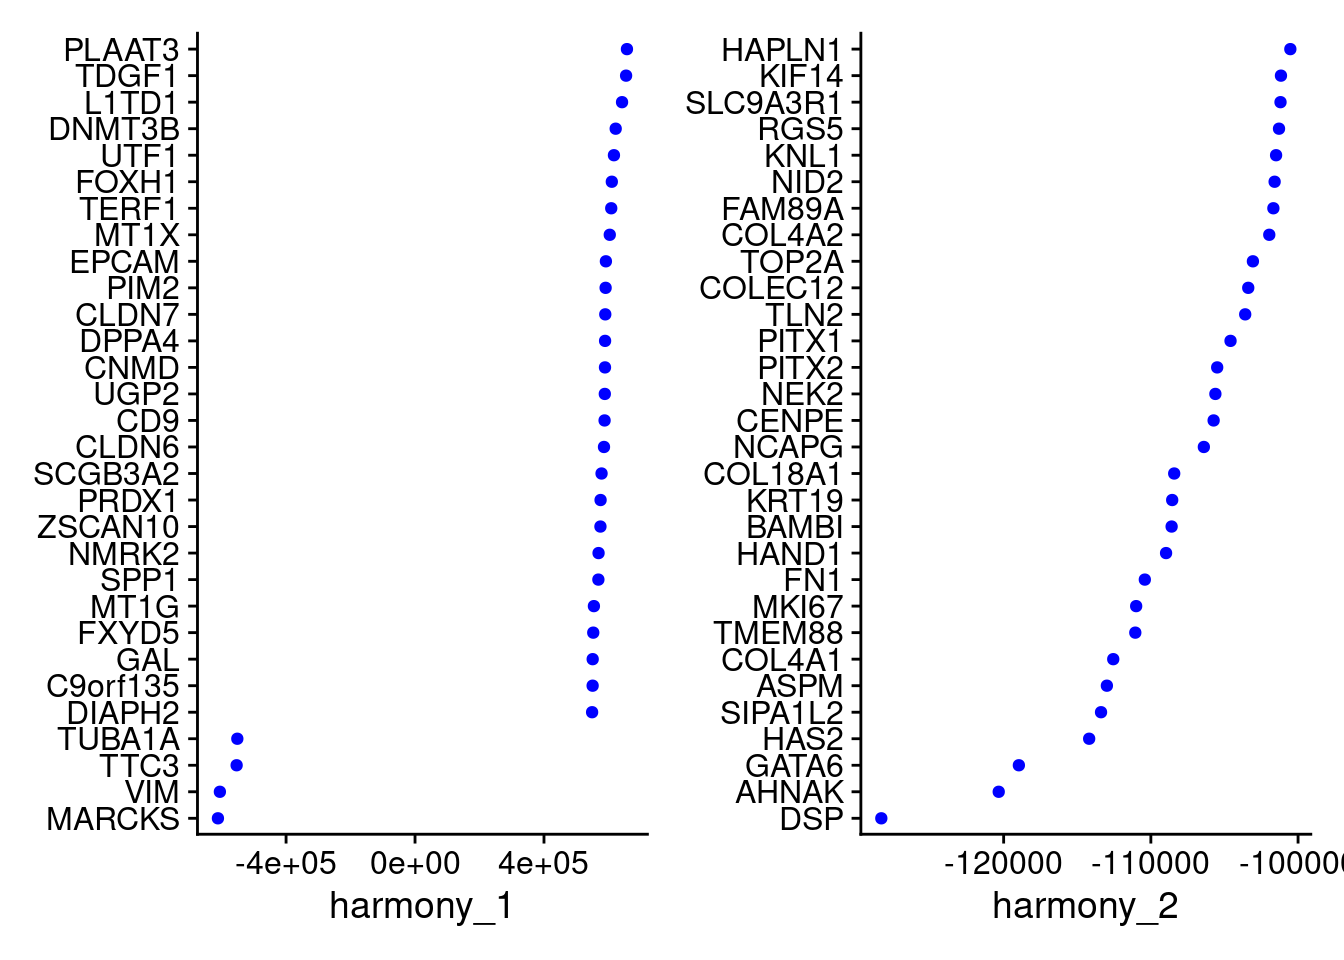
| Version | Author | Date |
|---|---|---|
| 421a225 | KLRhodes | 2020-08-10 |
VizDimLoadings(merged, dims = 3:4, reduction = "harmony")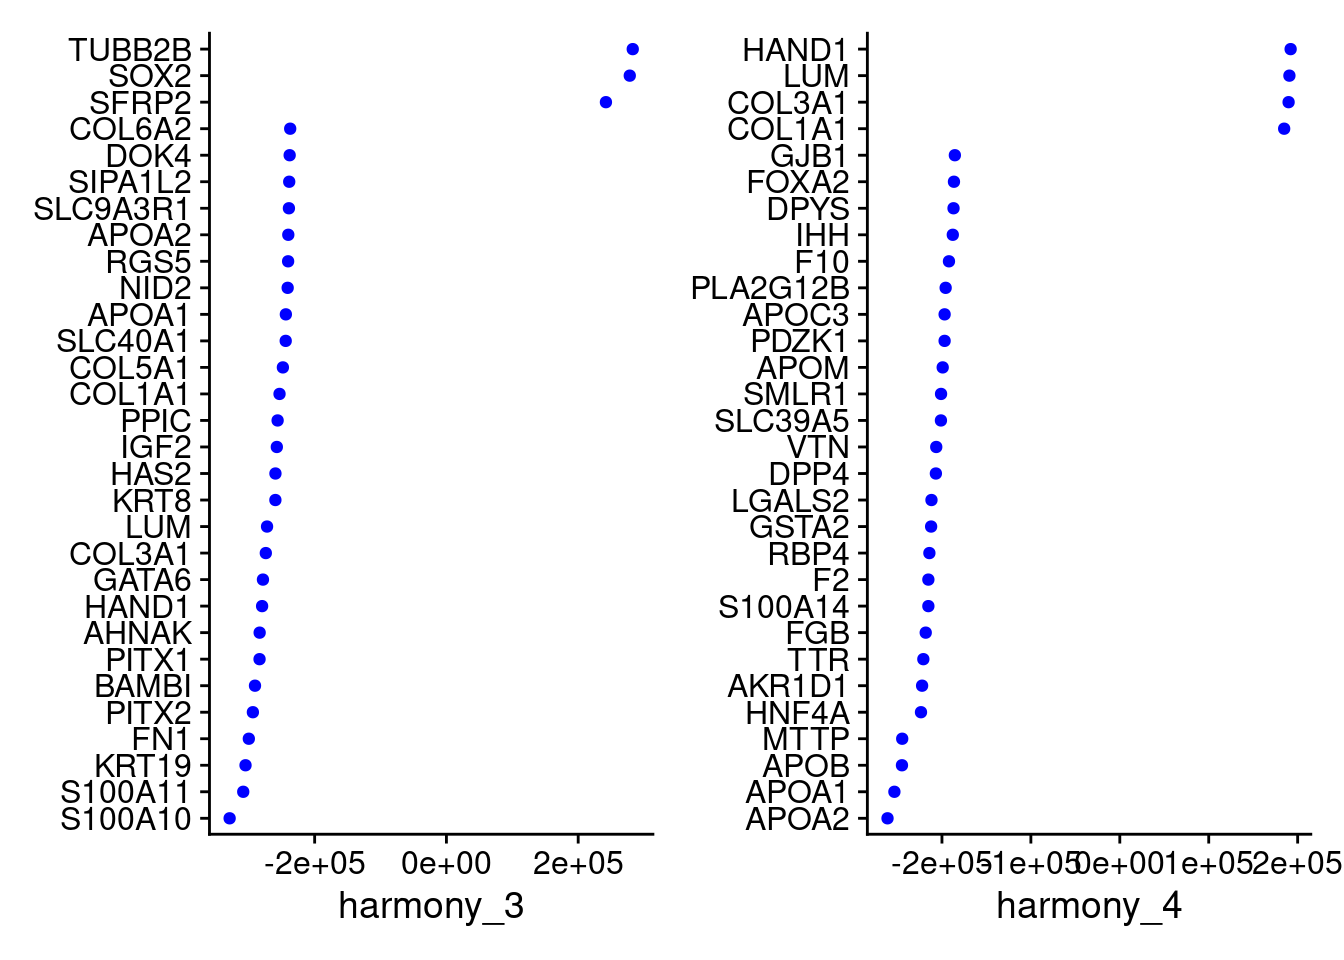
| Version | Author | Date |
|---|---|---|
| 421a225 | KLRhodes | 2020-08-10 |
VizDimLoadings(merged, dims = 5:6, reduction = "harmony")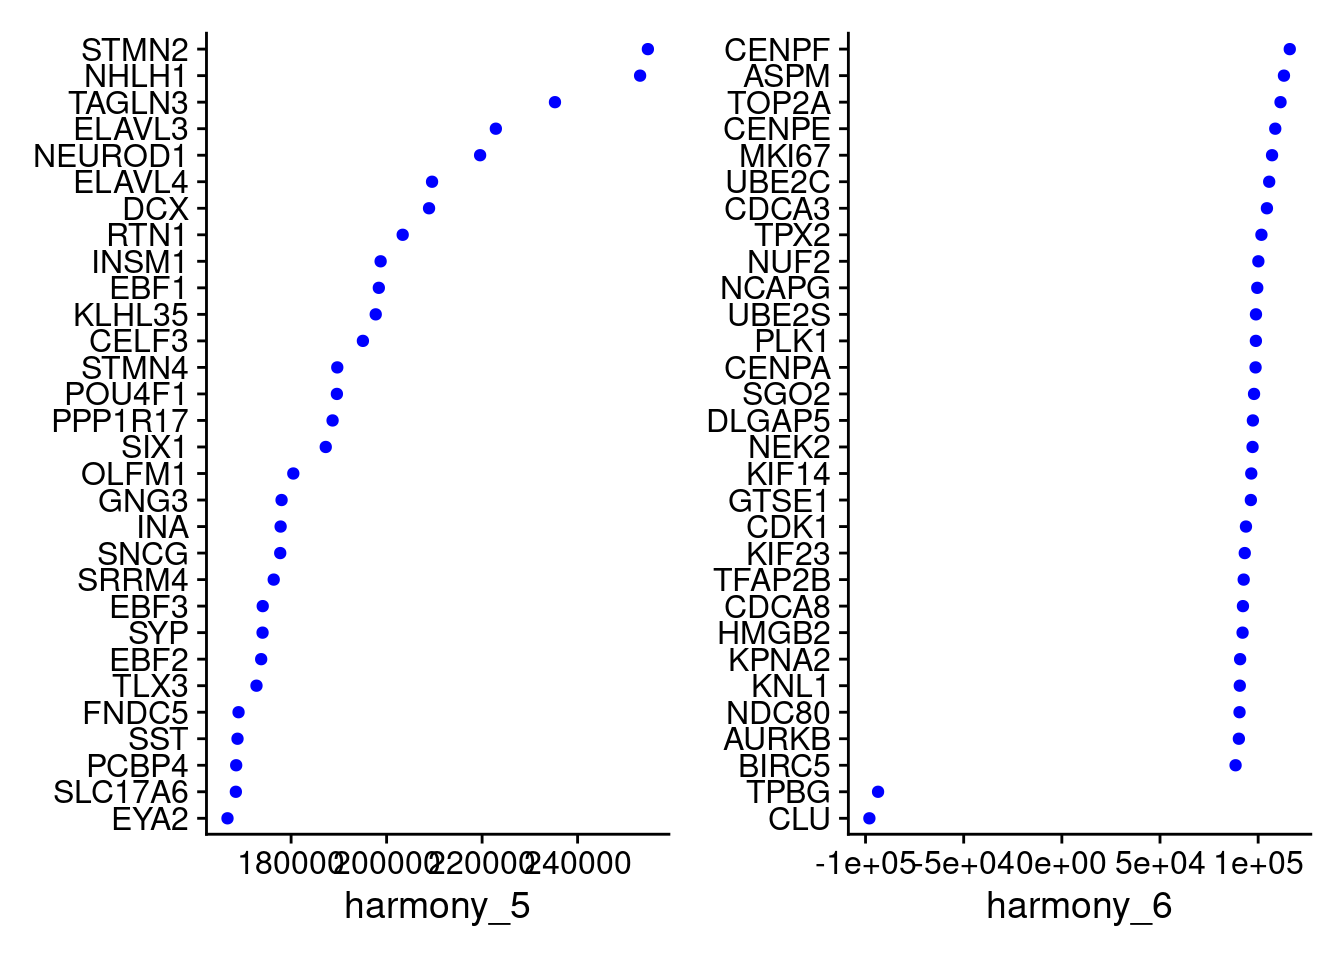
| Version | Author | Date |
|---|---|---|
| 421a225 | KLRhodes | 2020-08-10 |
xlim <- c(min(merged@reductions$harmony@cell.embeddings[,'harmony_1']),
max(merged@reductions$harmony@cell.embeddings[,'harmony_1']))
ylim <- c(min(merged@reductions$harmony@cell.embeddings[,'harmony_2']),
max(merged@reductions$harmony@cell.embeddings[,'harmony_2']))
individuals <- table(merged$individual)
individuals <- individuals[individuals>50]
individuals <- names(individuals)
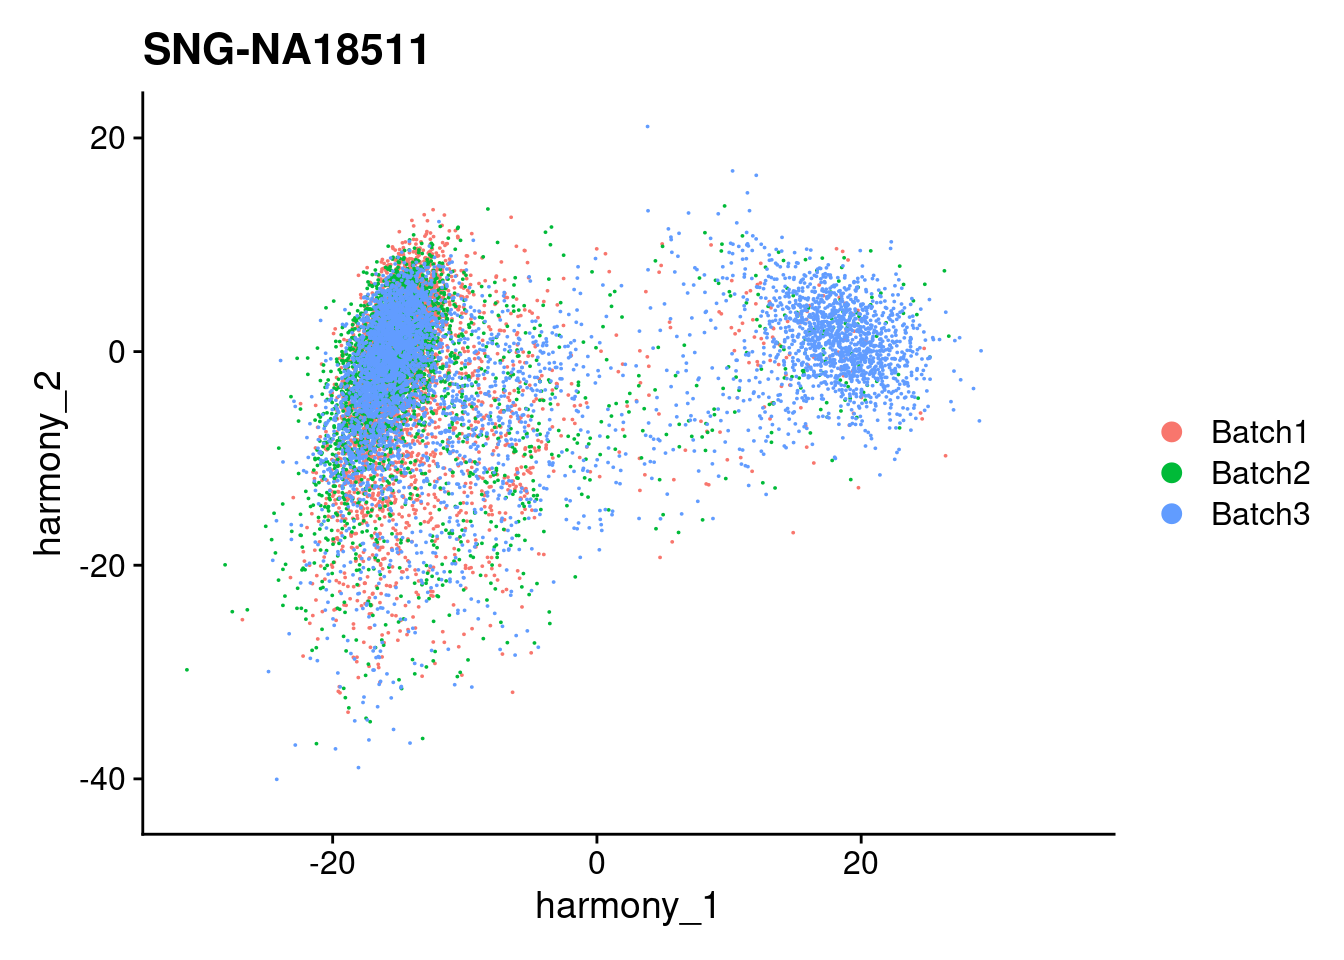
for (i in individuals)
{
print(DimPlot(merged, reduction = "harmony", group.by = c("Batch"), pt.size = 0.01,
cells = WhichCells(merged, expression = individual == i)) +
xlim(xlim) + ylim(ylim) + ggtitle(i))
}
| Version | Author | Date |
|---|---|---|
| 421a225 | KLRhodes | 2020-08-10 |
| Version | Author | Date |
|---|---|---|
| 421a225 | KLRhodes | 2020-08-10 |
| Version | Author | Date |
|---|---|---|
| 421a225 | KLRhodes | 2020-08-10 |
DimPlot(merged, reduction = "umap")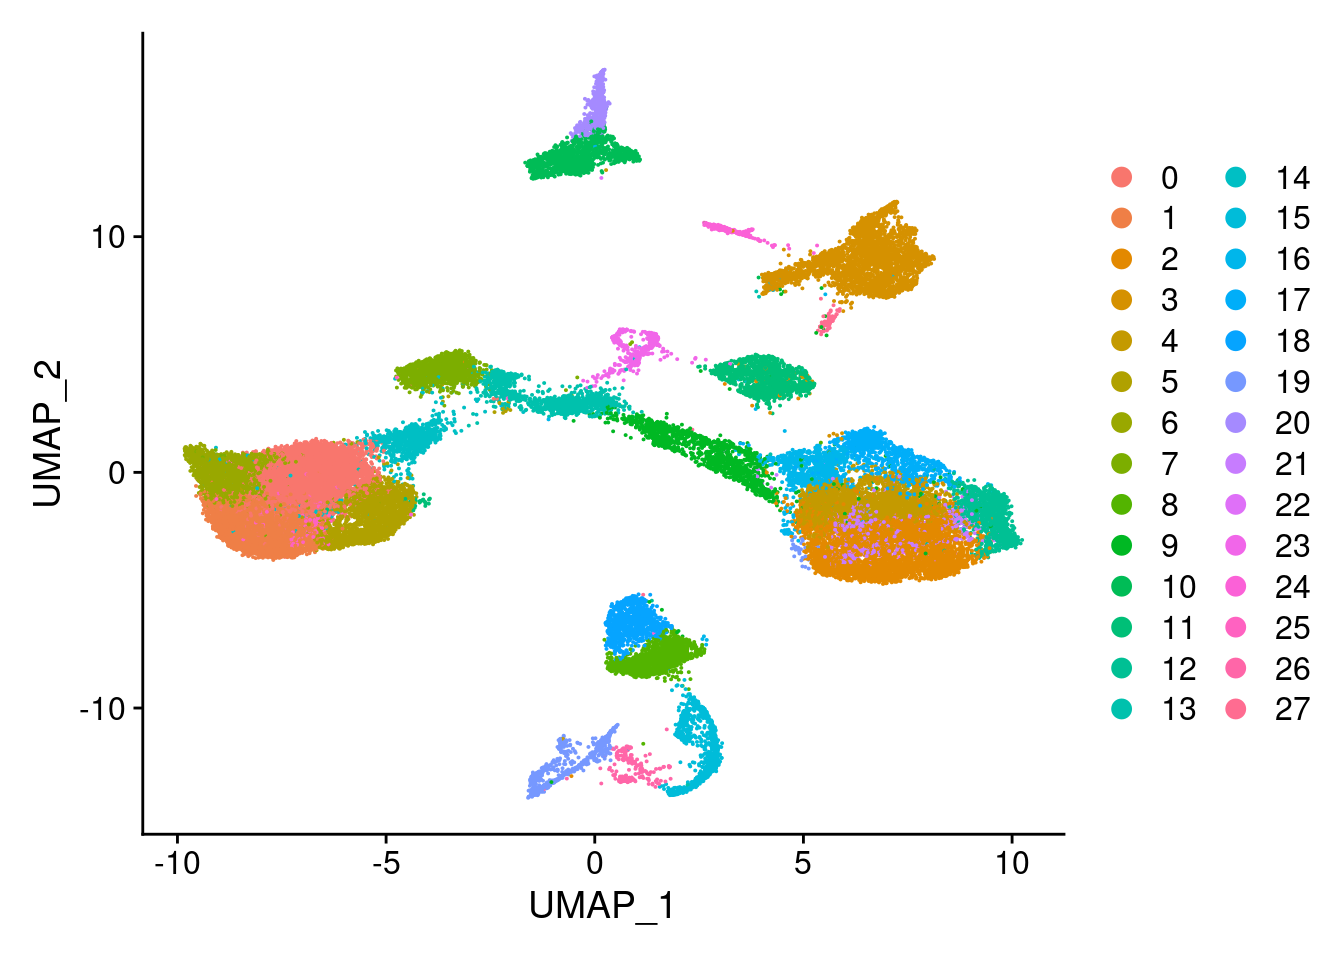
| Version | Author | Date |
|---|---|---|
| 421a225 | KLRhodes | 2020-08-10 |
DimPlot(merged, reduction = "umap", group.by = "Batch")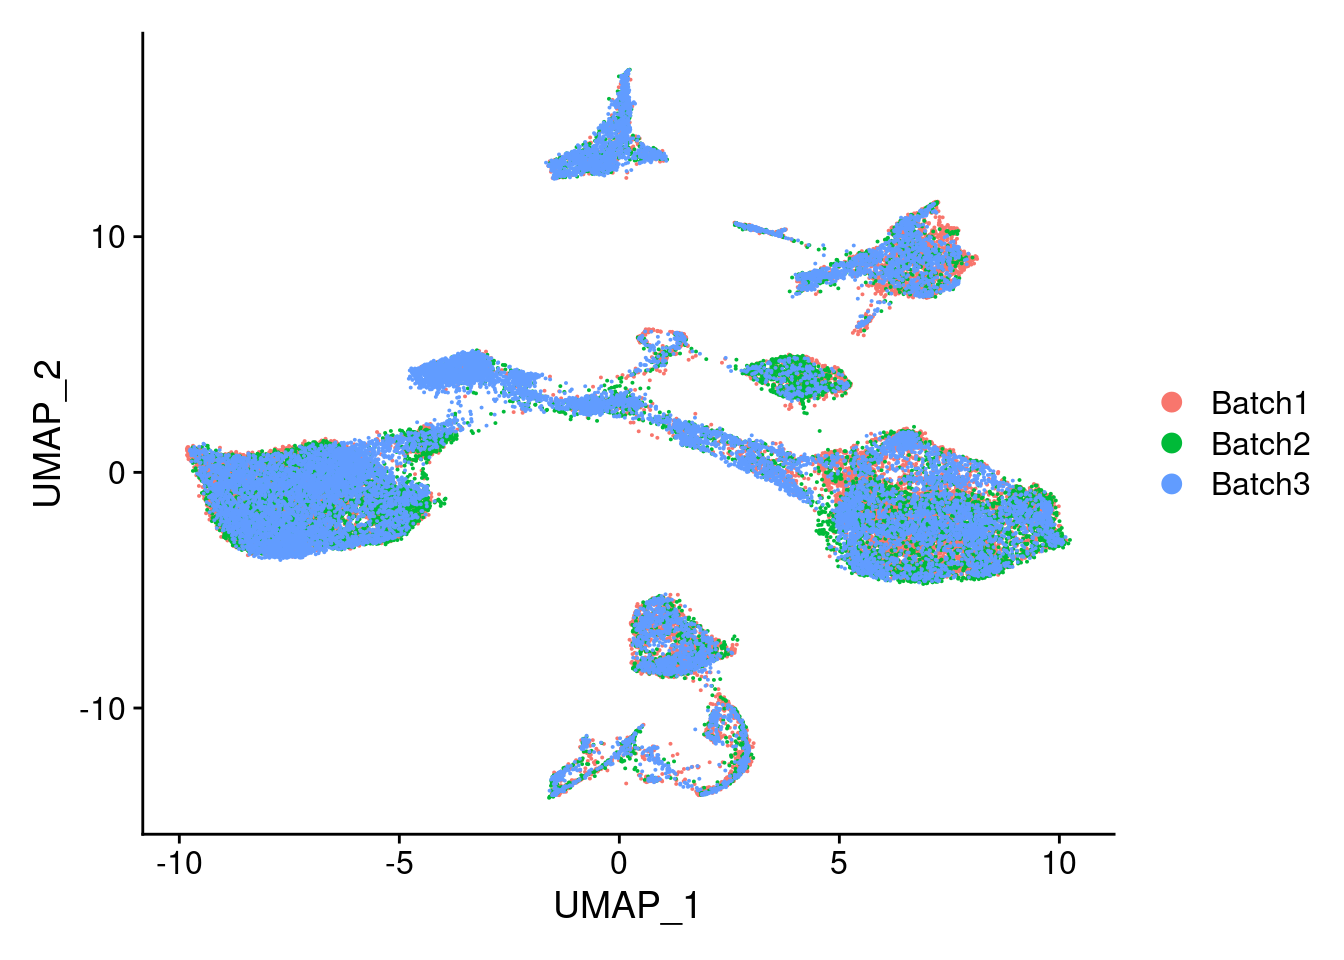
| Version | Author | Date |
|---|---|---|
| 421a225 | KLRhodes | 2020-08-10 |
DimPlot(merged, reduction = "umap", group.by = "individual")
| Version | Author | Date |
|---|---|---|
| 421a225 | KLRhodes | 2020-08-10 |
xlim <- c(min(merged@reductions$umap@cell.embeddings[,'UMAP_1']),
max(merged@reductions$umap@cell.embeddings[,'UMAP_1']))
ylim <- c(min(merged@reductions$umap@cell.embeddings[,'UMAP_2']),
max(merged@reductions$umap@cell.embeddings[,'UMAP_2']))
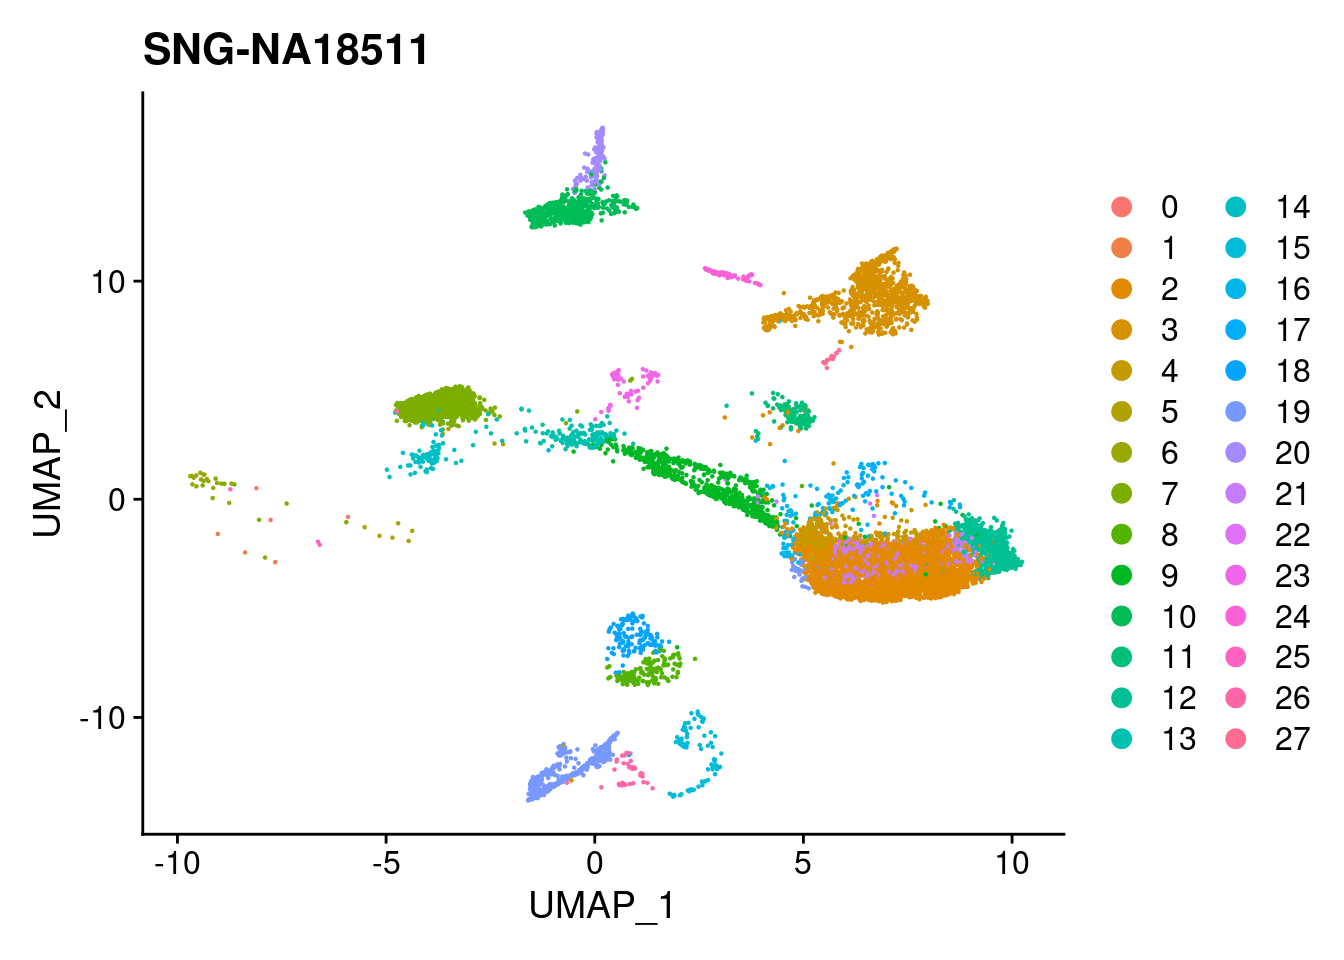
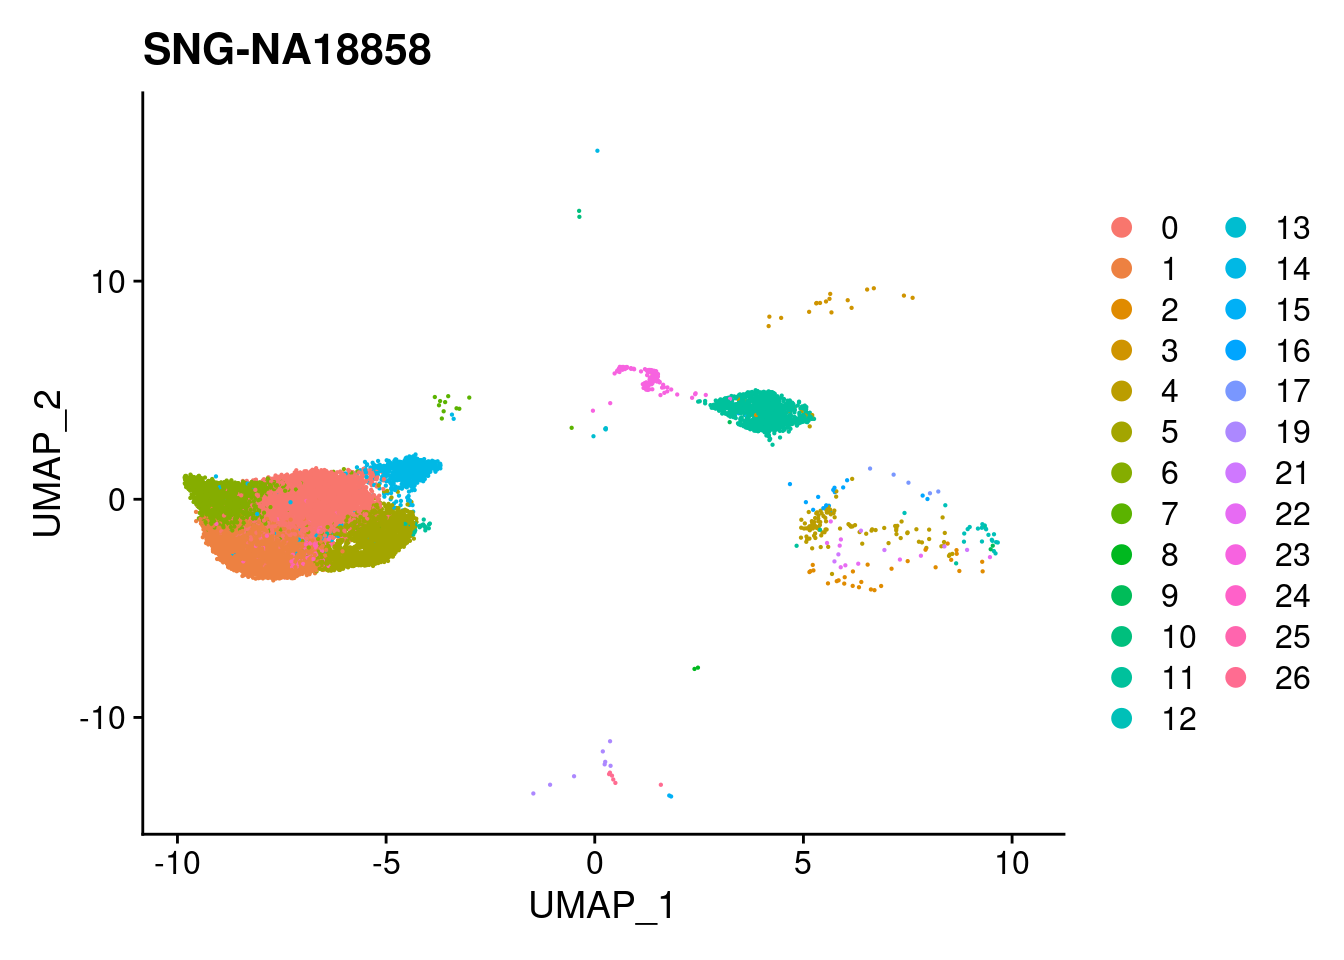
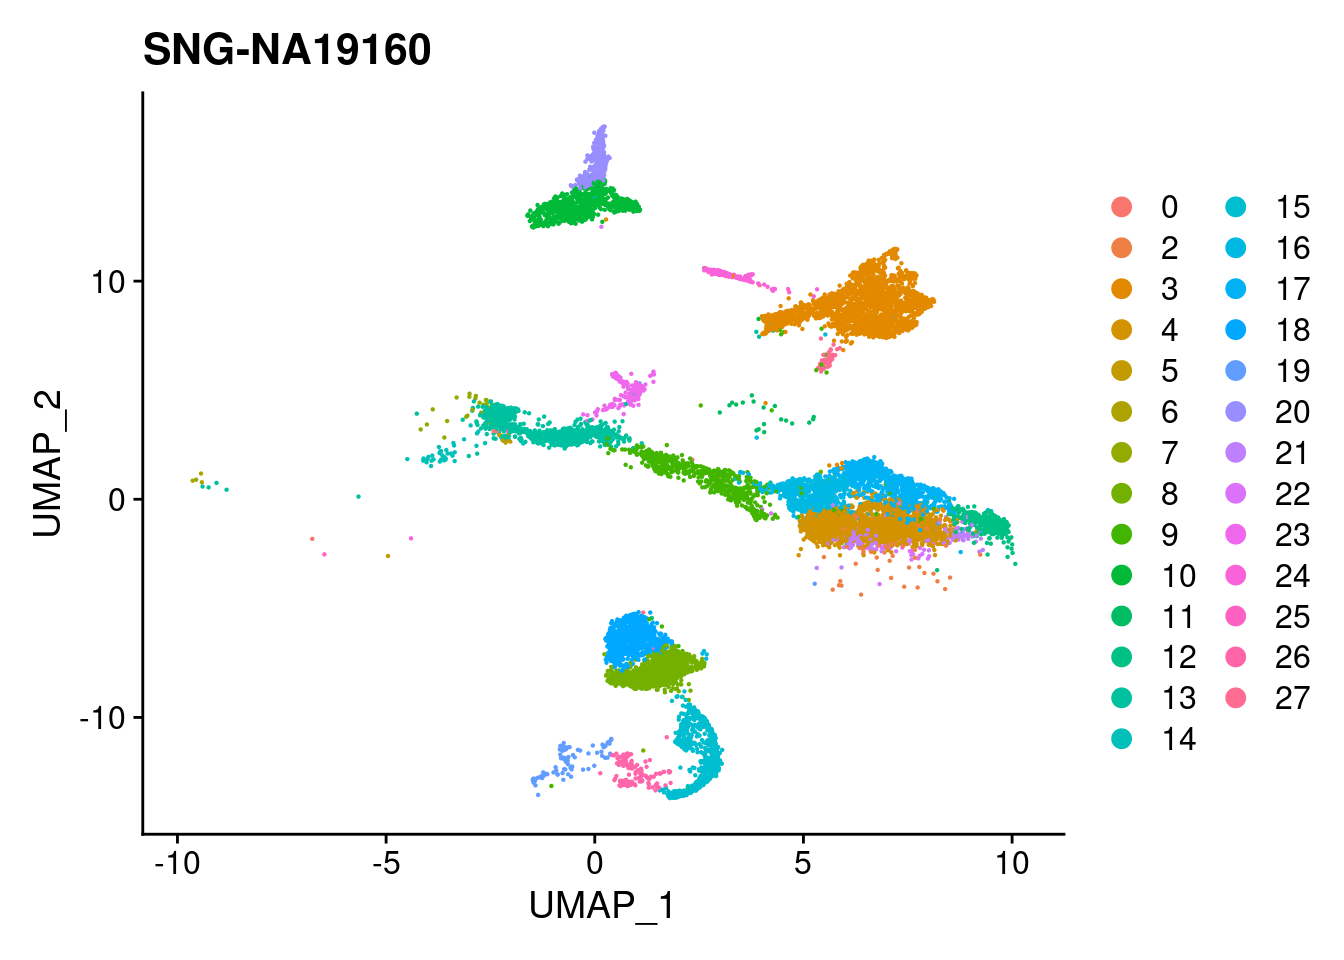
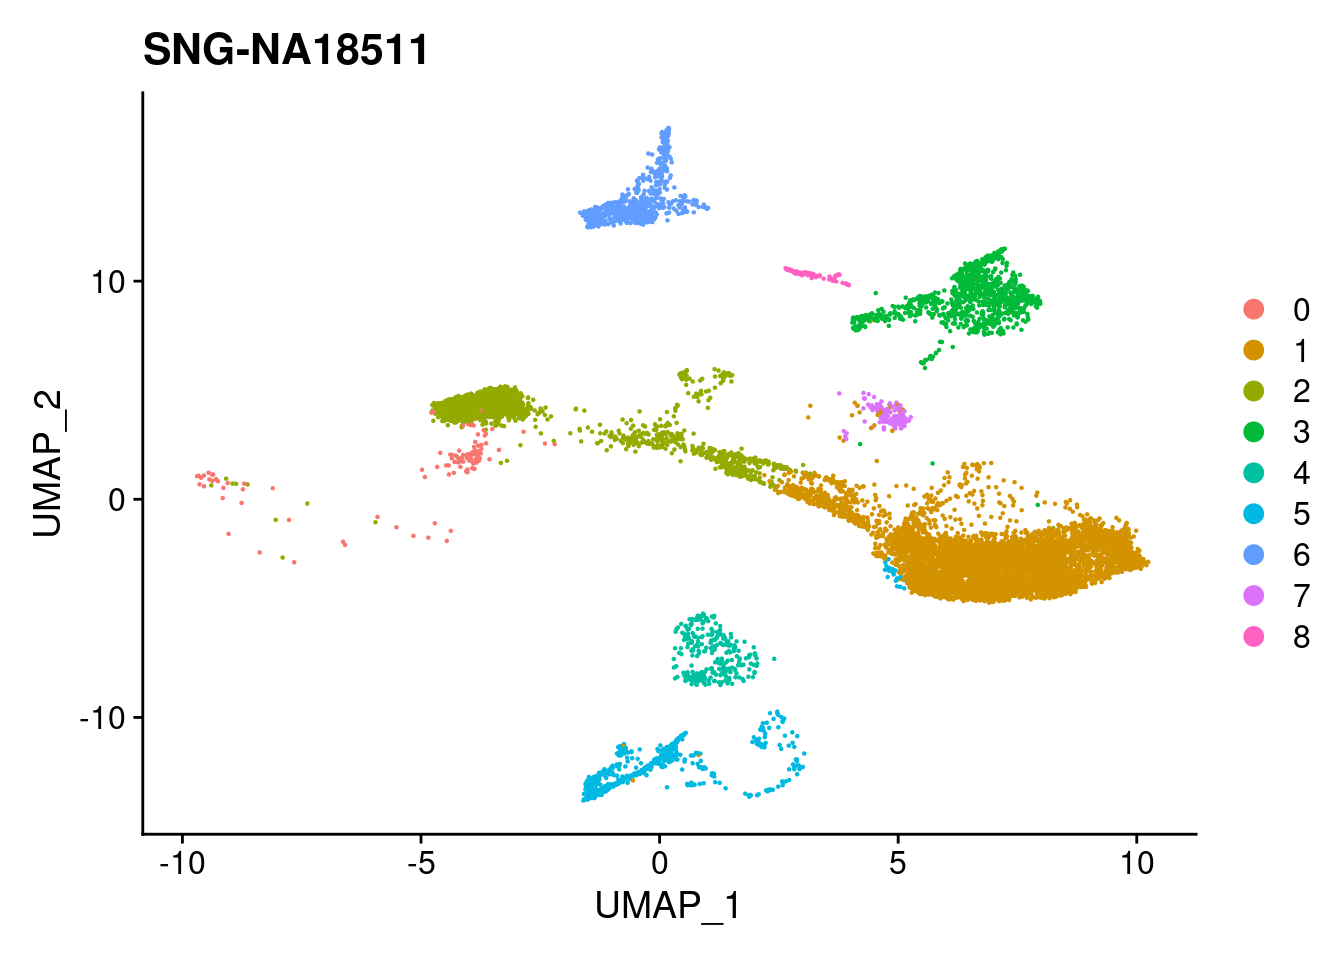
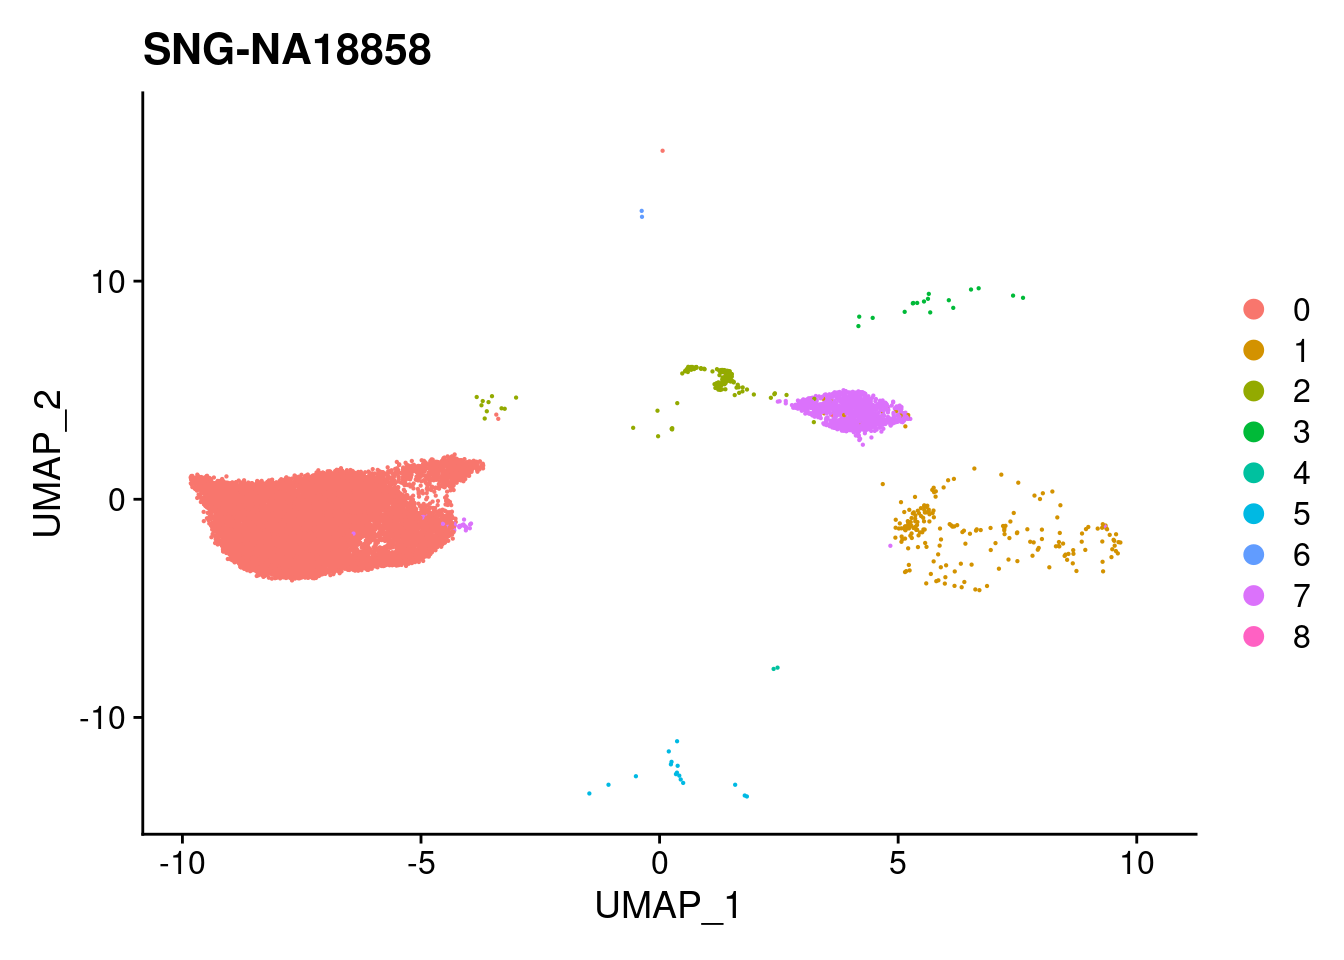
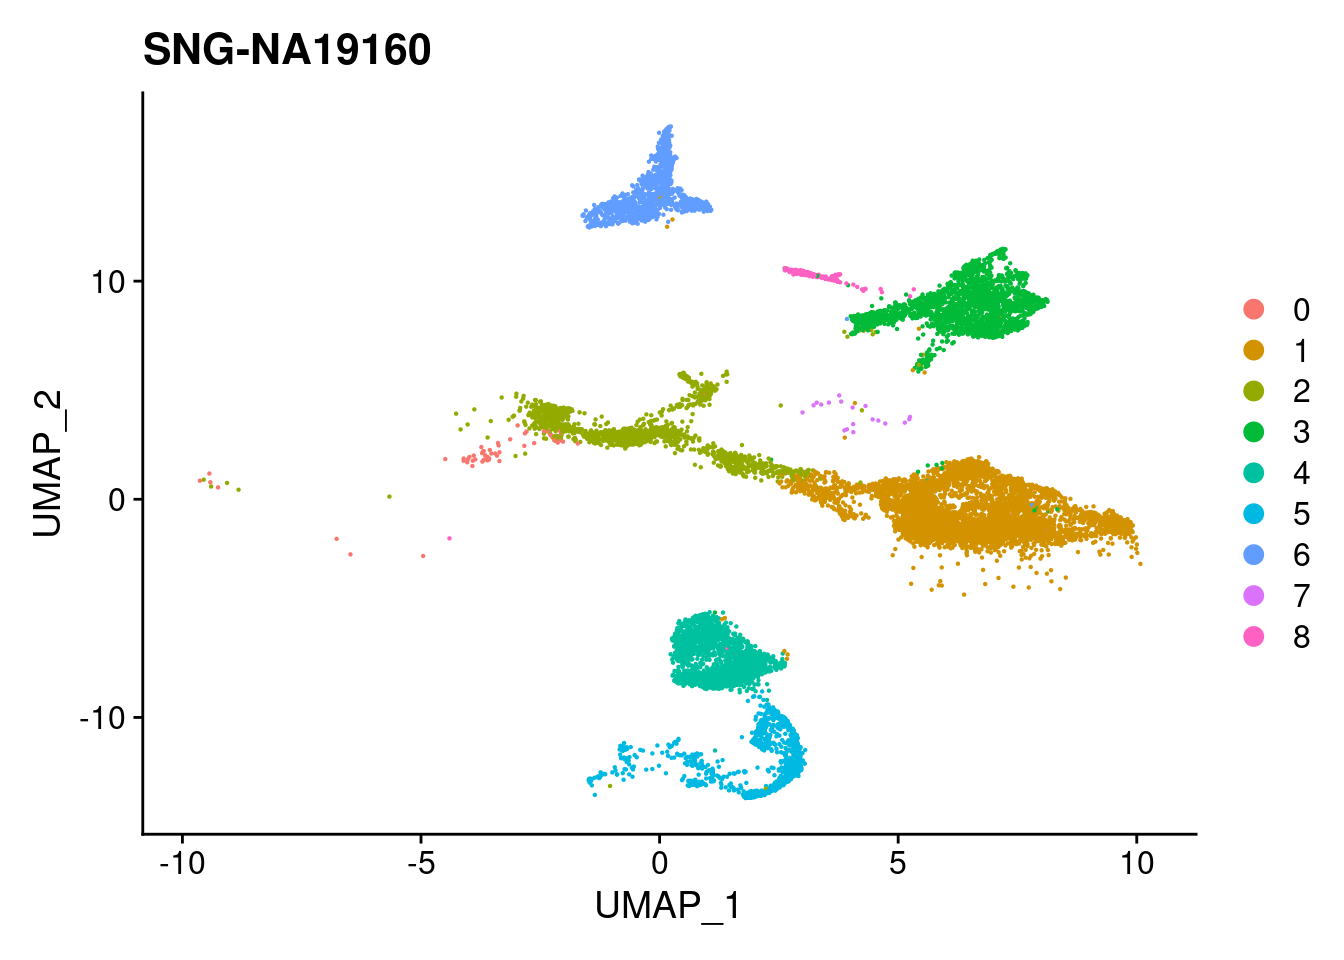
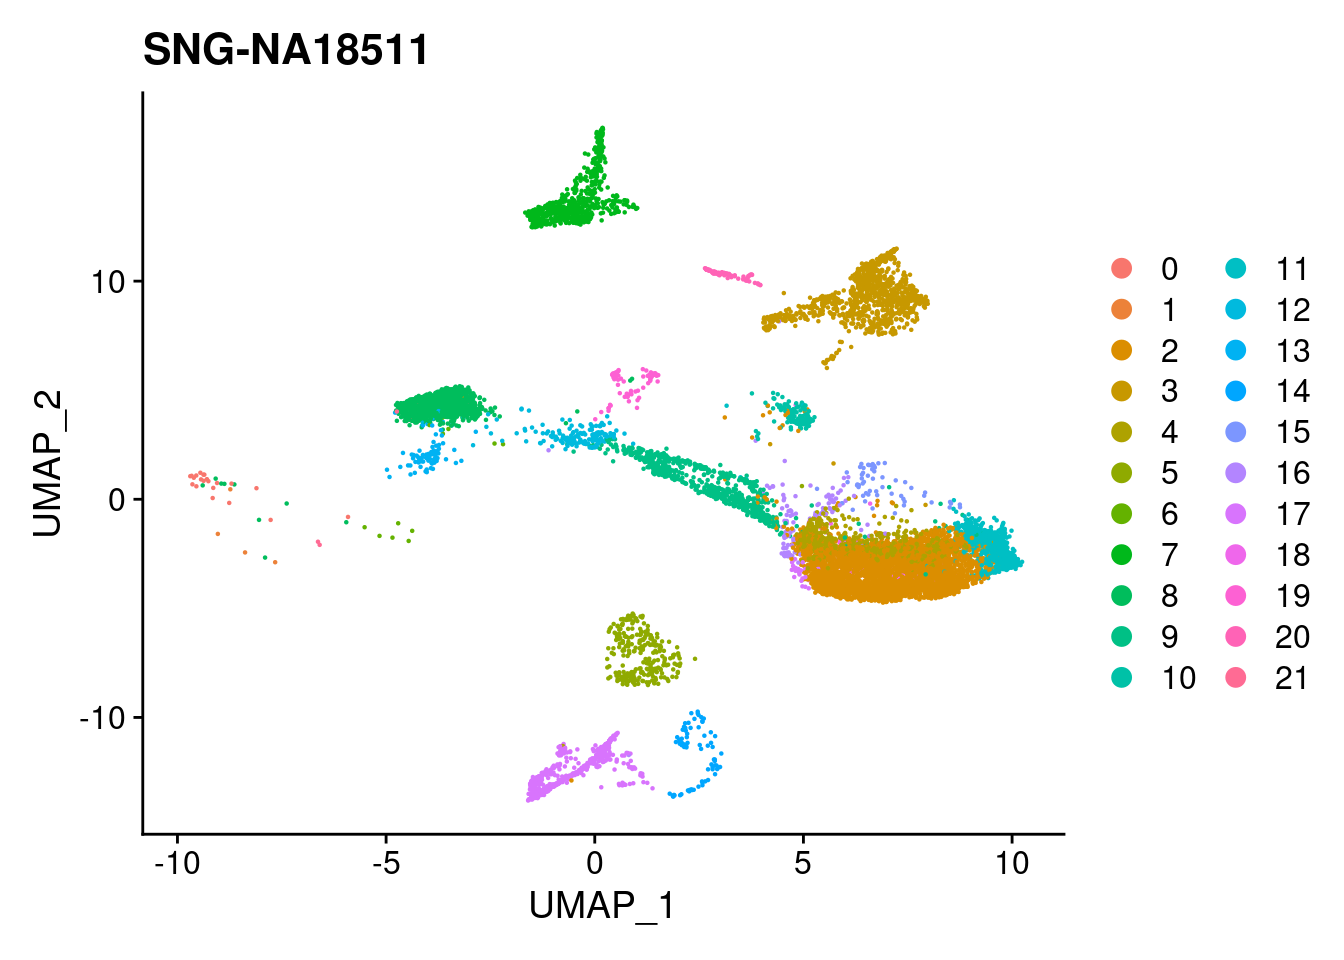
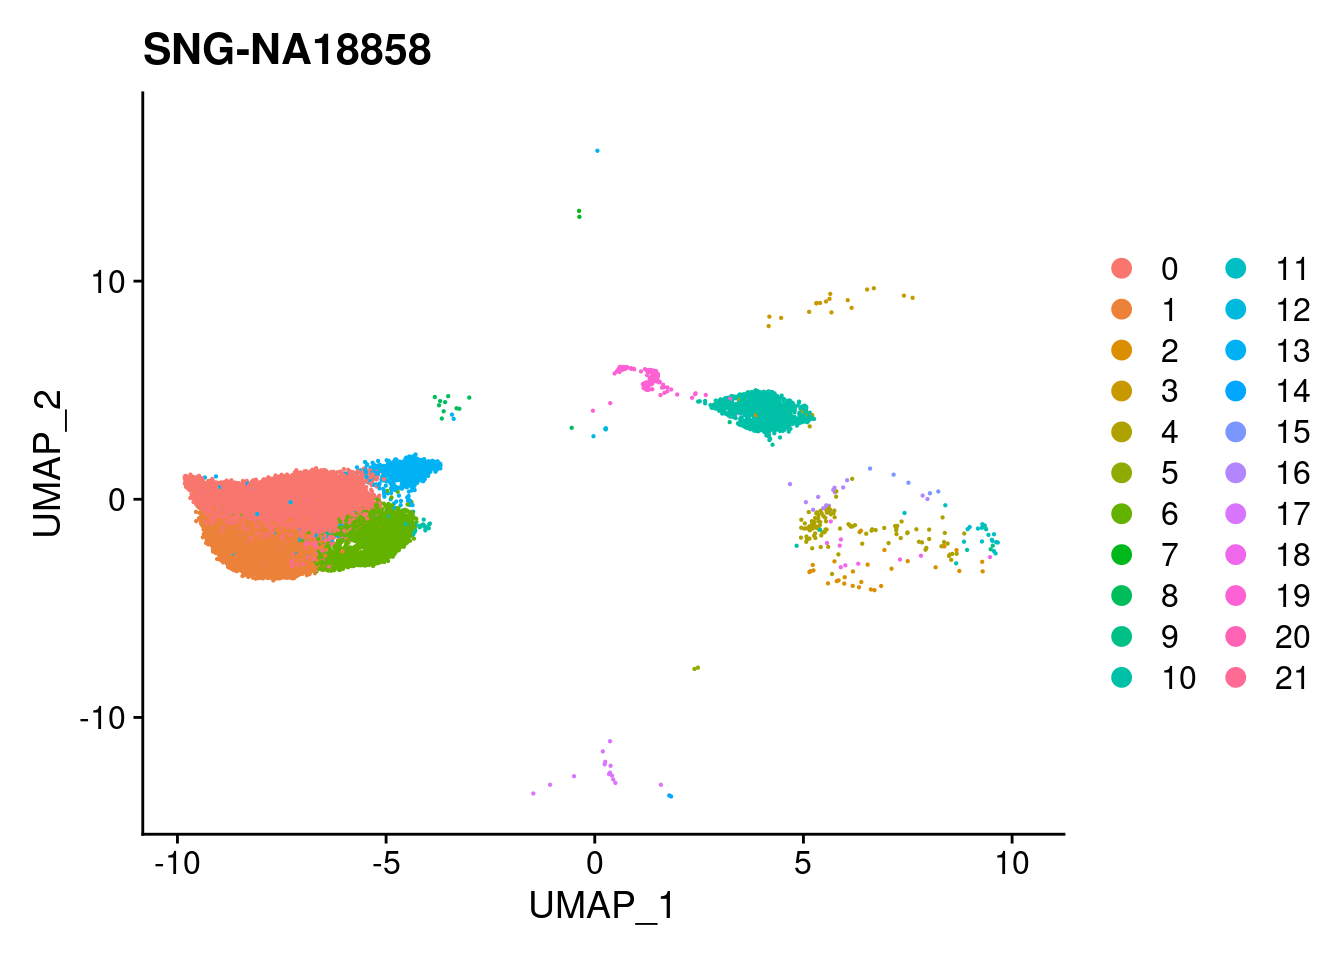
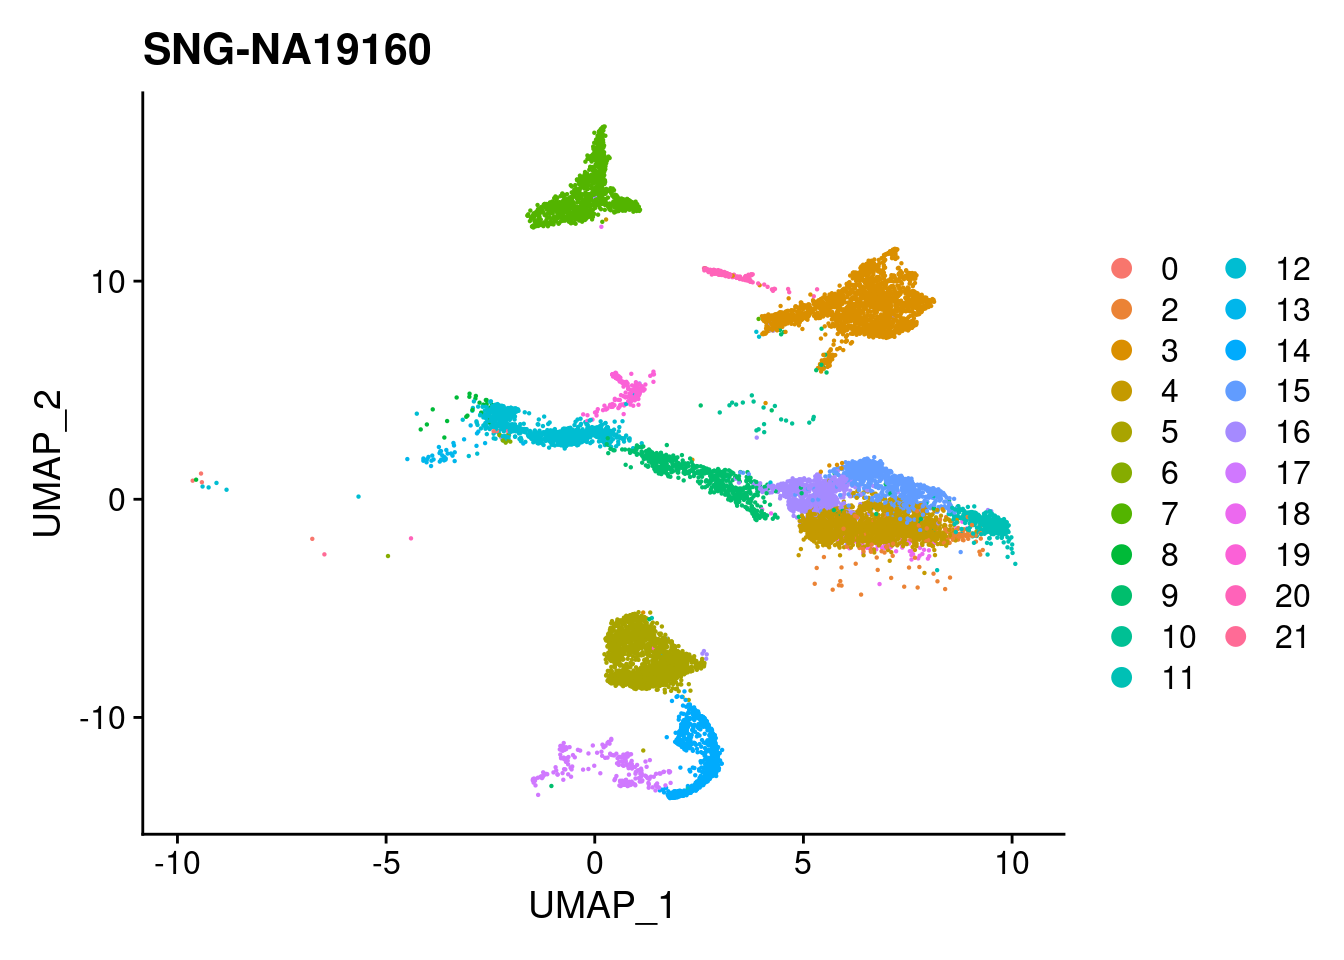
for (i in individuals)
{
print(DimPlot(merged, reduction = "umap",
cells = WhichCells(merged, expression = individual == i)) +
xlim(xlim) + ylim(ylim) + ggtitle(i))
}
| Version | Author | Date |
|---|---|---|
| 421a225 | KLRhodes | 2020-08-10 |
| Version | Author | Date |
|---|---|---|
| 421a225 | KLRhodes | 2020-08-10 |
| Version | Author | Date |
|---|---|---|
| 421a225 | KLRhodes | 2020-08-10 |
plots2<- DimPlot(merged, group.by = "individual", split.by = "Batch")
plots2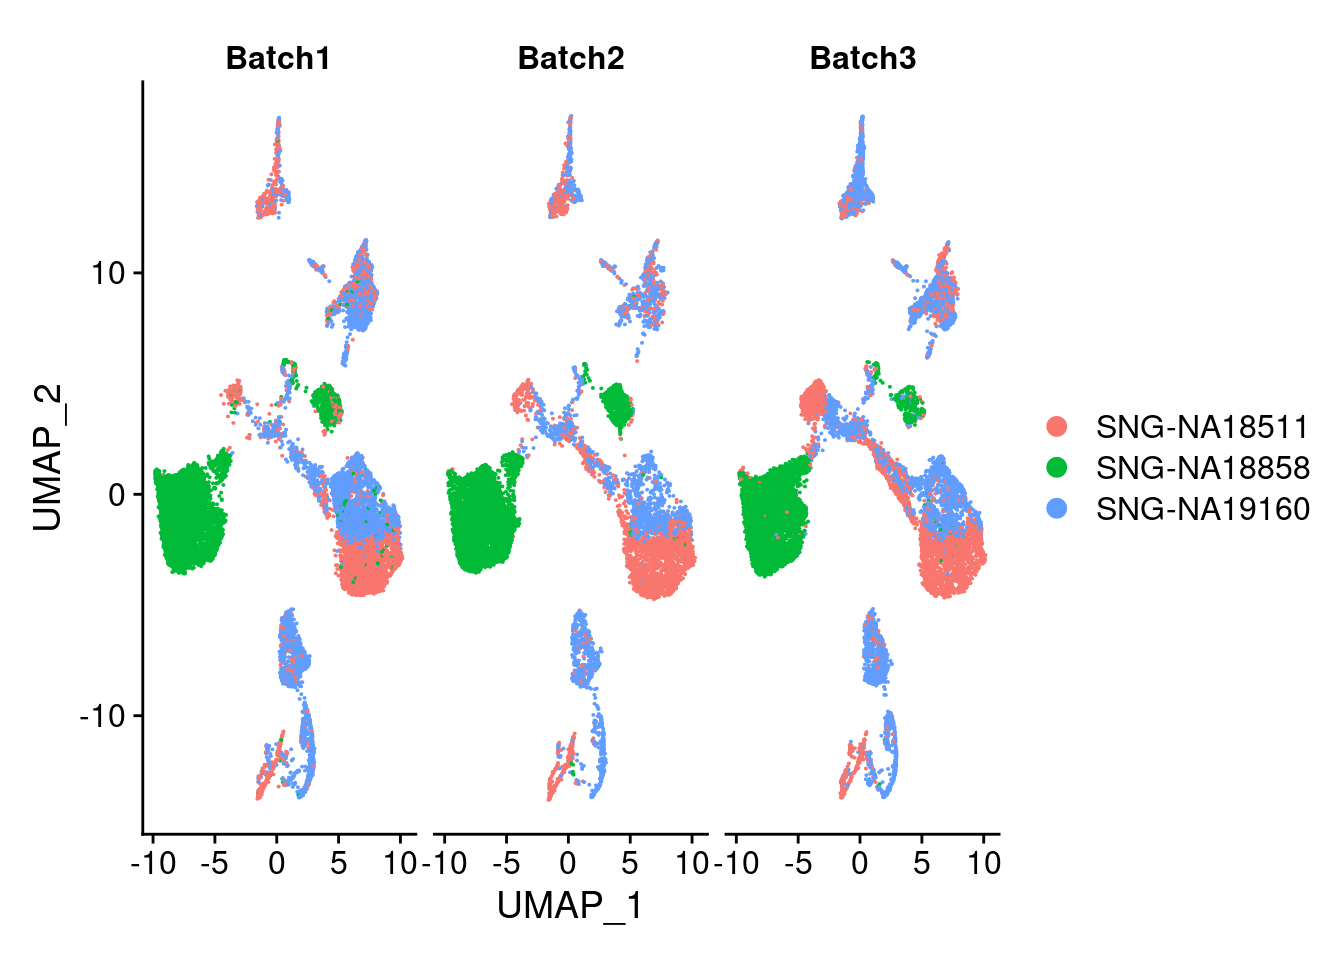
| Version | Author | Date |
|---|---|---|
| 421a225 | KLRhodes | 2020-08-10 |
DimPlot(merged, group.by = "Batch", split.by = c("individual"))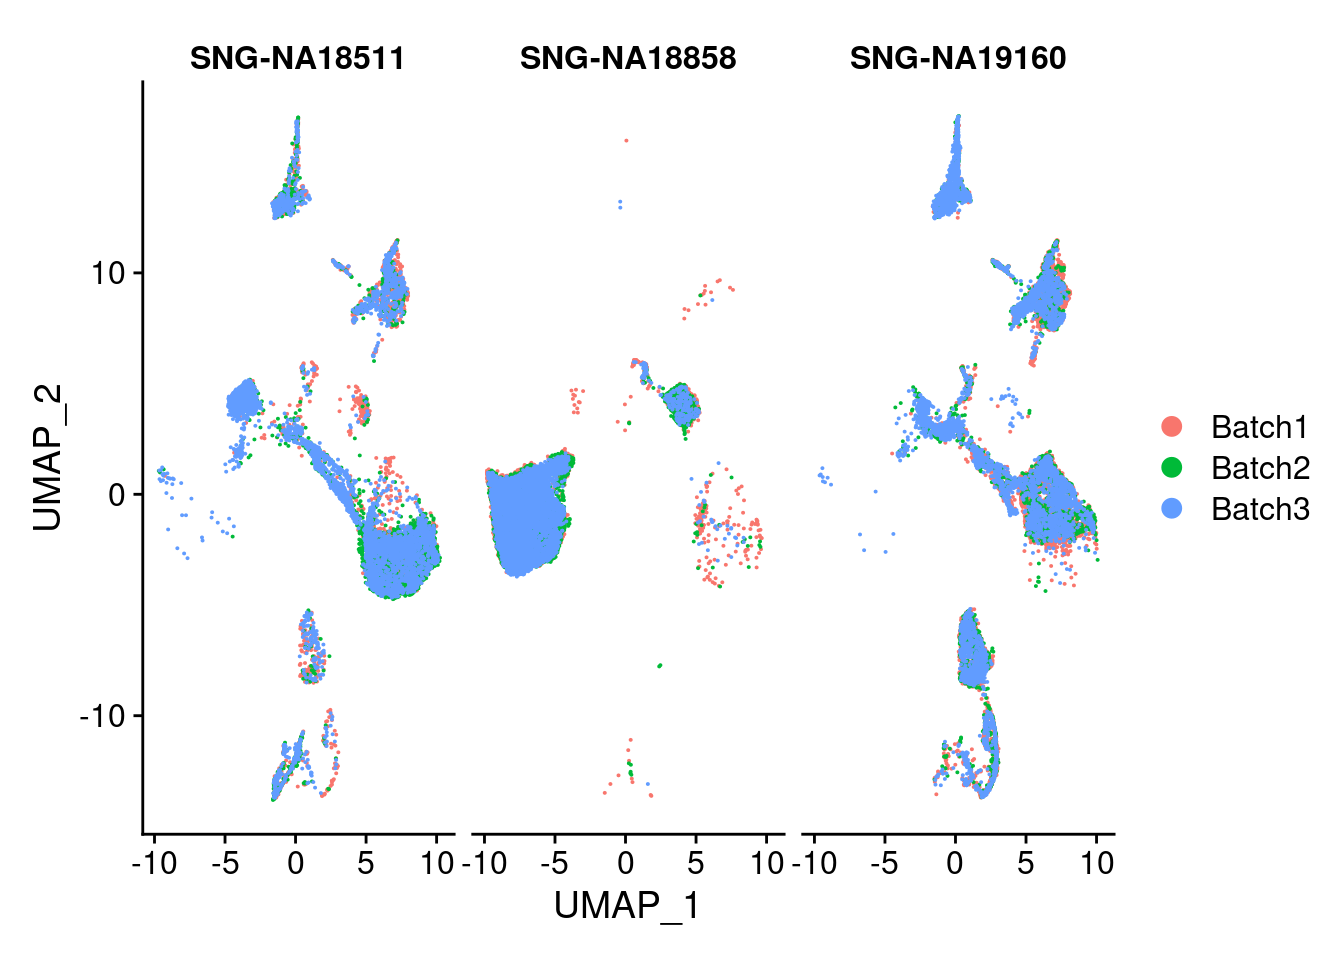
| Version | Author | Date |
|---|---|---|
| 421a225 | KLRhodes | 2020-08-10 |
DimPlot(merged, group.by = "SCT_snn_res.1", split.by = c("Batch"), label=T)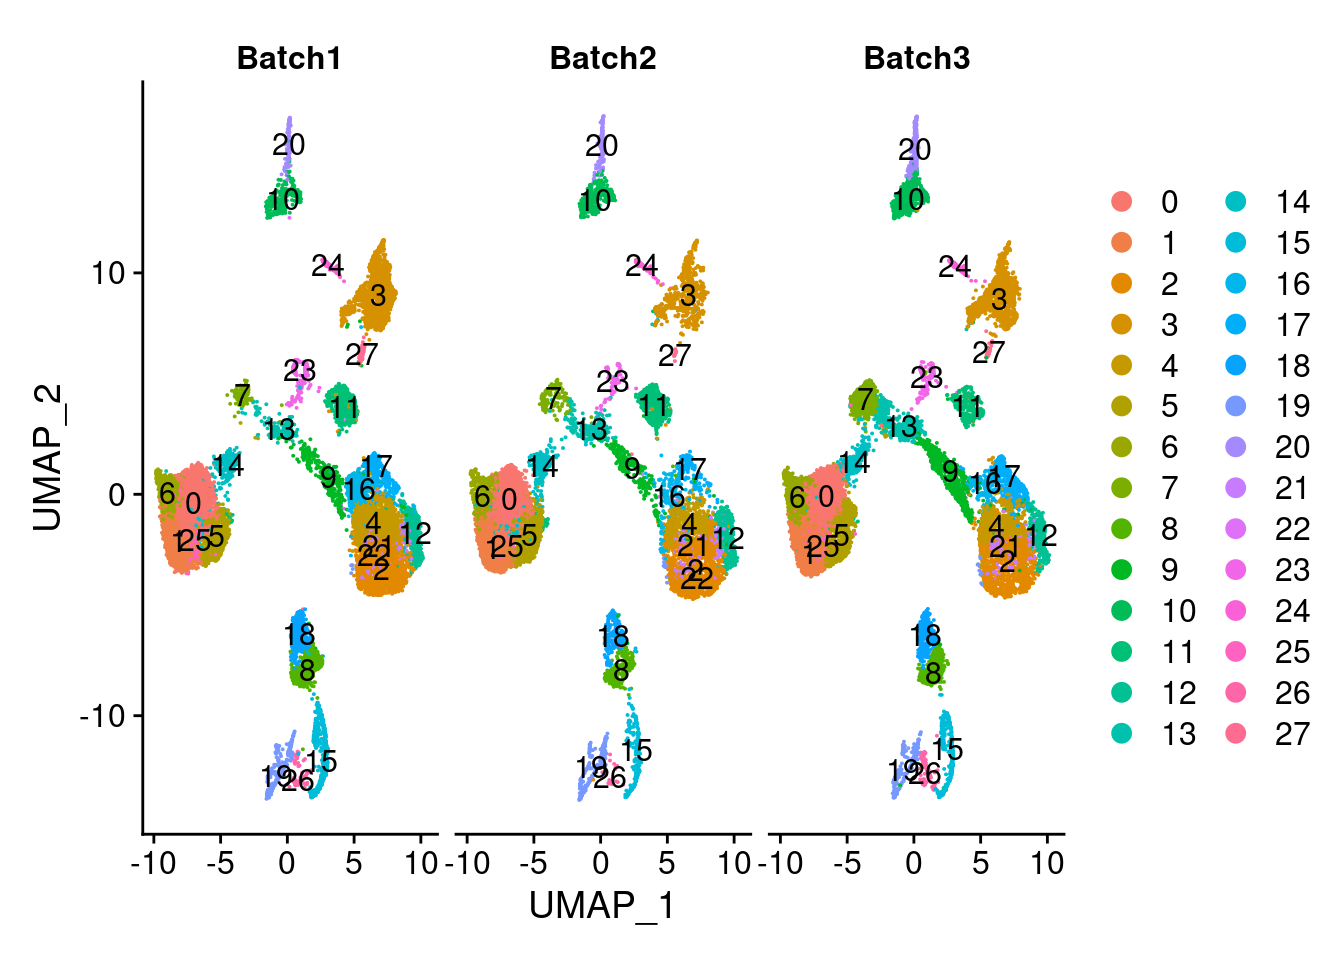
| Version | Author | Date |
|---|---|---|
| 421a225 | KLRhodes | 2020-08-10 |
DimPlot(merged, reduction = "harmony", group.by = "SCT_snn_res.1", split.by = "Batch", combine = F)[[1]]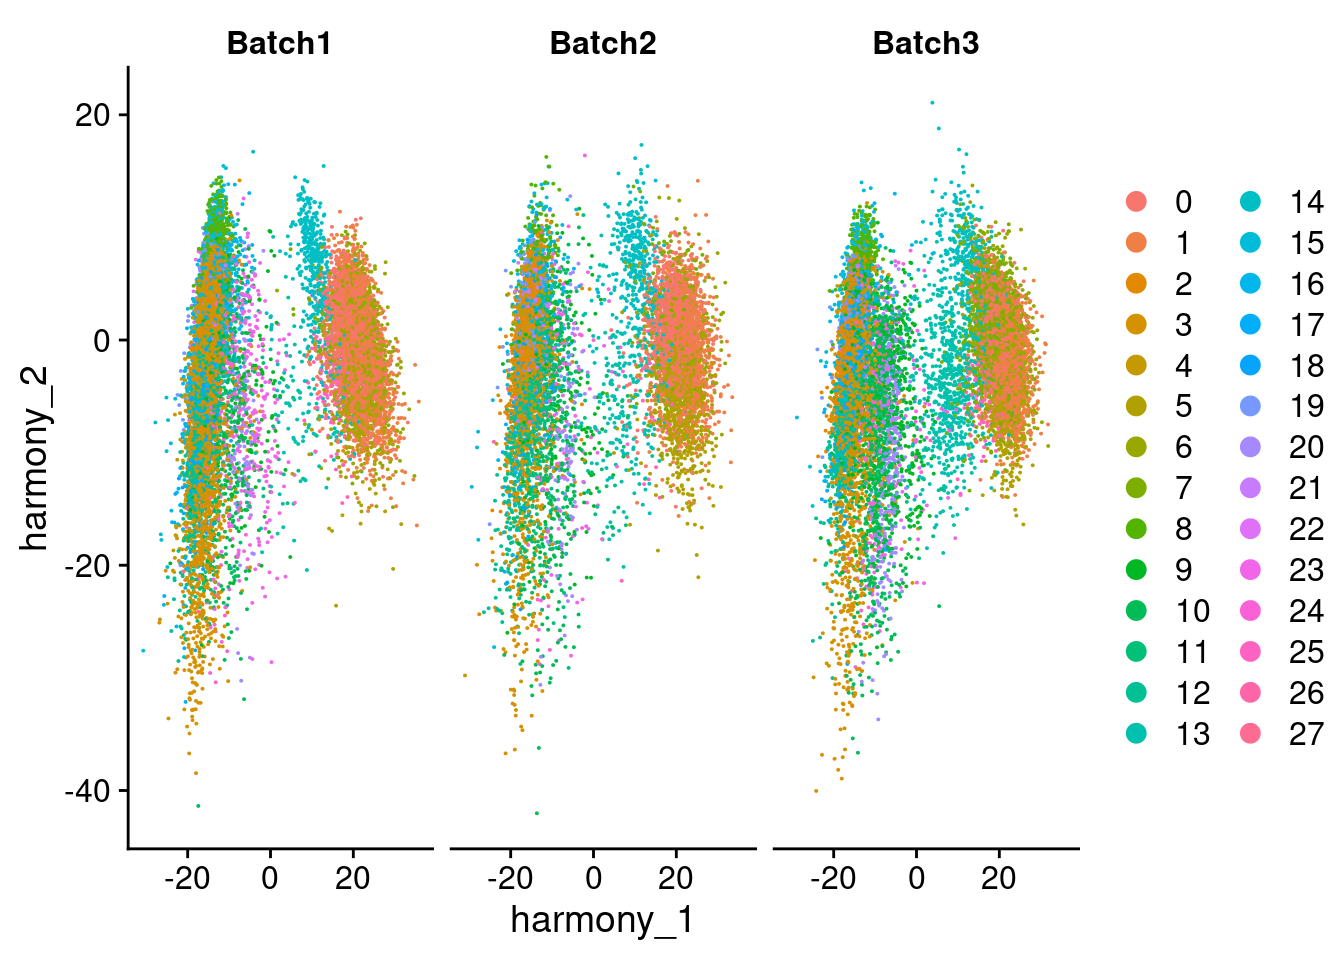
| Version | Author | Date |
|---|---|---|
| 421a225 | KLRhodes | 2020-08-10 |
VlnPlot(merged, features = c("POU5F1", "PAX6", "TNNT2", "SOX17", "HAND1", "LUM"), ncol=2)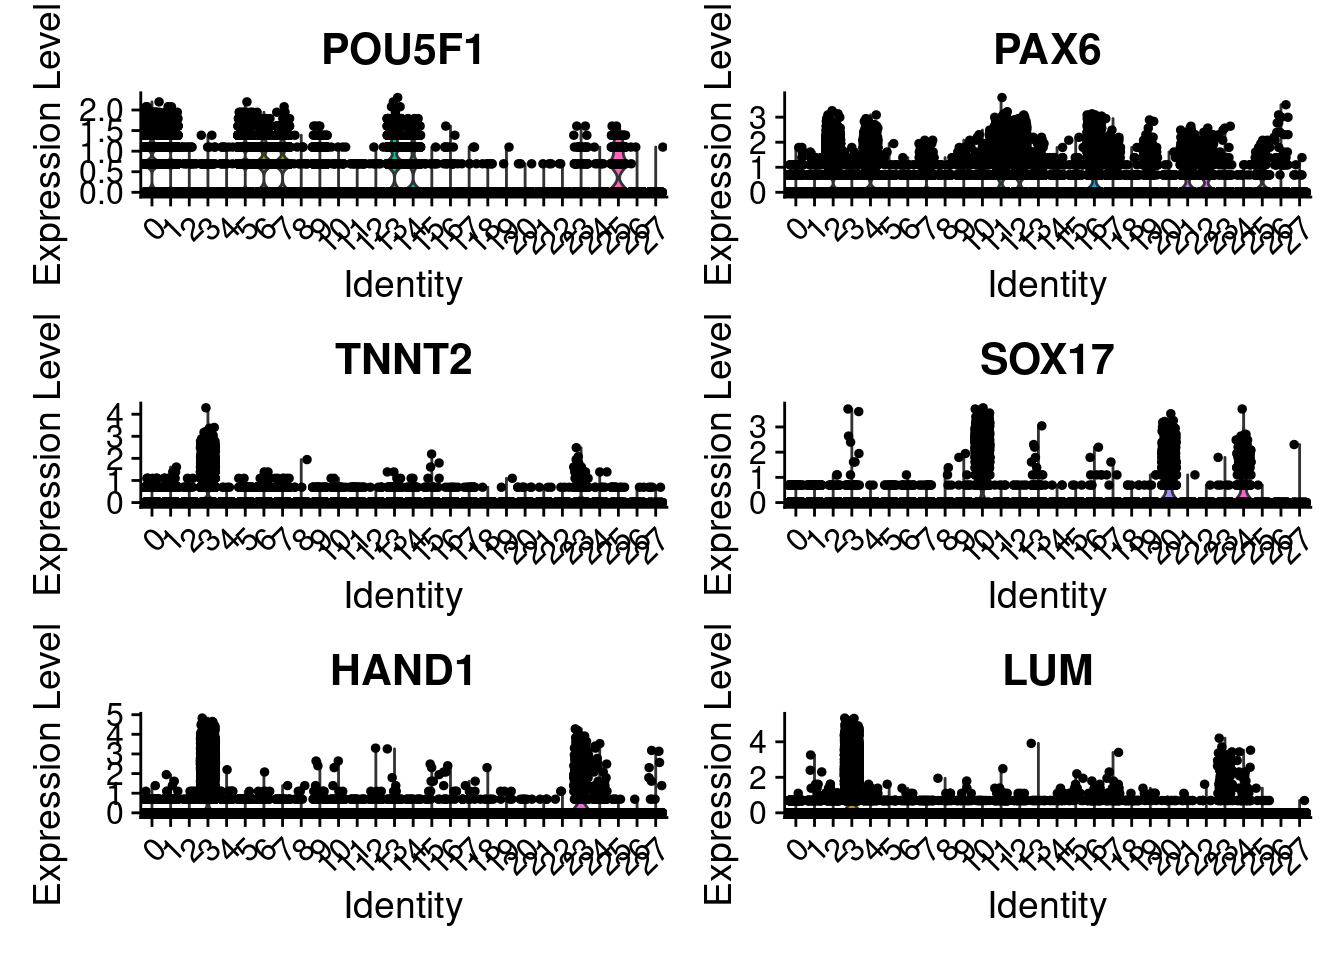
| Version | Author | Date |
|---|---|---|
| 421a225 | KLRhodes | 2020-08-10 |
#pluripotent markers
FeaturePlot(merged, features = c("POU5F1", "SOX2", "NANOG"), pt.size = 0.2, ncol=3)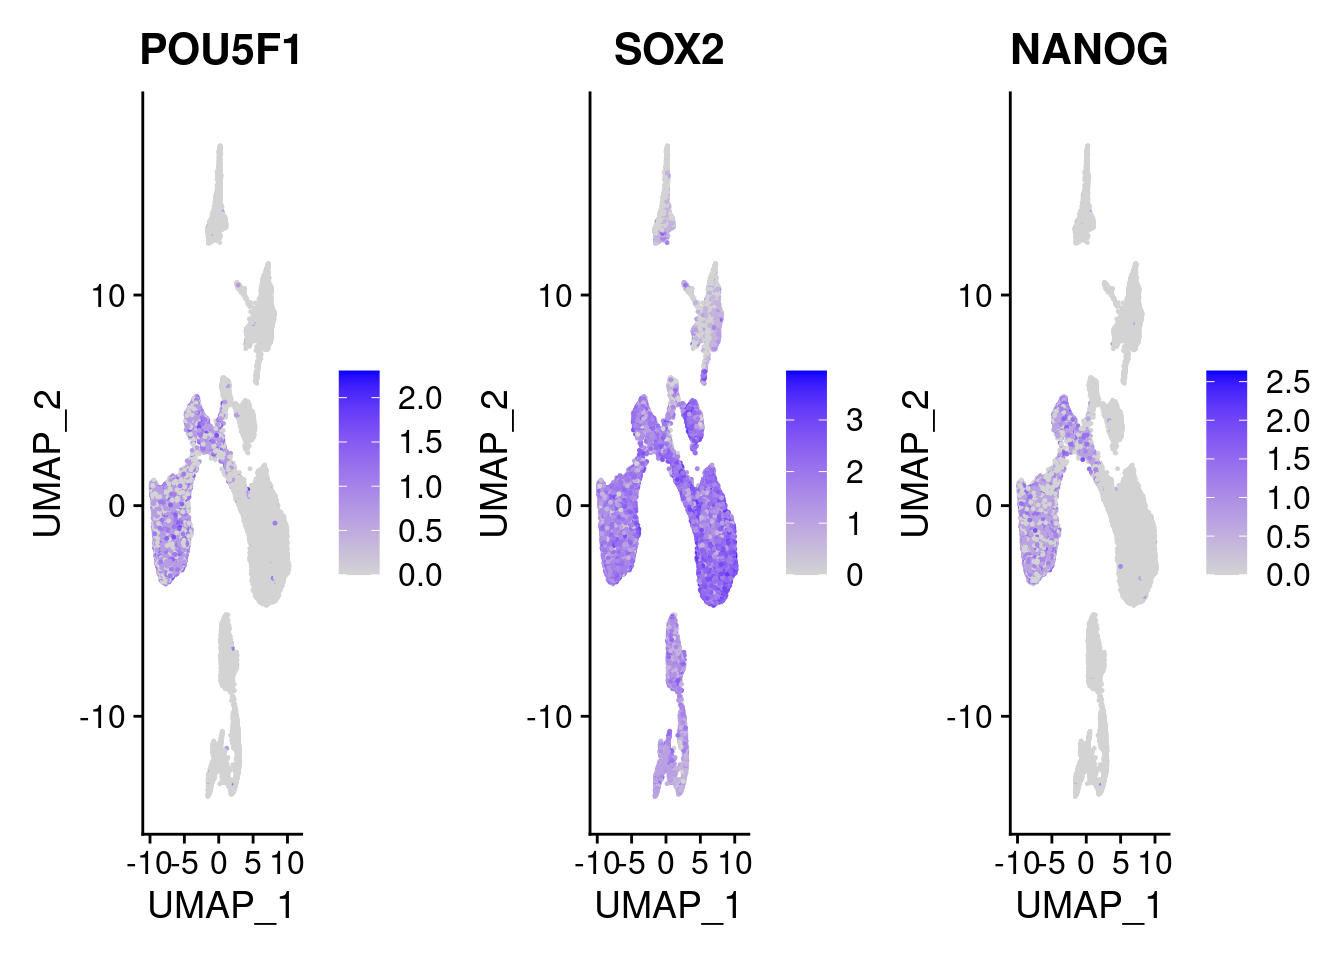
| Version | Author | Date |
|---|---|---|
| 421a225 | KLRhodes | 2020-08-10 |
#Endoderm markers (first 3 definitive endo, 4-6 liver markers, )
FeaturePlot(merged, features = c("SOX17","CLDN6","FOXA2", "TTR", "AFP", "FGB"), pt.size = 0.2, combine = F)
[[1]]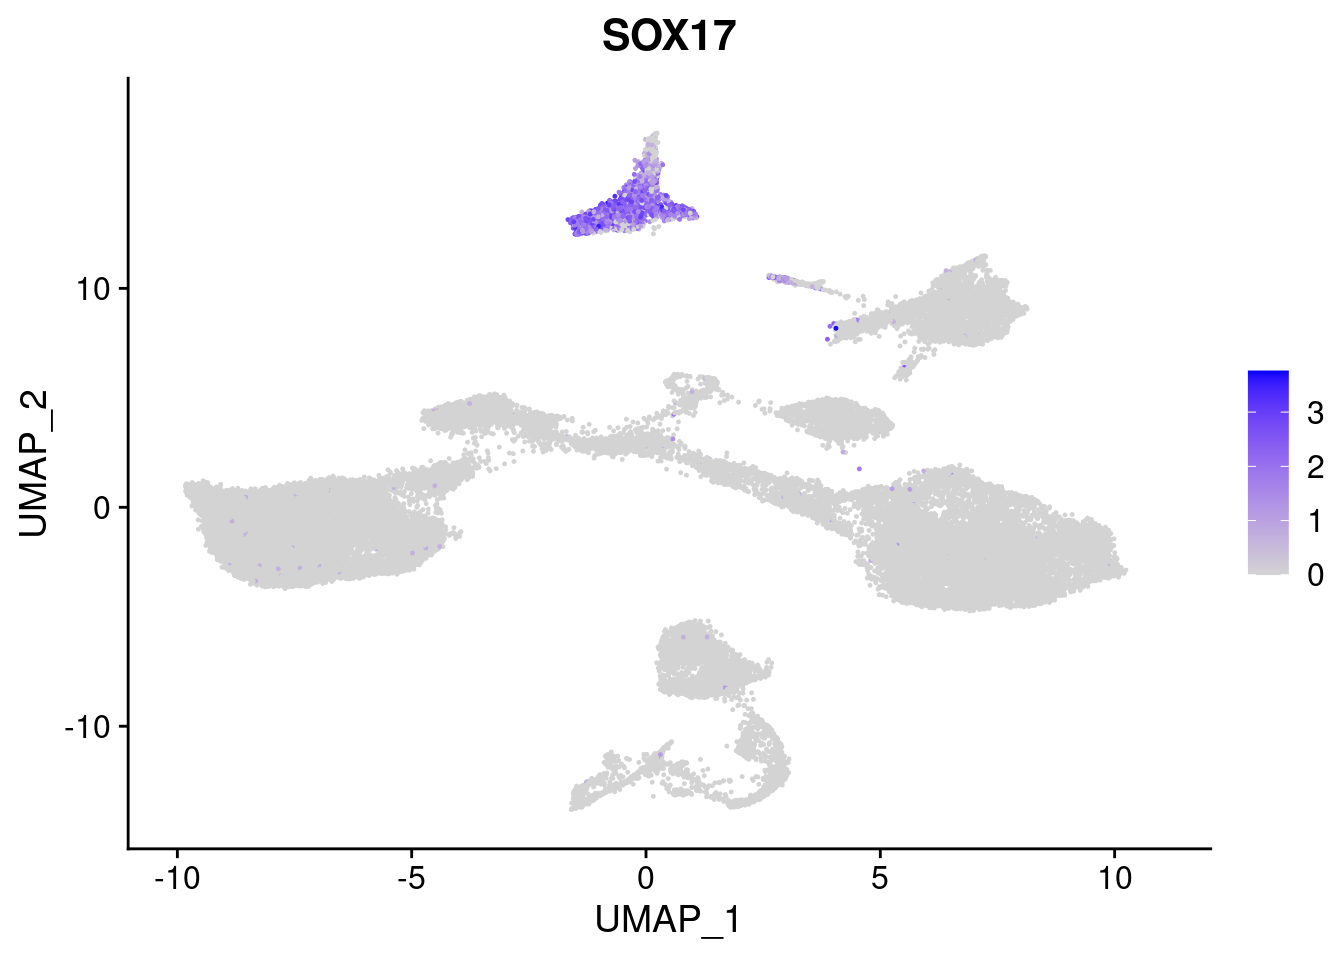
| Version | Author | Date |
|---|---|---|
| 421a225 | KLRhodes | 2020-08-10 |
[[2]]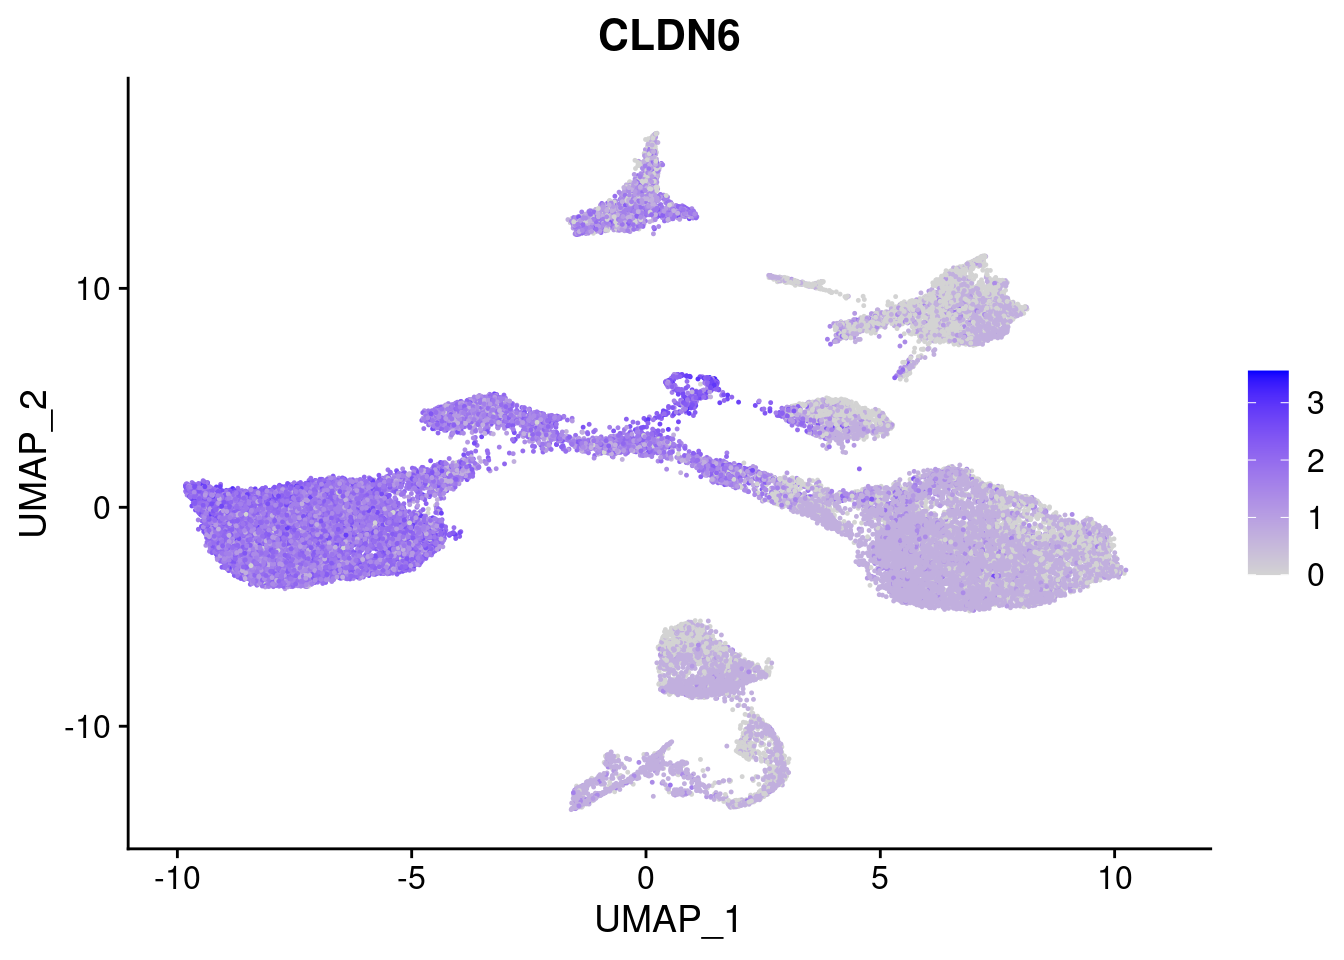
| Version | Author | Date |
|---|---|---|
| 421a225 | KLRhodes | 2020-08-10 |
[[3]]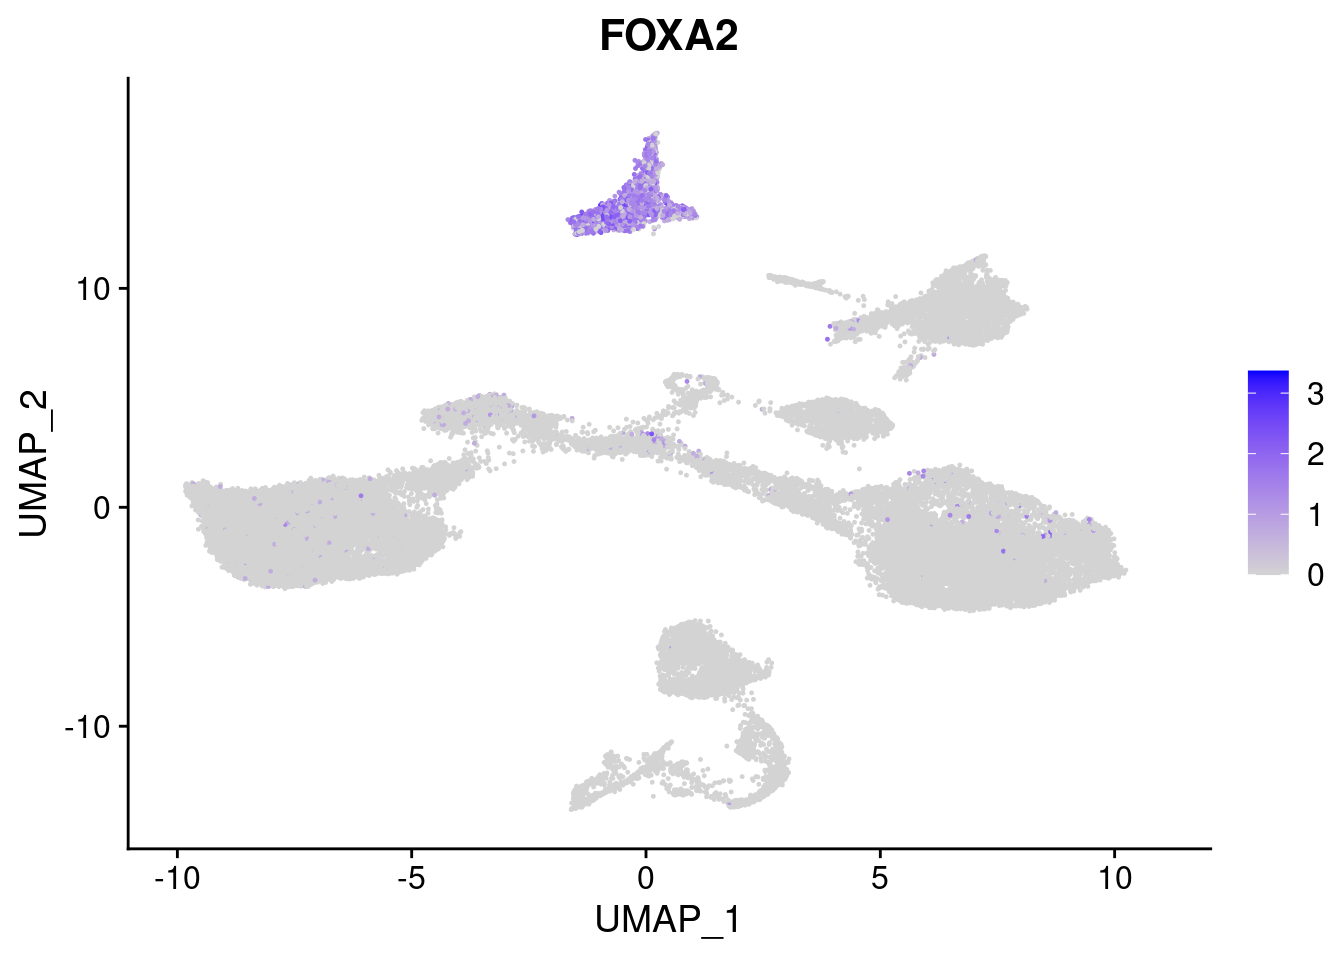
| Version | Author | Date |
|---|---|---|
| 421a225 | KLRhodes | 2020-08-10 |
[[4]]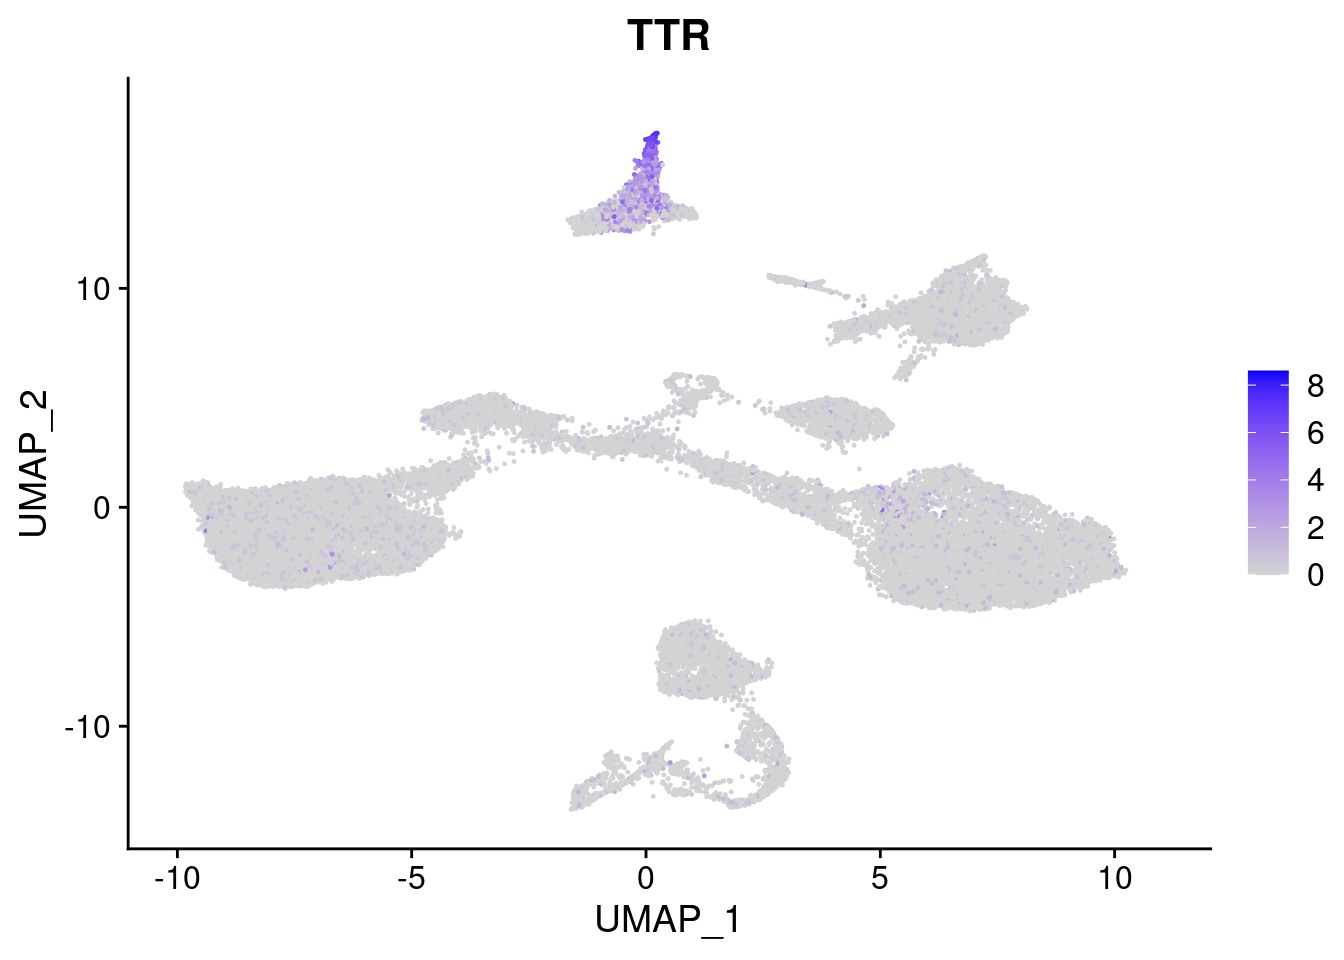
| Version | Author | Date |
|---|---|---|
| 421a225 | KLRhodes | 2020-08-10 |
[[5]]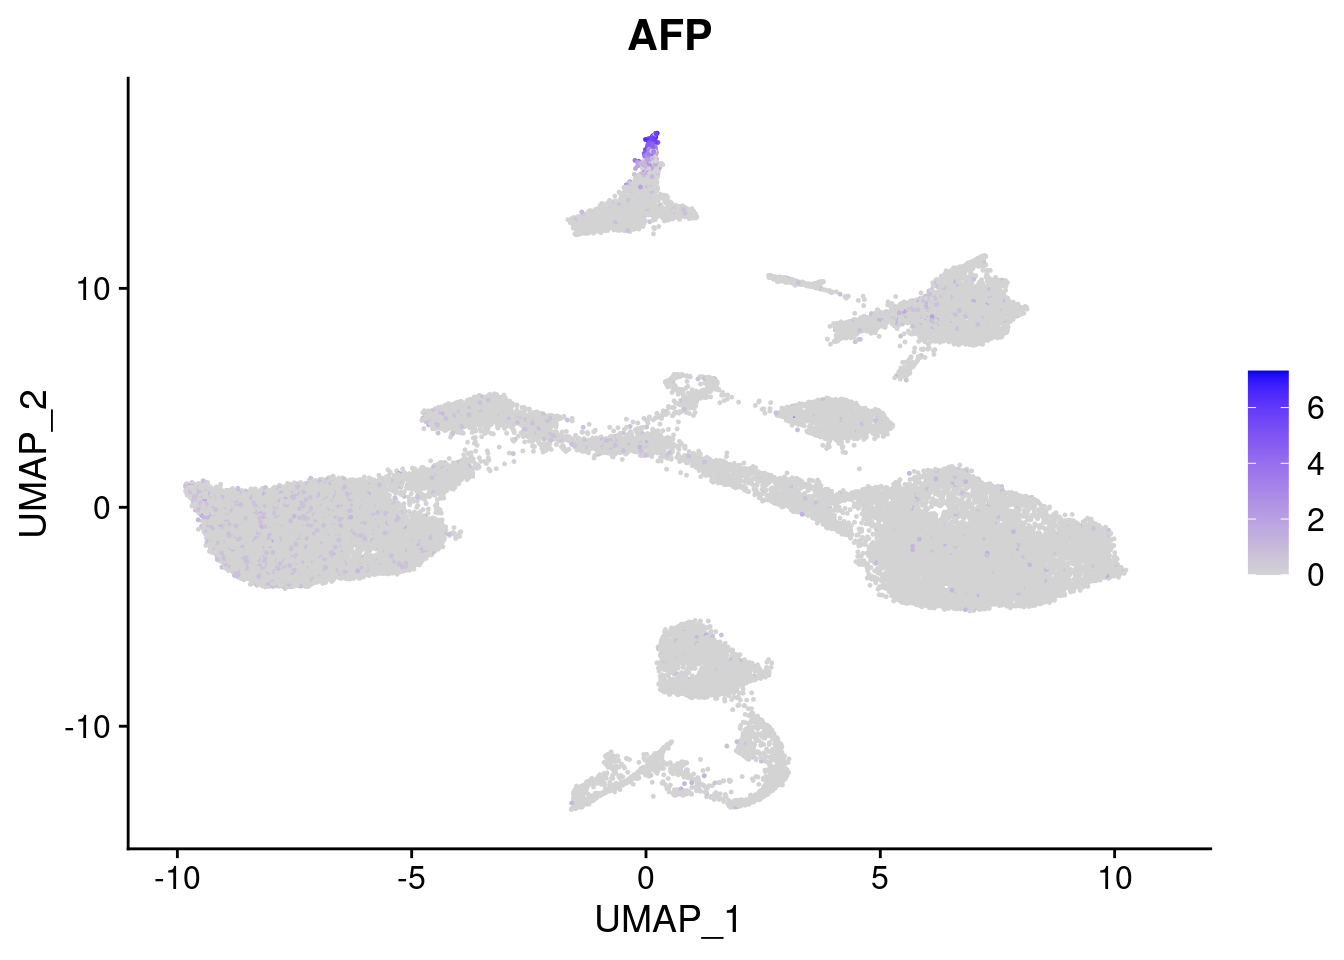
| Version | Author | Date |
|---|---|---|
| 421a225 | KLRhodes | 2020-08-10 |
[[6]]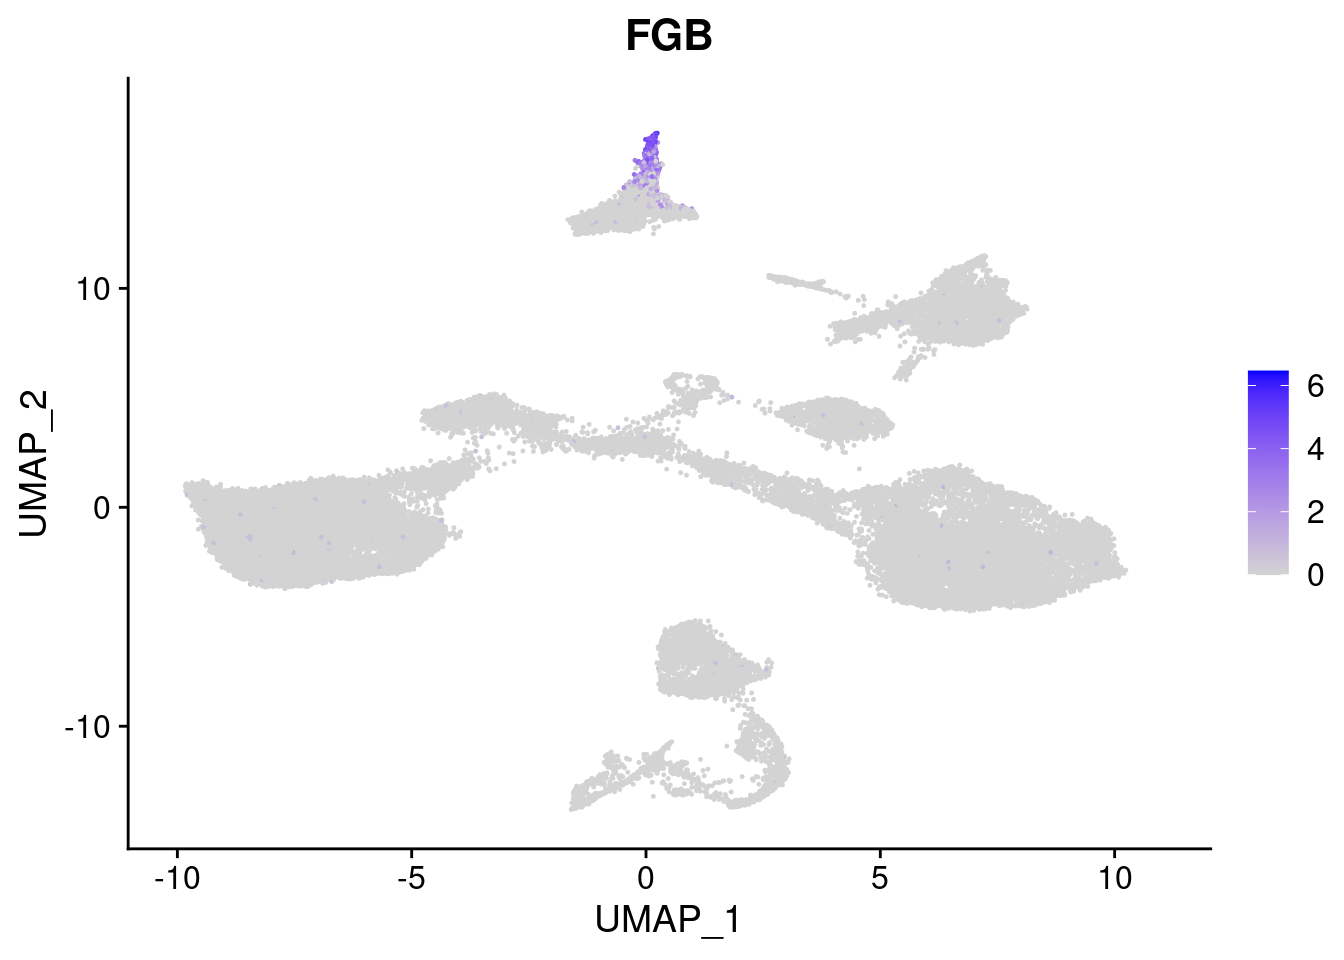
| Version | Author | Date |
|---|---|---|
| 421a225 | KLRhodes | 2020-08-10 |
#Mesoderm Markers (first 3 early meso markers, 4-6 heart markers, 7-9 endothelial markers (which comes from mesoderm), then some other general muscle markers)
FeaturePlot(merged, features = c("HAND1", "BMP4", "TNNT2","KDR", "GNG11", "ECSCR", "COL3A1", "ACTC1"), pt.size = 0.2, combine=F)
[[1]]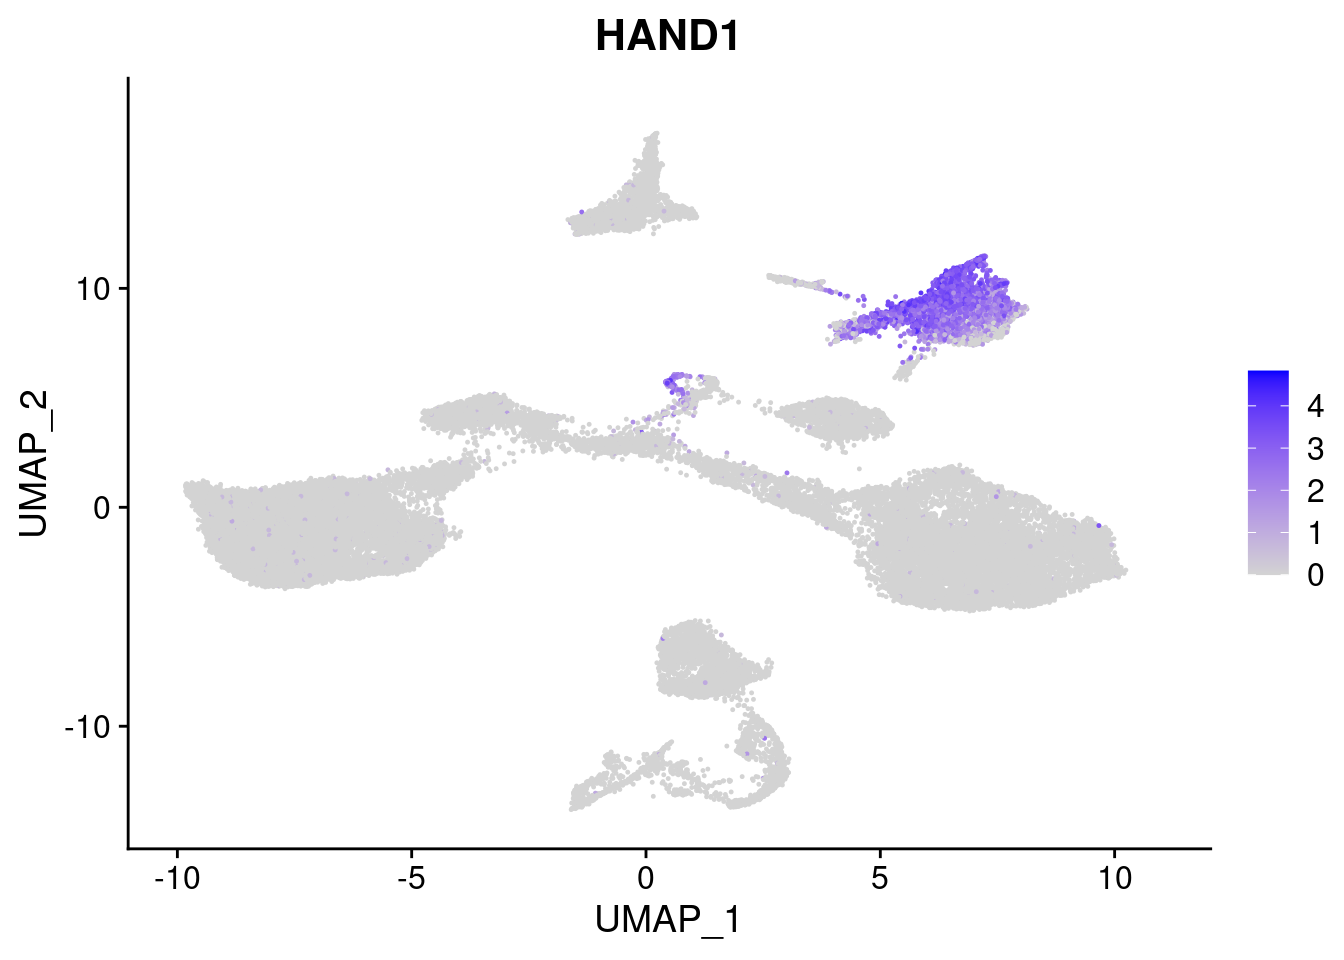
| Version | Author | Date |
|---|---|---|
| 421a225 | KLRhodes | 2020-08-10 |
[[2]]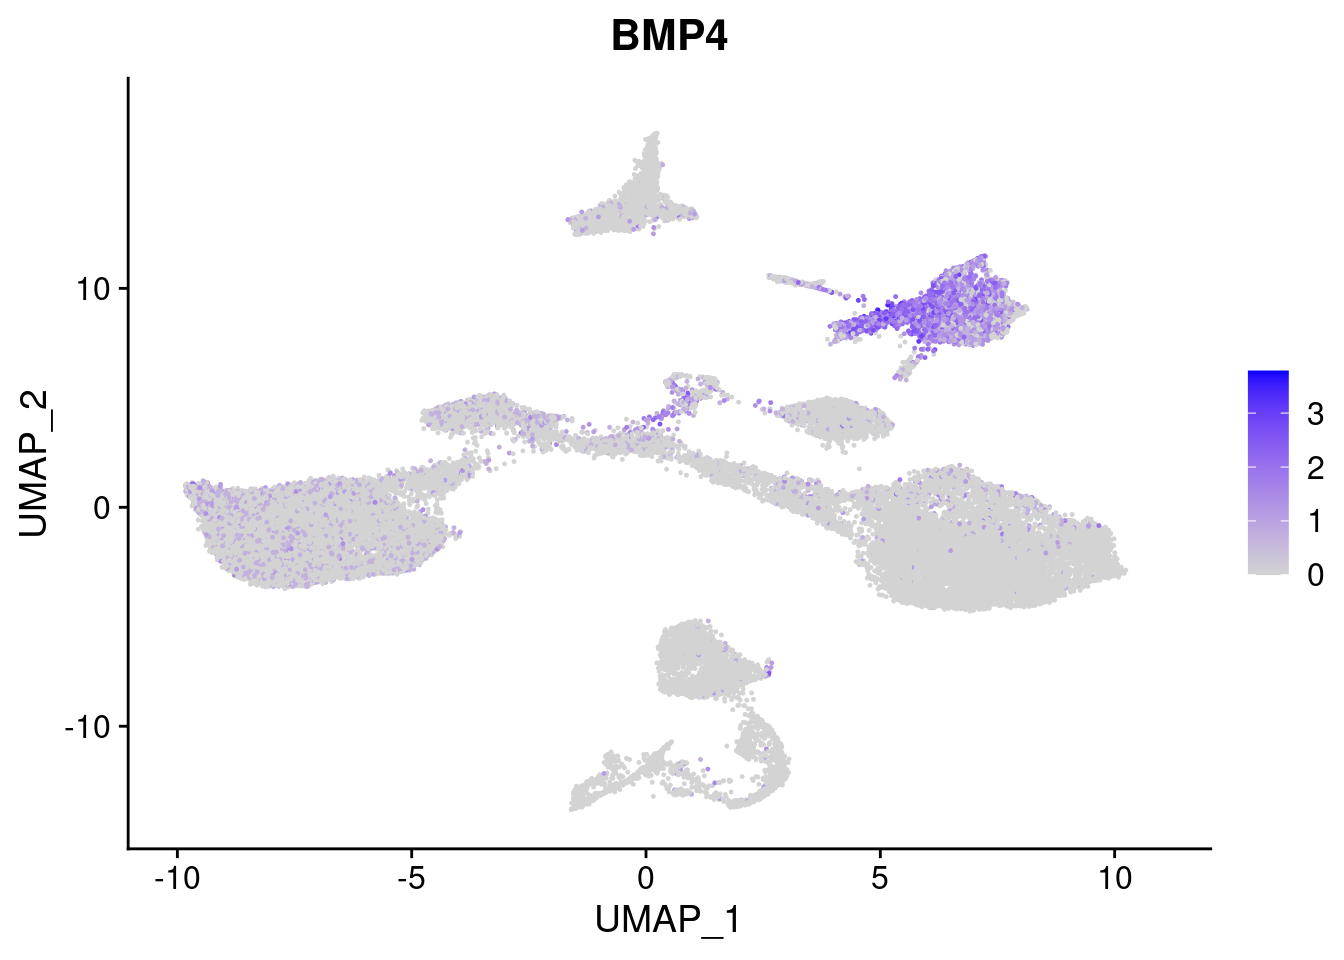
| Version | Author | Date |
|---|---|---|
| 421a225 | KLRhodes | 2020-08-10 |
[[3]]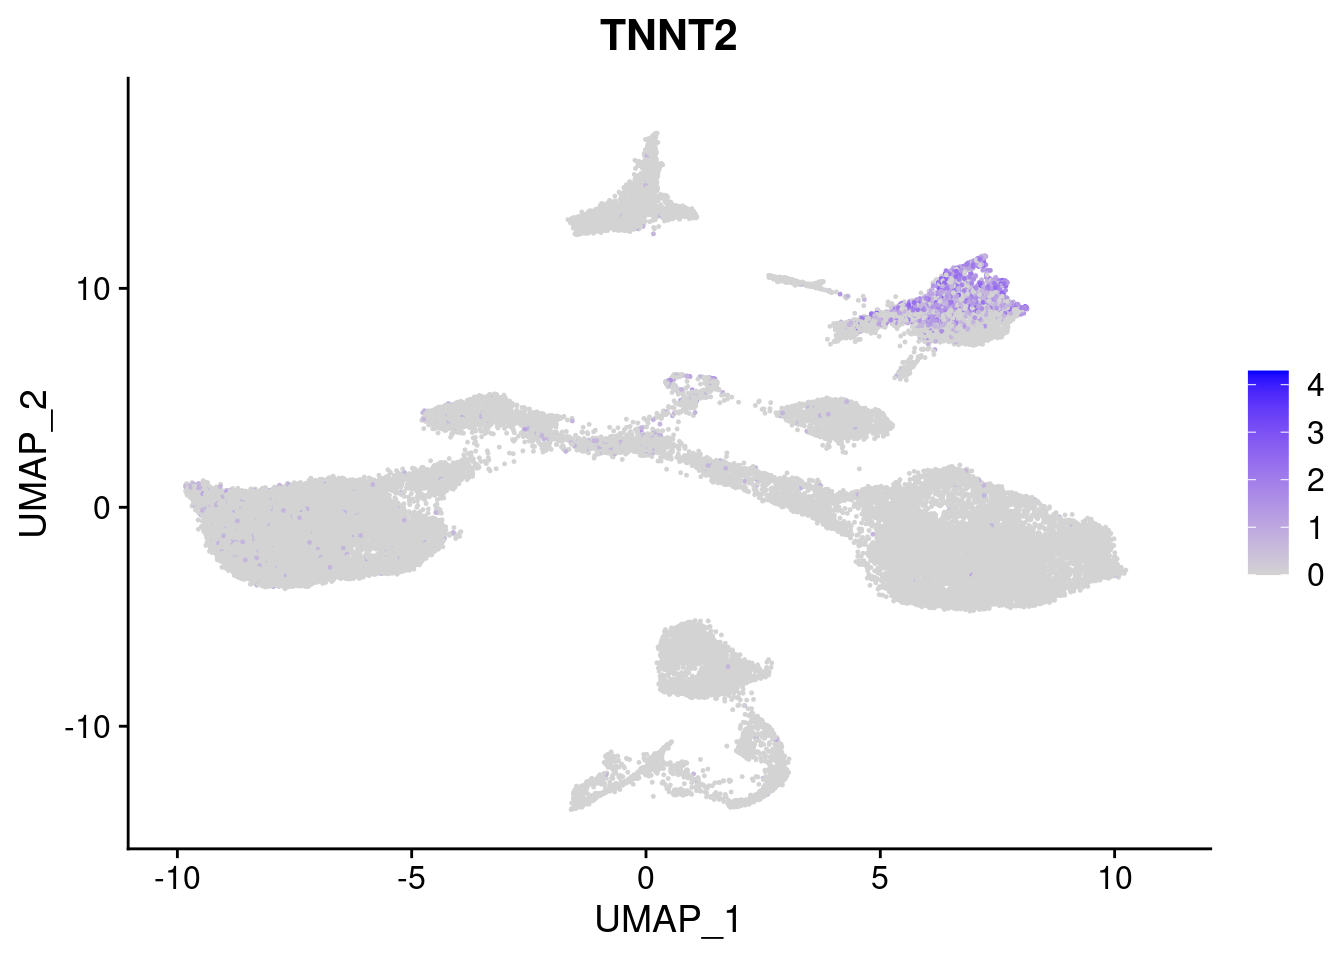
| Version | Author | Date |
|---|---|---|
| 421a225 | KLRhodes | 2020-08-10 |
[[4]]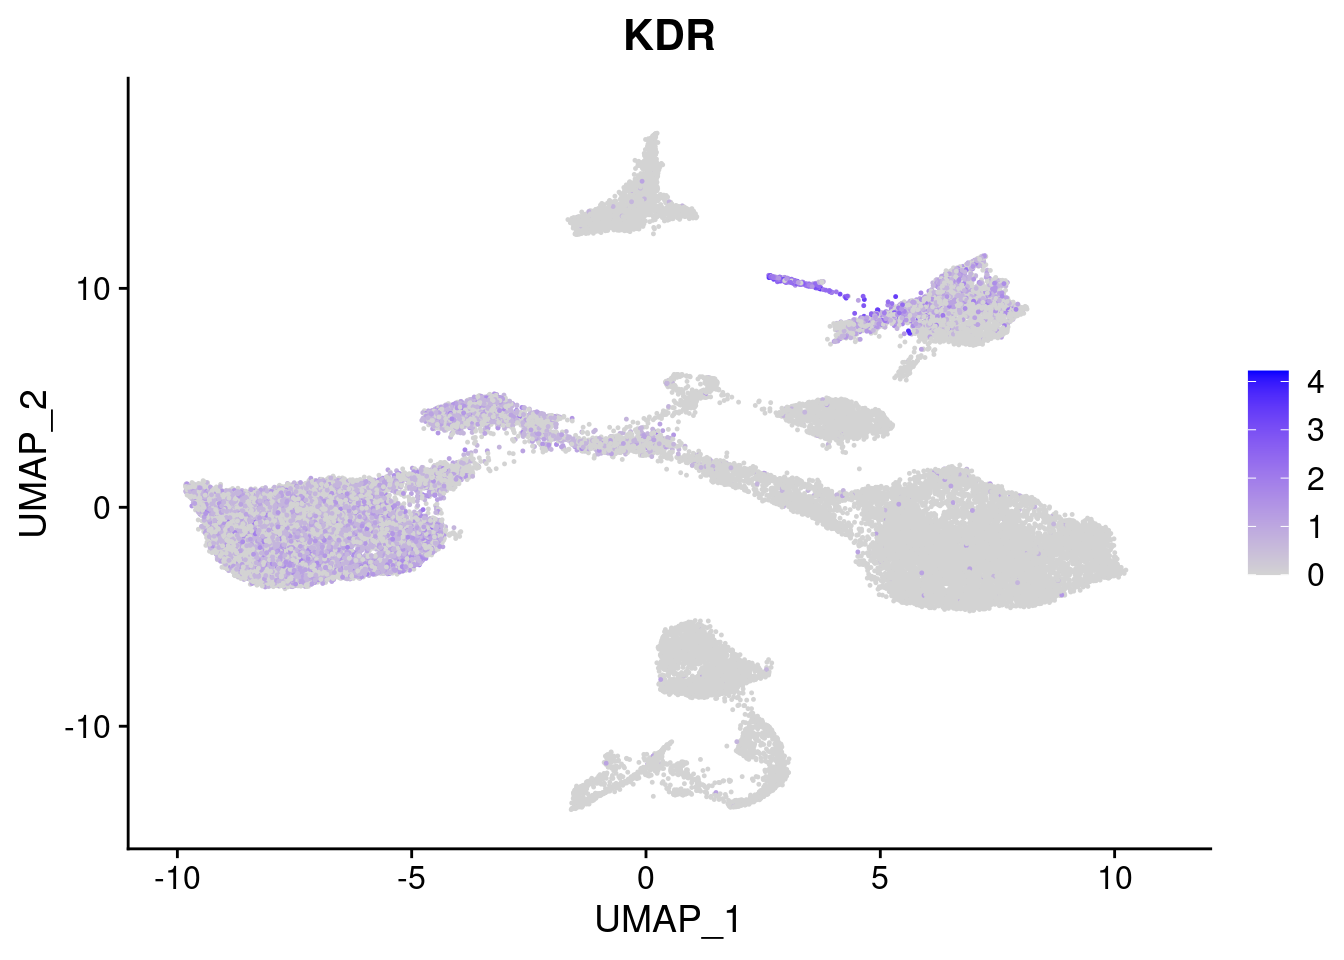
| Version | Author | Date |
|---|---|---|
| 421a225 | KLRhodes | 2020-08-10 |
[[5]]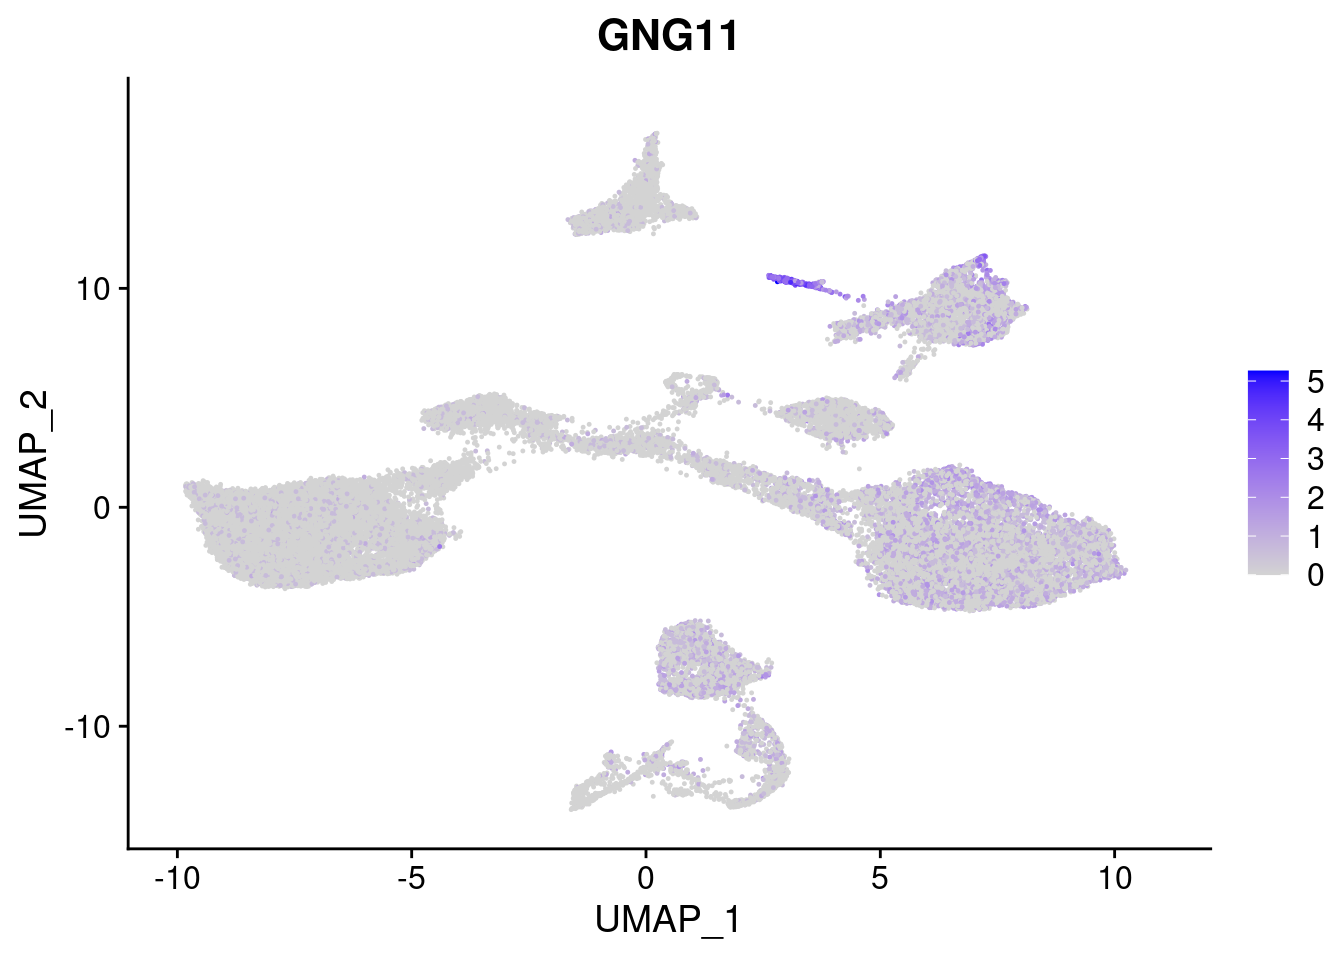
| Version | Author | Date |
|---|---|---|
| 421a225 | KLRhodes | 2020-08-10 |
[[6]]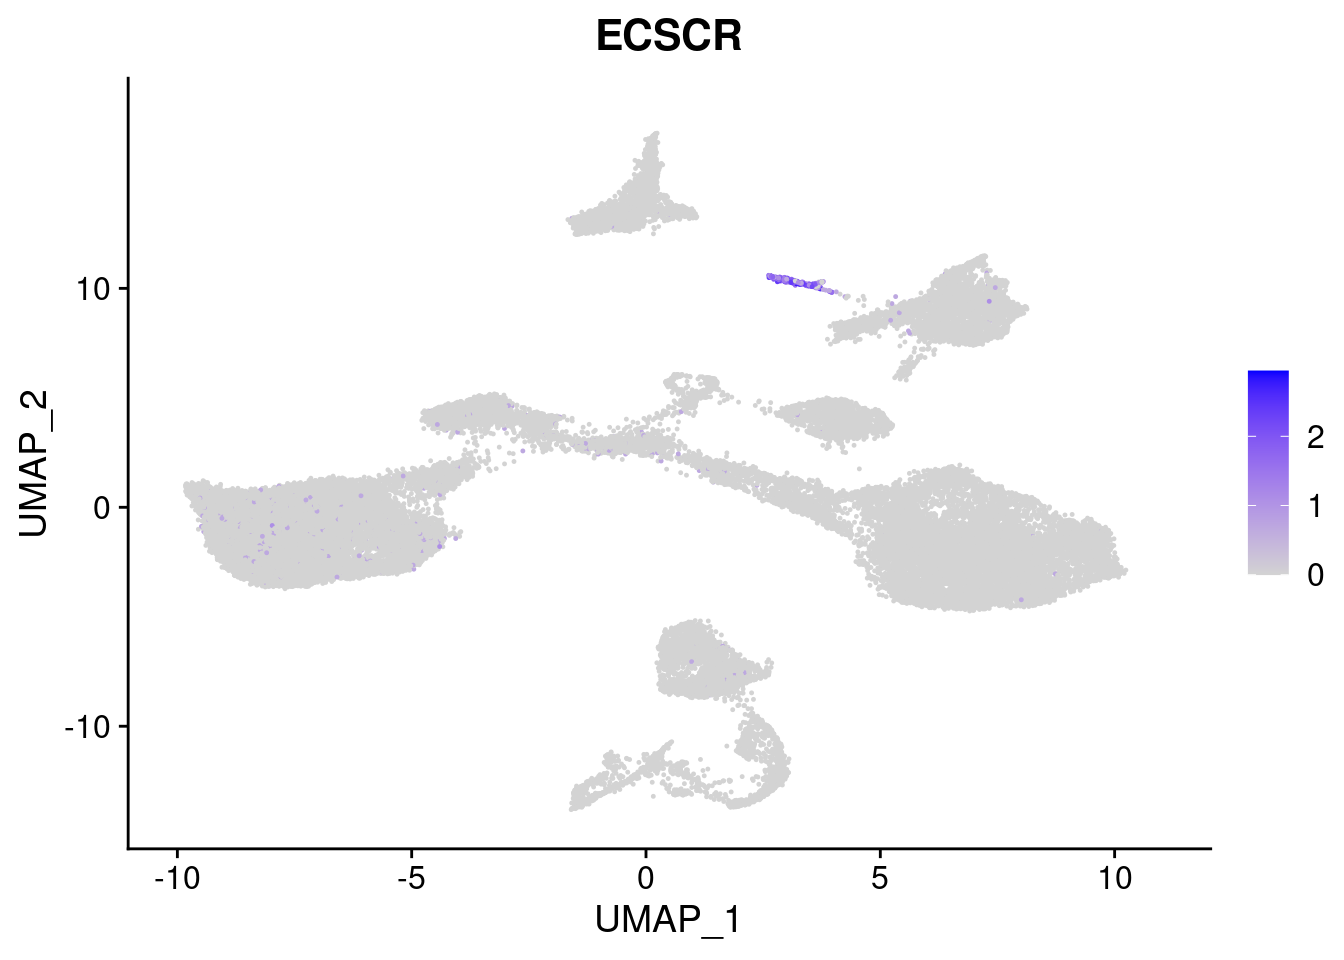
| Version | Author | Date |
|---|---|---|
| 421a225 | KLRhodes | 2020-08-10 |
[[7]]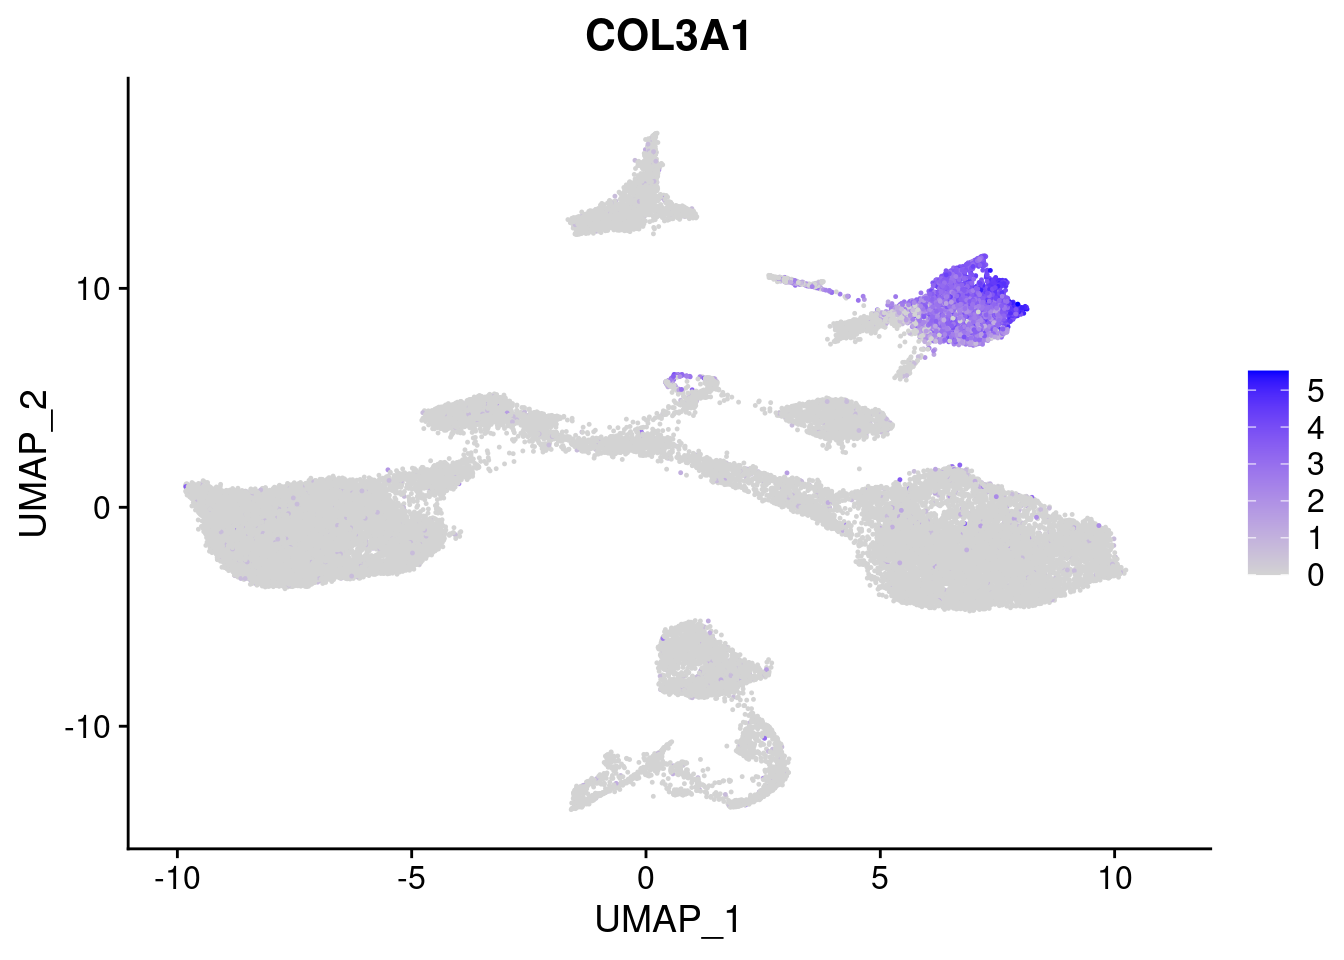
| Version | Author | Date |
|---|---|---|
| 421a225 | KLRhodes | 2020-08-10 |
[[8]]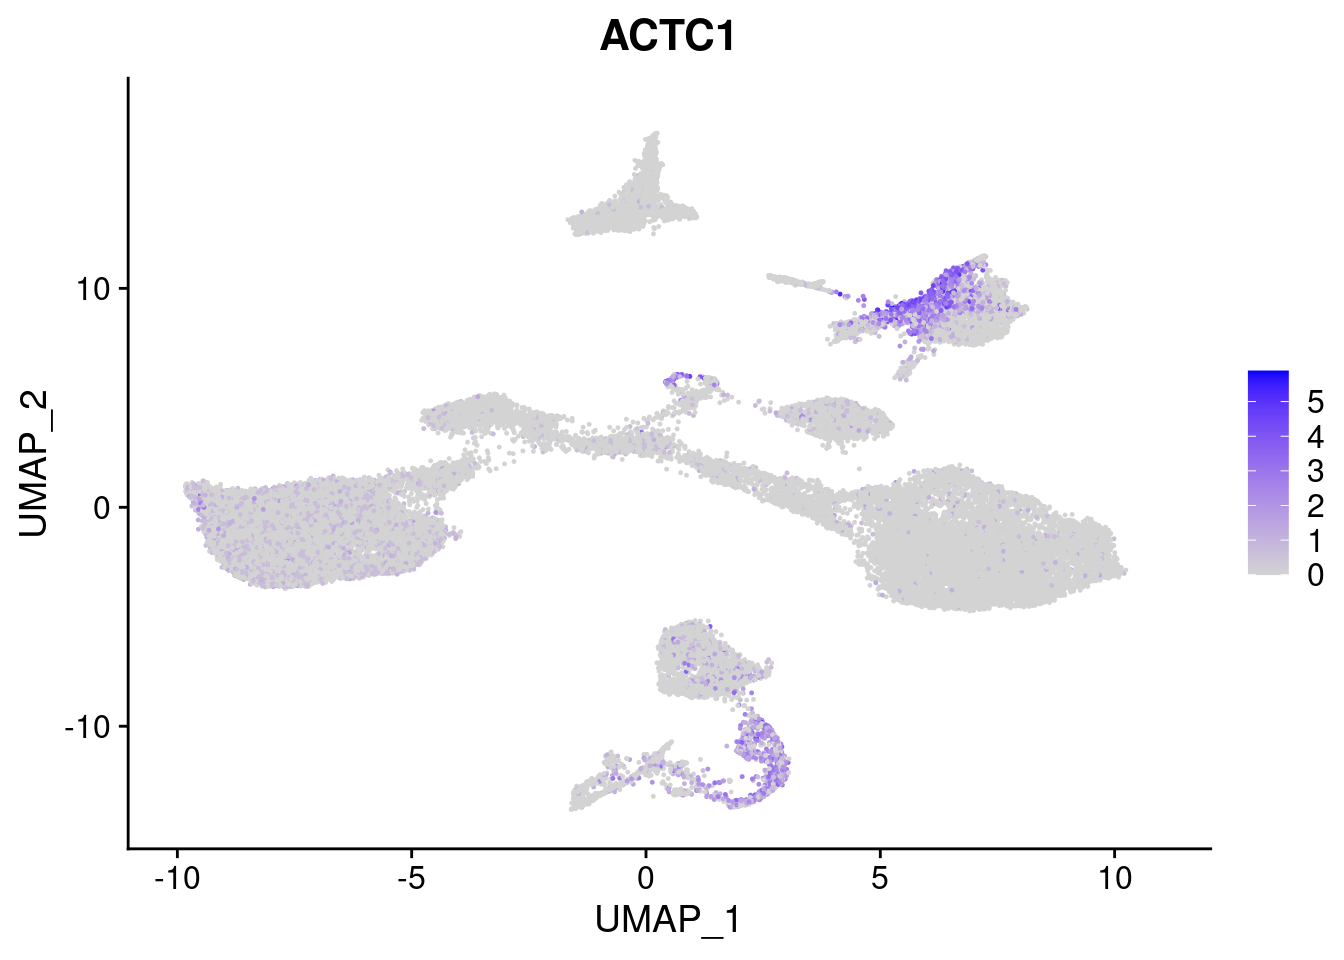
| Version | Author | Date |
|---|---|---|
| 421a225 | KLRhodes | 2020-08-10 |
#Ectoderm Markers (3-1 early ectoderm markers, 4-6schwann cell (myelinating, non myelinating, or precursor), 7-8 oligodendrocytes, 9-10 radial glia)
FeaturePlot(merged, features = c("PAX6", "GBX2",  "NES", "MPZ", "SOX10","GAP43", "OLIG1", "OLIG2", "VIM", "HES5"), pt.size = 0.2, ncol=3, combine=F)
[[1]]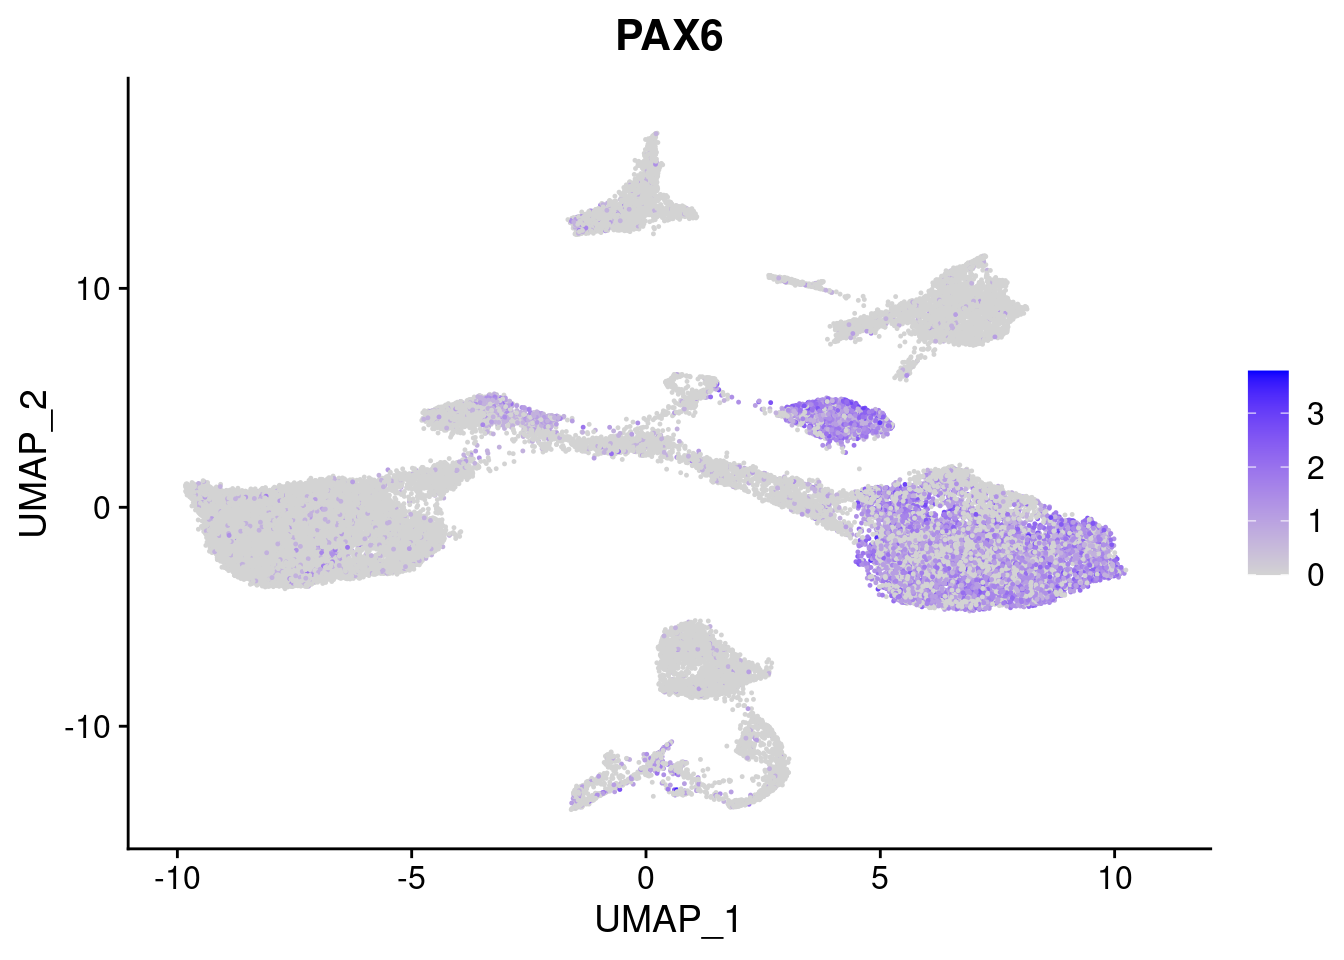
| Version | Author | Date |
|---|---|---|
| 421a225 | KLRhodes | 2020-08-10 |
[[2]]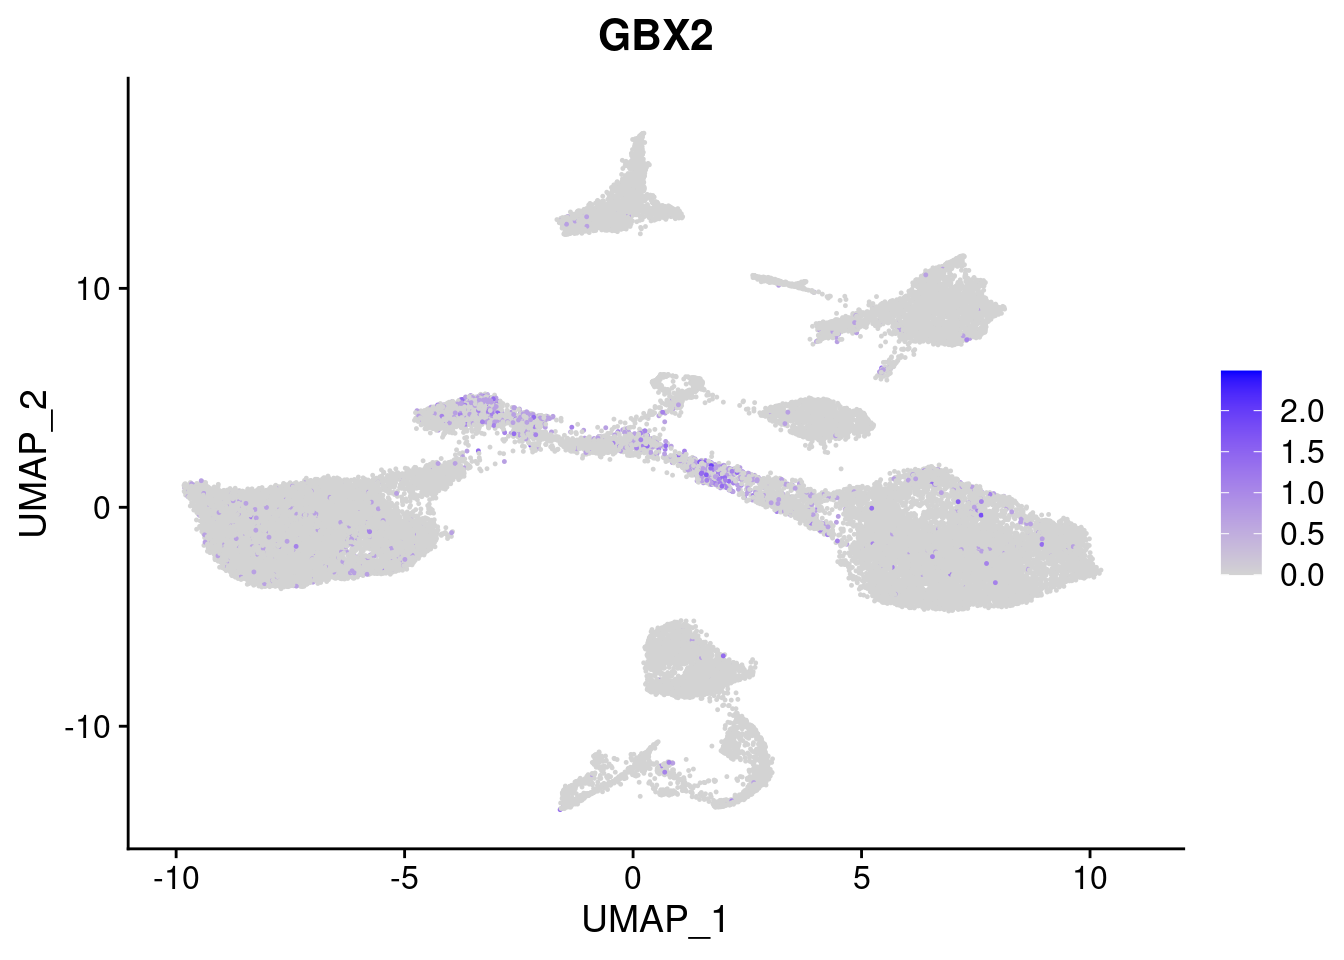
| Version | Author | Date |
|---|---|---|
| 421a225 | KLRhodes | 2020-08-10 |
[[3]]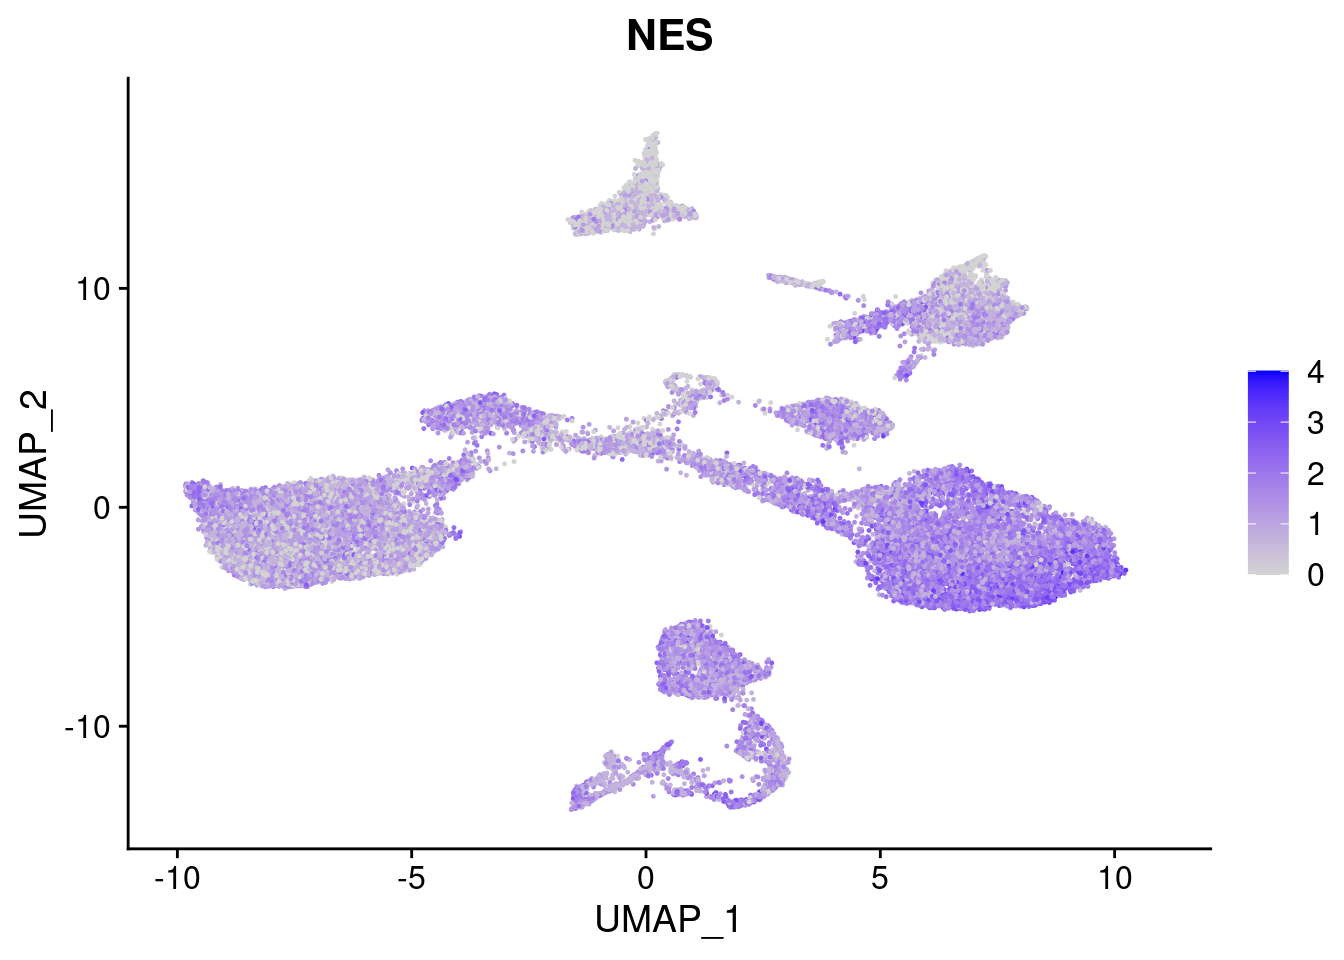
| Version | Author | Date |
|---|---|---|
| 421a225 | KLRhodes | 2020-08-10 |
[[4]]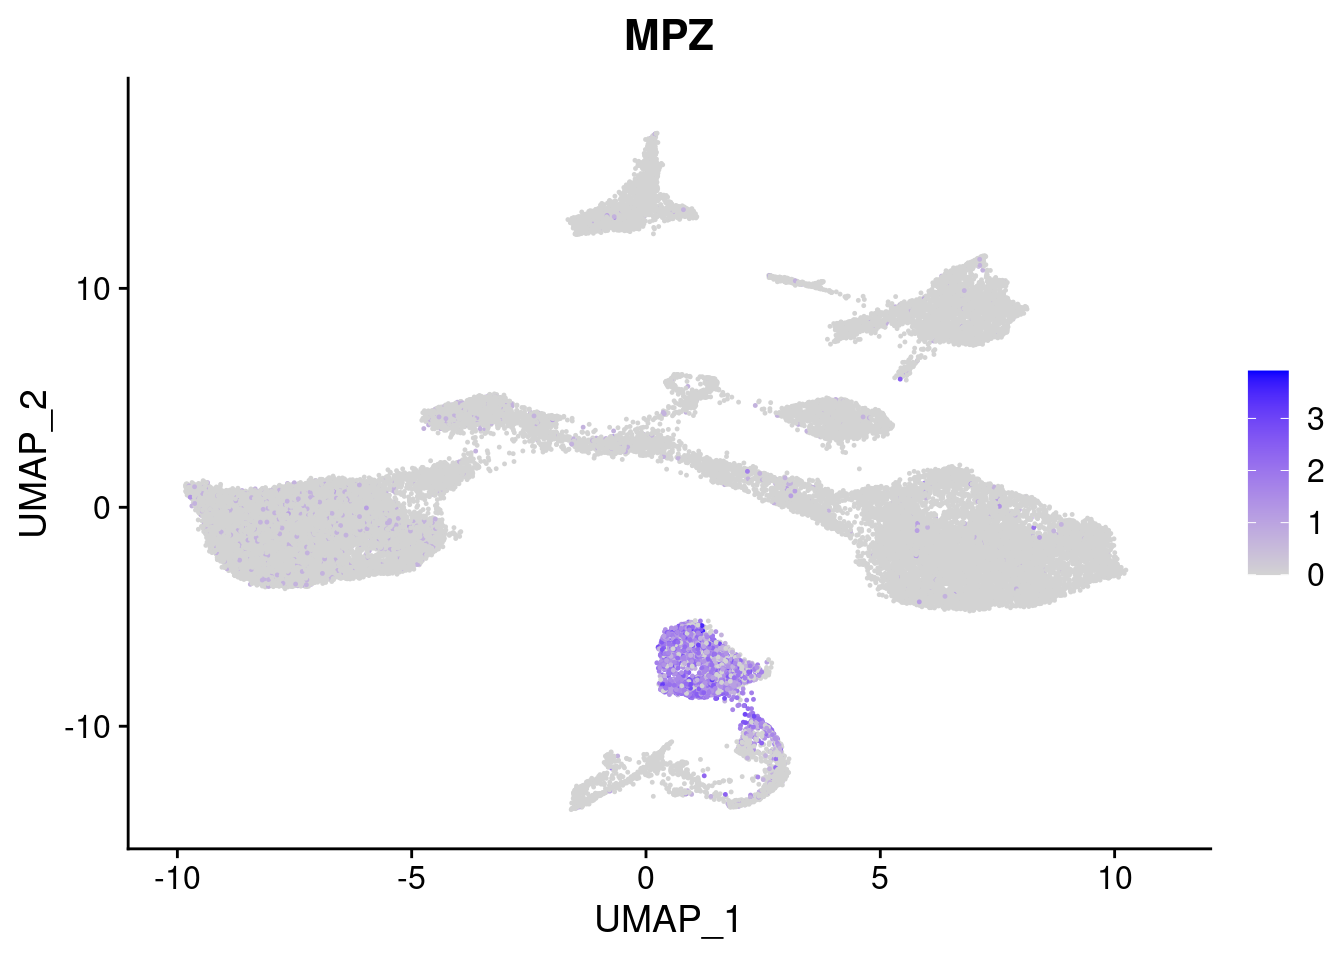
| Version | Author | Date |
|---|---|---|
| 421a225 | KLRhodes | 2020-08-10 |
[[5]]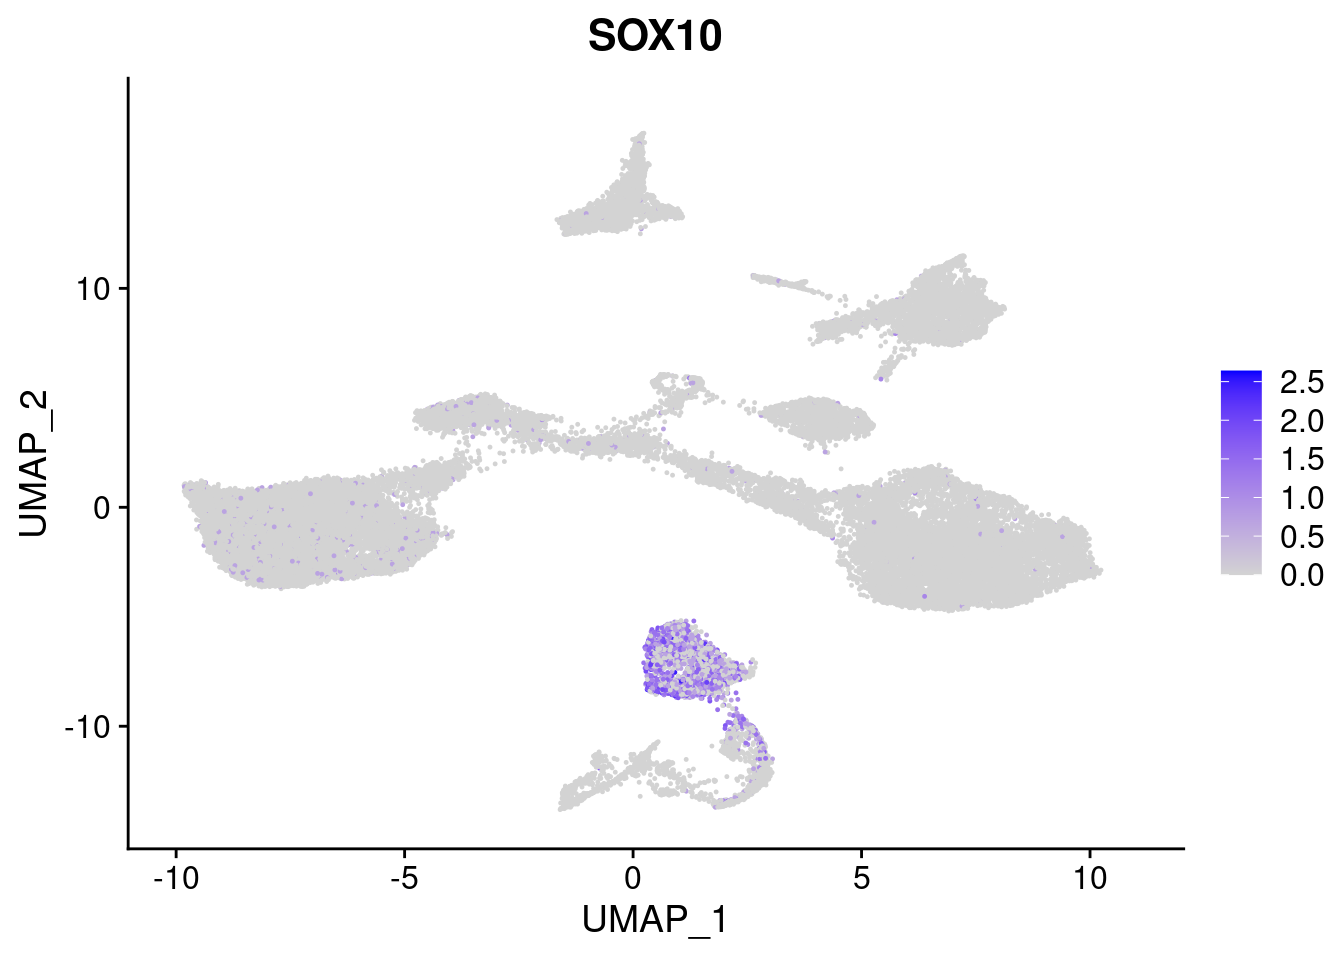
| Version | Author | Date |
|---|---|---|
| 421a225 | KLRhodes | 2020-08-10 |
[[6]]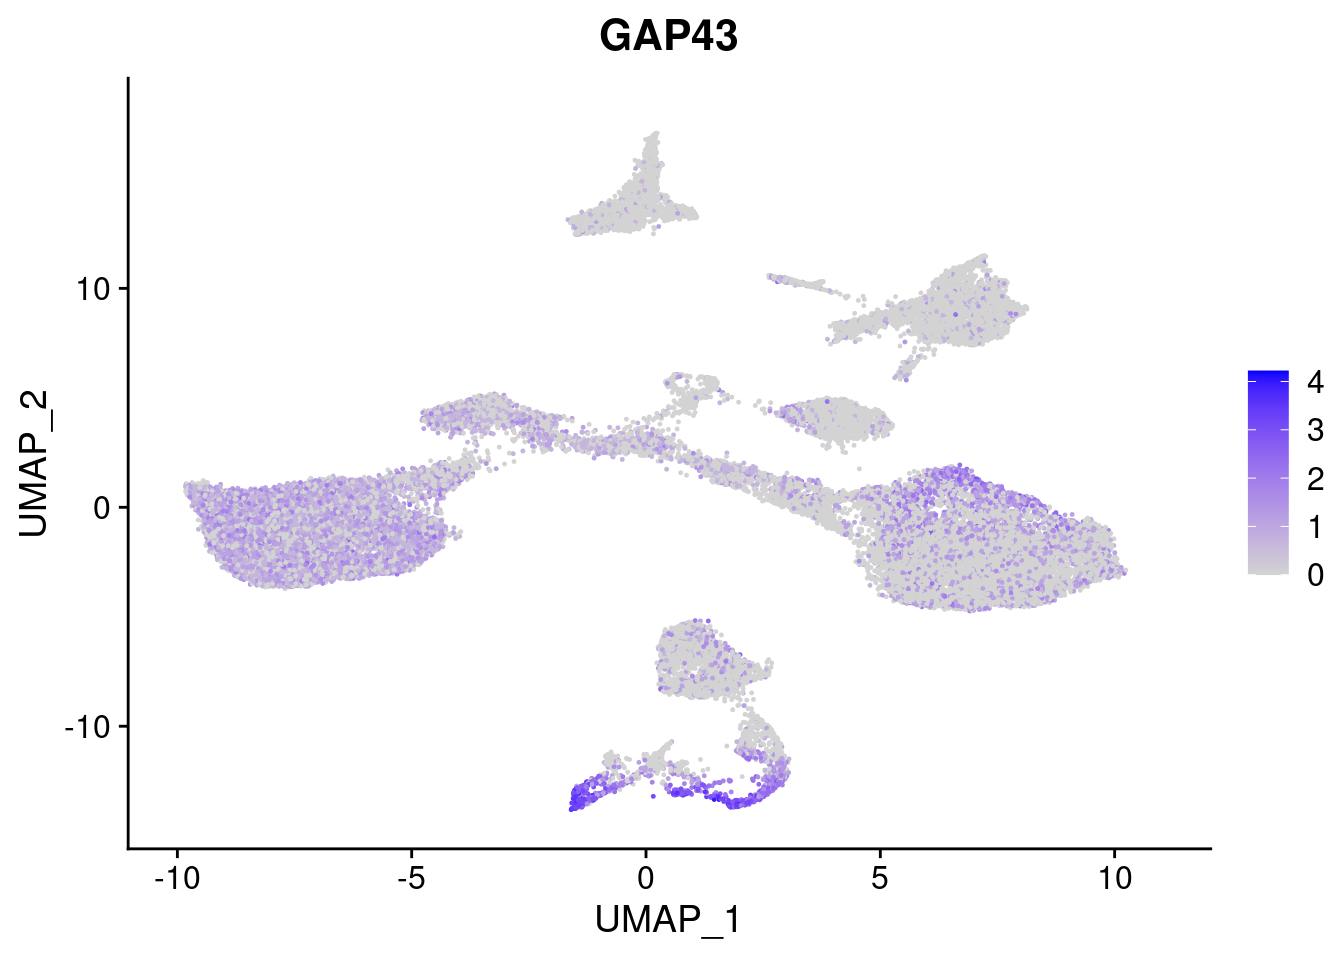
| Version | Author | Date |
|---|---|---|
| 421a225 | KLRhodes | 2020-08-10 |
[[7]]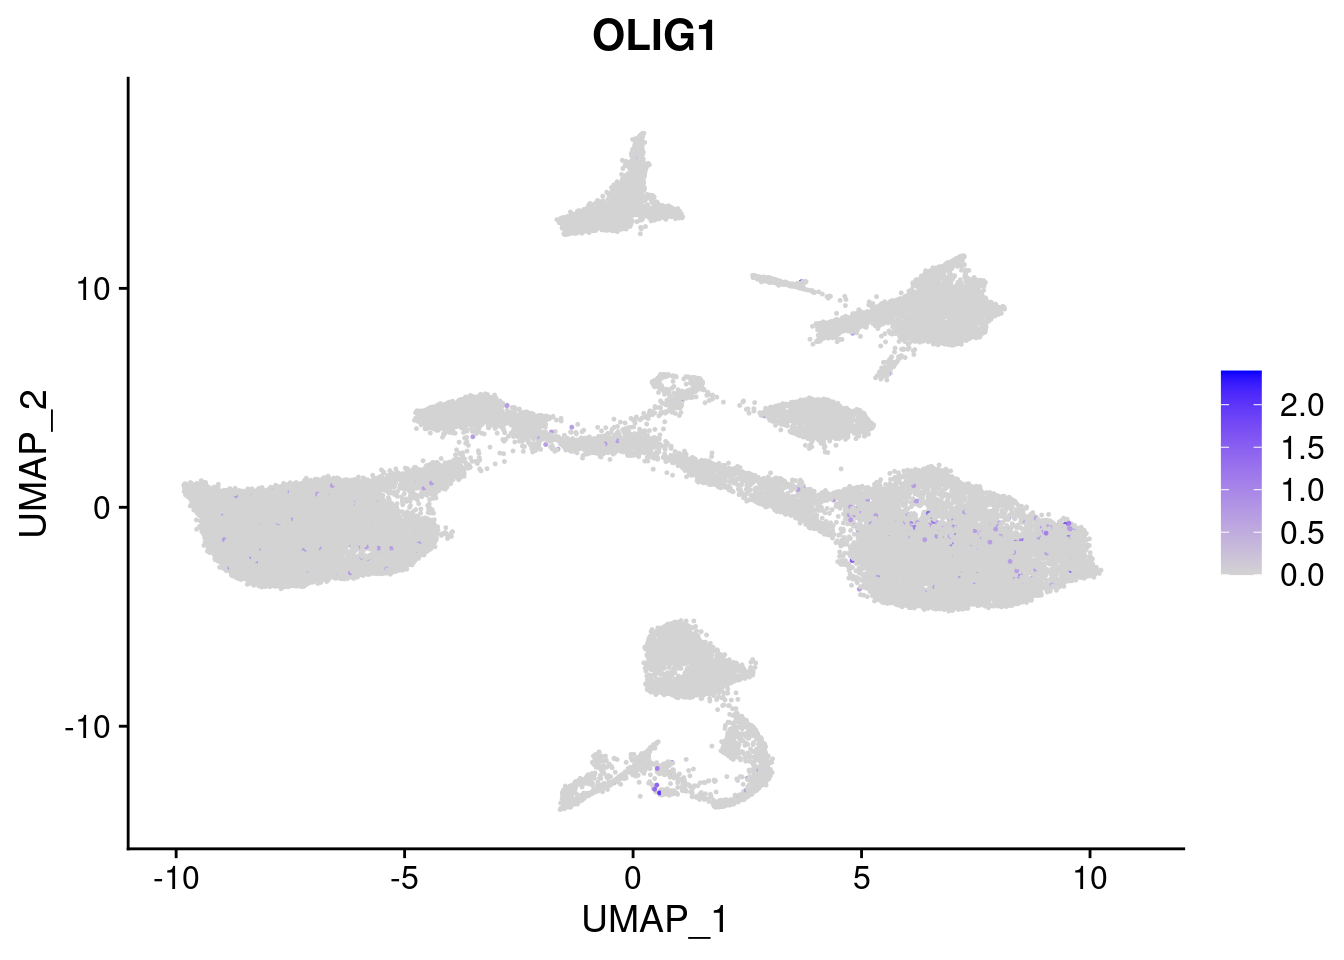
| Version | Author | Date |
|---|---|---|
| 421a225 | KLRhodes | 2020-08-10 |
[[8]]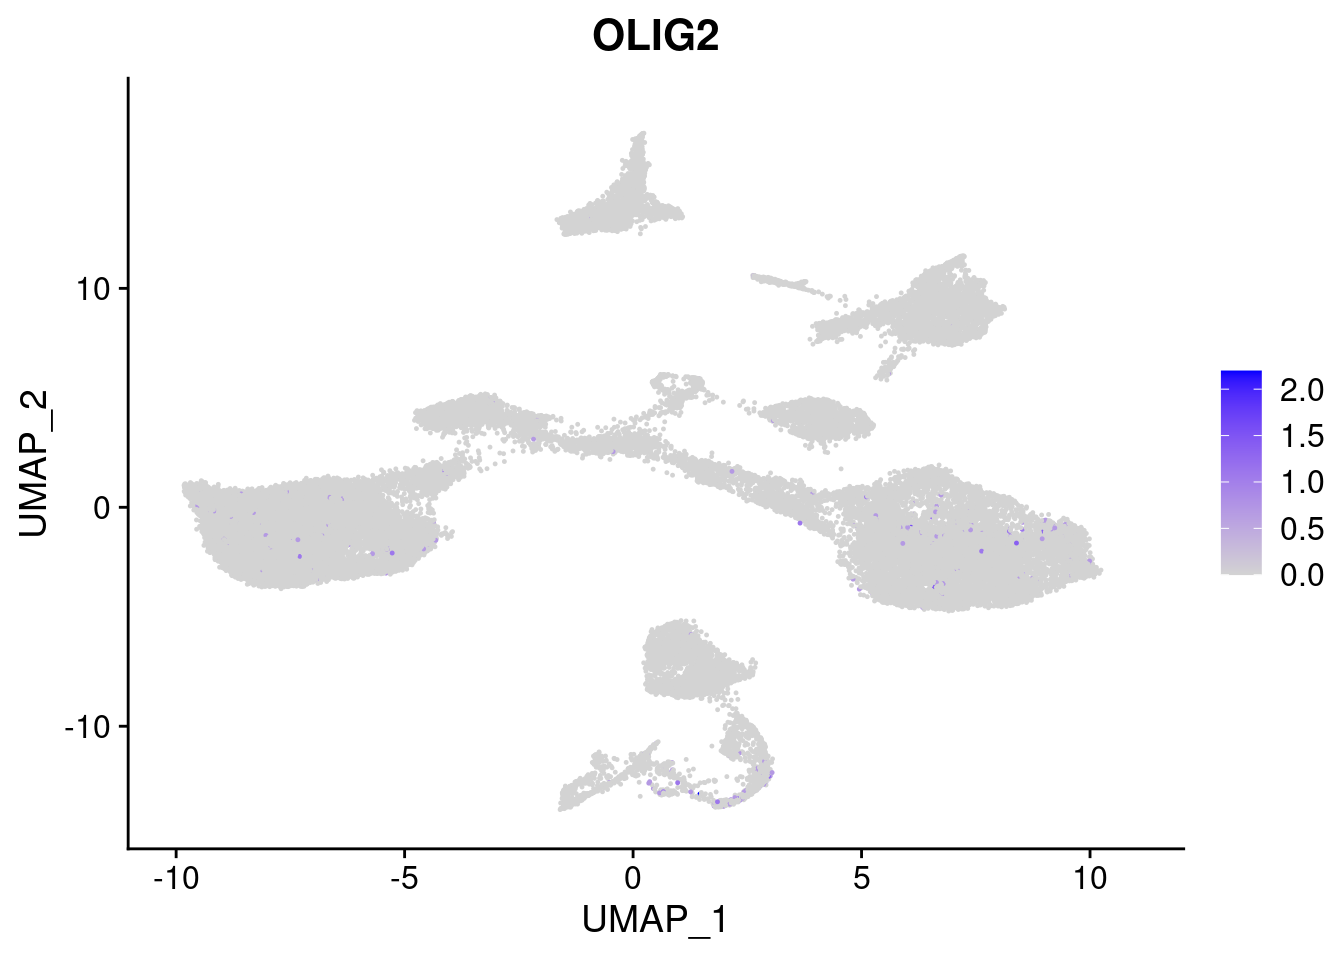
| Version | Author | Date |
|---|---|---|
| 421a225 | KLRhodes | 2020-08-10 |
[[9]]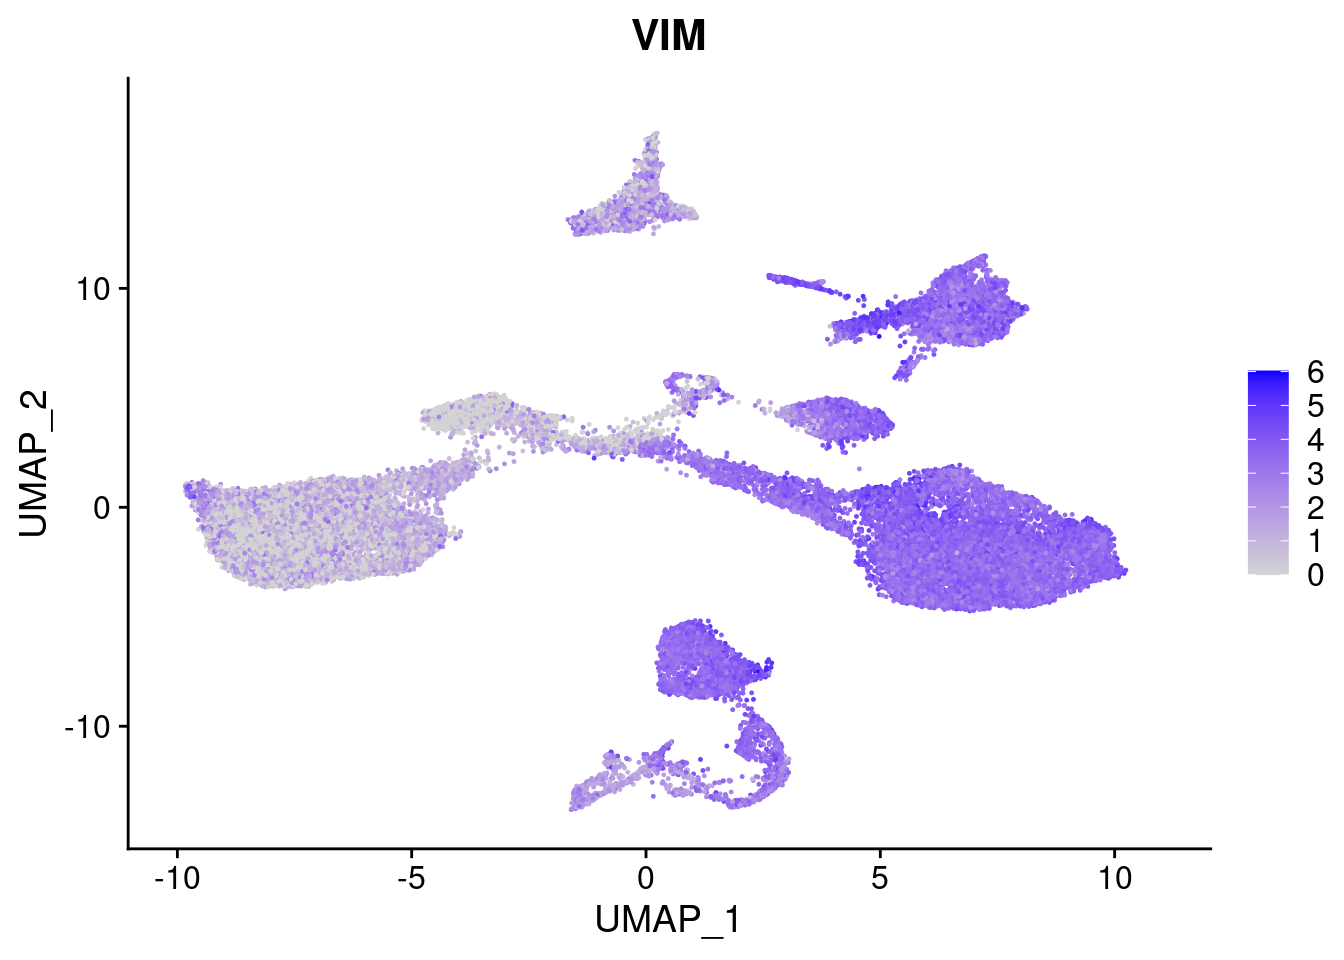
| Version | Author | Date |
|---|---|---|
| 421a225 | KLRhodes | 2020-08-10 |
[[10]]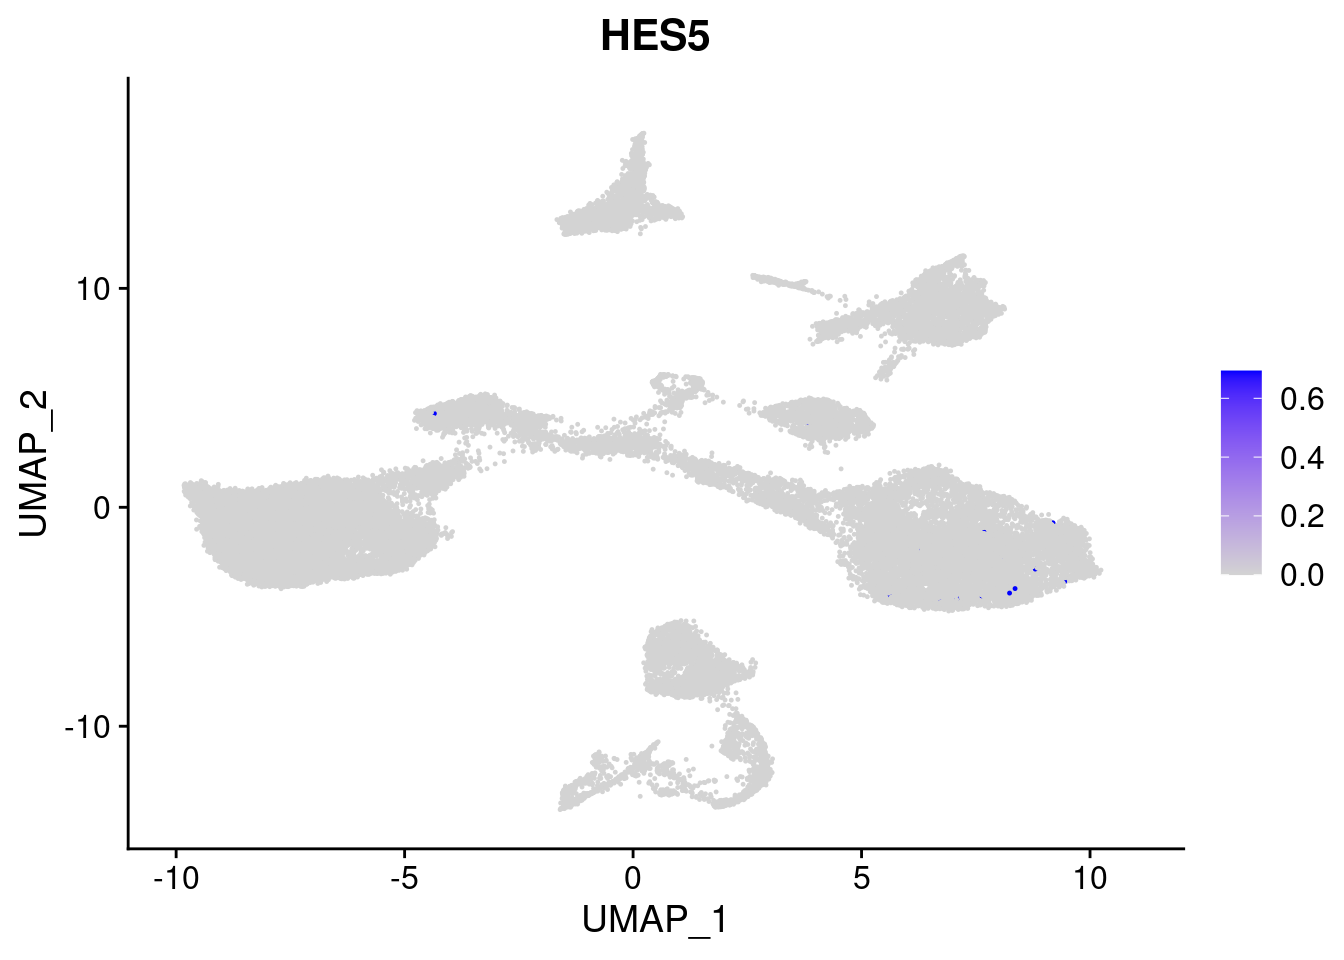
| Version | Author | Date |
|---|---|---|
| 421a225 | KLRhodes | 2020-08-10 |
#More ectoderm, specifically neurons
#immature neurons: NEUROD1
#Mature Neurons: MAP2, SYP
#dopaminergic: TH, FOXA2,
FeaturePlot(merged, features = c("MAP2", "SYP","NEUROD1", "TH" ), pt.size = 0.2, ncol=3)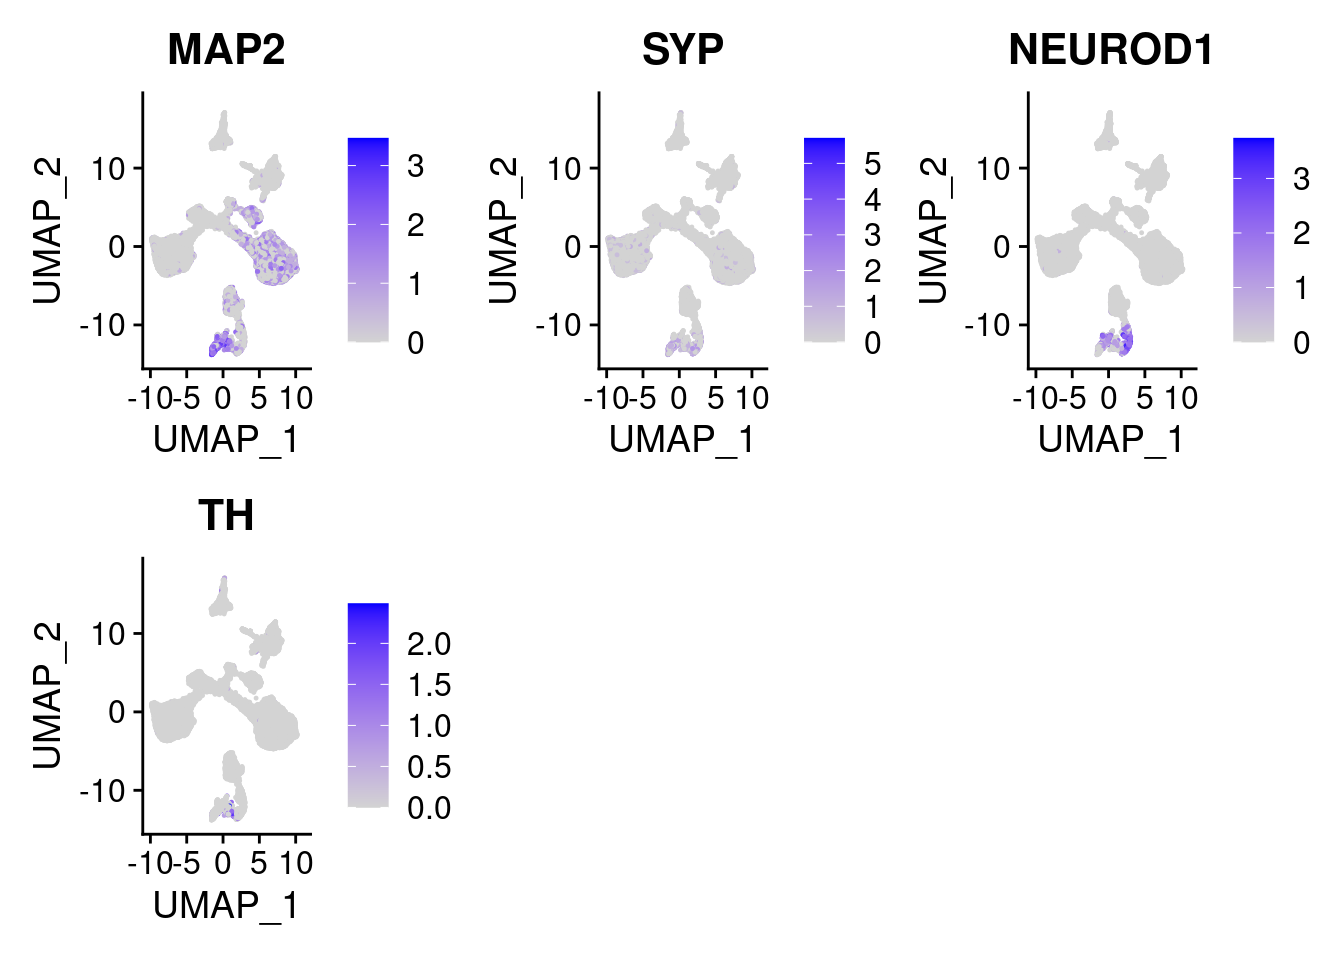
| Version | Author | Date |
|---|---|---|
| 421a225 | KLRhodes | 2020-08-10 |
Identify cluster markers
#how many cells per cluster?
t1<-table(merged@meta.data$SCT_snn_res.1, merged@meta.data$Batch)
t1
     Batch1 Batch2 Batch3
  0    2354   1403   1806
  1    1858   1022   1482
  2    1730   1219   1248
  3    1435    503   1131
  4    1435    517    652
  5     478    885    719
  6     827    329    707
  7      86    118   1377
  8     741    210    509
  9     313    227    857
  10    246    275    847
  11    496    646    224
  12    536    404    379
  13    130    266    887
  14    458    400    270
  15    586    185    298
  16    665    206    167
  17    356    129    550
  18    443    189    395
  19    281    225    250
  20     92    113    369
  21    212    185    166
  22    510      4      0
  23    259     74    109
  24    102     60    133
  25    100     39     83
  26     70     22    104
  27     74     10     31
#percent of cells in each cluster per batch
t1colsum<- colSums(t1)
percT1<-t1/t1colsum
percT1
           Batch1       Batch2       Batch3
  0  0.1395128312 0.1422199696 0.1146666667
  1  0.1883426254 0.0648888889 0.0878326320
  2  0.1098412698 0.0722455995 0.1265078561
  3  0.0850471167 0.0509883426 0.0718095238
  4  0.1454637608 0.0328253968 0.0386416168
  5  0.0303492063 0.0524506608 0.0728839331
  6  0.0490132164 0.0333502281 0.0448888889
  7  0.0087176888 0.0074920635 0.0816096723
  8  0.0470476190 0.0124459195 0.0515965535
  9  0.0185503467 0.0230106437 0.0544126984
  10 0.0249366447 0.0174603175 0.0501985420
  11 0.0314920635 0.0382860191 0.0227065383
  12 0.0317667279 0.0409528637 0.0240634921
  13 0.0131779017 0.0168888889 0.0525691934
  14 0.0290793651 0.0237065134 0.0273694881
  15 0.0347300421 0.0187531678 0.0189206349
  16 0.0674100355 0.0130793651 0.0098974693
  17 0.0226031746 0.0076453506 0.0557526609
  18 0.0262549636 0.0191586417 0.0250793651
  19 0.0284845413 0.0142857143 0.0148165709
  20 0.0058412698 0.0066970900 0.0374049671
  21 0.0125644521 0.0187531678 0.0105396825
  22 0.0516979219 0.0002539683 0.0000000000
  23 0.0164444444 0.0043857050 0.0110491637
  24 0.0060451609 0.0060821085 0.0084444444
  25 0.0101368474 0.0024761905 0.0049191015
  26 0.0044444444 0.0013038582 0.0105423213
  27 0.0043857050 0.0010136847 0.0019682540
heatmap(t(percT1))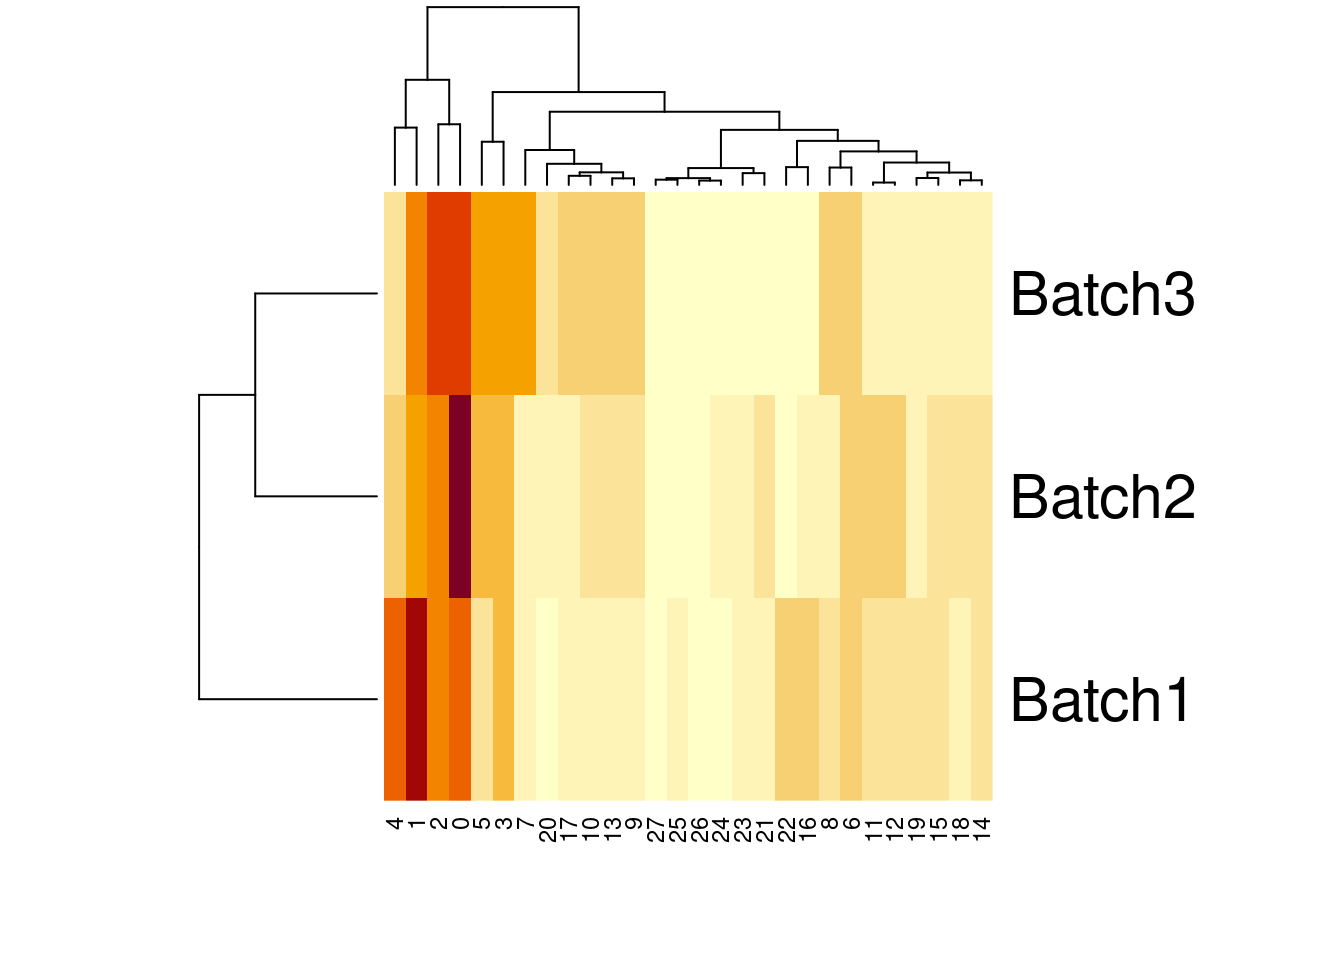
| Version | Author | Date |
|---|---|---|
| 421a225 | KLRhodes | 2020-08-10 |
#how many cells per cluster from each individual?
t2<-table(merged@meta.data$SCT_snn_res.1, merged@meta.data$individual)
t2
     SNG-NA18511 SNG-NA18858 SNG-NA19160
  0            4        5556           3
  1            4        4358           0
  2         4118          29          50
  3          946          18        2105
  4          438         112        2054
  5           12        2061           9
  6           21        1839           3
  7         1543          12          26
  8          135           2        1323
  9          740           4         653
  10         549           2         817
  11         138        1208          20
  12         920          21         378
  13         154           4        1125
  14          82        1004          42
  15          76           2         991
  16         107          17         914
  17          57           5         973
  18         138           0         889
  19         653           8          95
  20         138           0         436
  21         408           8         147
  22         331          10         173
  23          87         169         186
  24          89           2         204
  25           7         213           2
  26          39           6         151
  27          15           0         100
t2colsums<-colSums(t2)
percT2<- t2/t2colsums
percT2
      SNG-NA18511  SNG-NA18858  SNG-NA19160
  0  0.0003347560 0.3332933413 0.0002163098
  1  0.0002399520 0.3142259716 0.0000000000
  2  0.2969211911 0.0024269813 0.0029994001
  3  0.0791698050 0.0010797840 0.1517773452
  4  0.0262747451 0.0080755642 0.1718972299
  5  0.0008652390 0.1724830530 0.0005398920
  6  0.0017574692 0.1103179364 0.0002163098
  7  0.0925614877 0.0008652390 0.0021759143
  8  0.0097339390 0.0001673780 0.0793641272
  9  0.0619298686 0.0002399520 0.0470834235
  10 0.0329334133 0.0001442065 0.0683739225
  11 0.0099502488 0.1010963261 0.0011997600
  12 0.0769938907 0.0012597481 0.0272550292
  13 0.0092381524 0.0002884130 0.0941501381
  14 0.0059124667 0.0840237677 0.0025194961
  15 0.0063603649 0.0001199760 0.0714543226
  16 0.0064187163 0.0012257553 0.0764917566
  17 0.0041098854 0.0004184451 0.0583683263
  18 0.0115490836 0.0000000000 0.0640997909
  19 0.0391721656 0.0005768260 0.0079504561
  20 0.0099502488 0.0000000000 0.0261547690
  21 0.0341451167 0.0004799040 0.0105991780
  22 0.0198560288 0.0007210325 0.0144781990
  23 0.0062729829 0.0141434430 0.0111577684
  24 0.0074483220 0.0001199760 0.0147090634
  25 0.0004199160 0.0153579926 0.0001673780
  26 0.0028120268 0.0005021341 0.0090581884
  27 0.0012553352 0.0000000000 0.0072103252
heatmap(t(percT2))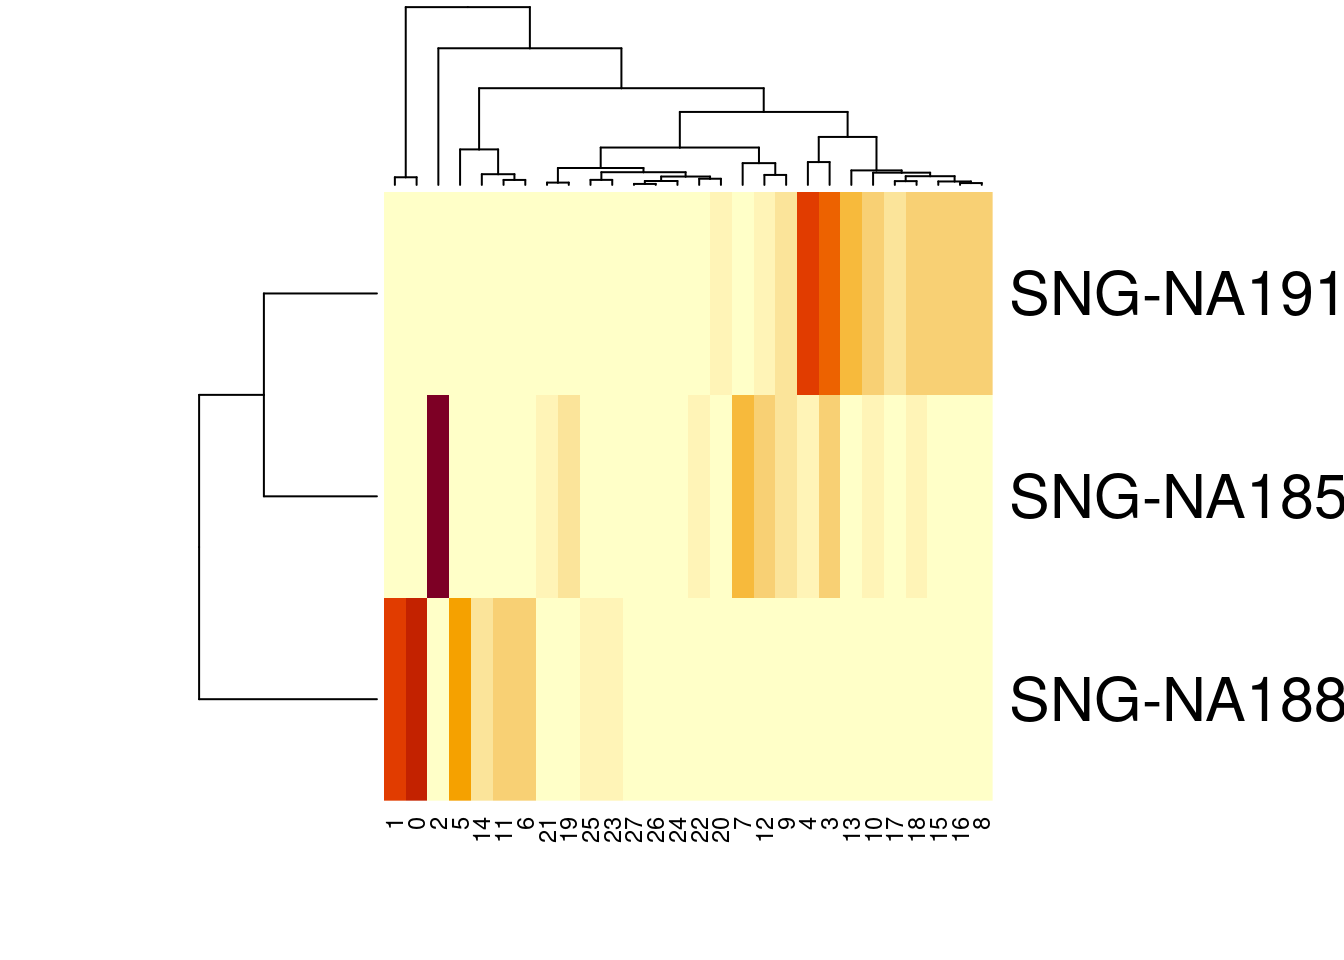
| Version | Author | Date |
|---|---|---|
| 421a225 | KLRhodes | 2020-08-10 |
cormat<-round(cor(percT2),2)
library(reshape2)
melted_cormat<-melt(cormat)
ugly<-ggplot(data= melted_cormat, aes(x=Var1, y=Var2, fill=value)) +
  geom_tile() +
  ggtitle("Pairwise Pearson Correlation of the percent of cells from \neach cell line assigned to each Seurat Cluster")

get_lower_tri<- function(cormat){
  cormat[upper.tri(cormat)]<-NA
  return(cormat)
}

lower_tri<- get_lower_tri(cormat)
melted_tri<- melt(lower_tri)
pretty<-ggplot(data= melted_tri, aes(x=Var1, y=Var2, fill=value)) +
  geom_tile(color="white") +
  scale_fill_gradient2(low="blue", high="red", mid="white", midpoint = 0, limit= c(-1,1), space= "Lab", name="Pearson\nCorrelation") +
  theme_minimal() +
  ggtitle("Pairwise Pearson Correlation of the percent of cells from \neach cell line assigned to each Seurat Cluster")

pretty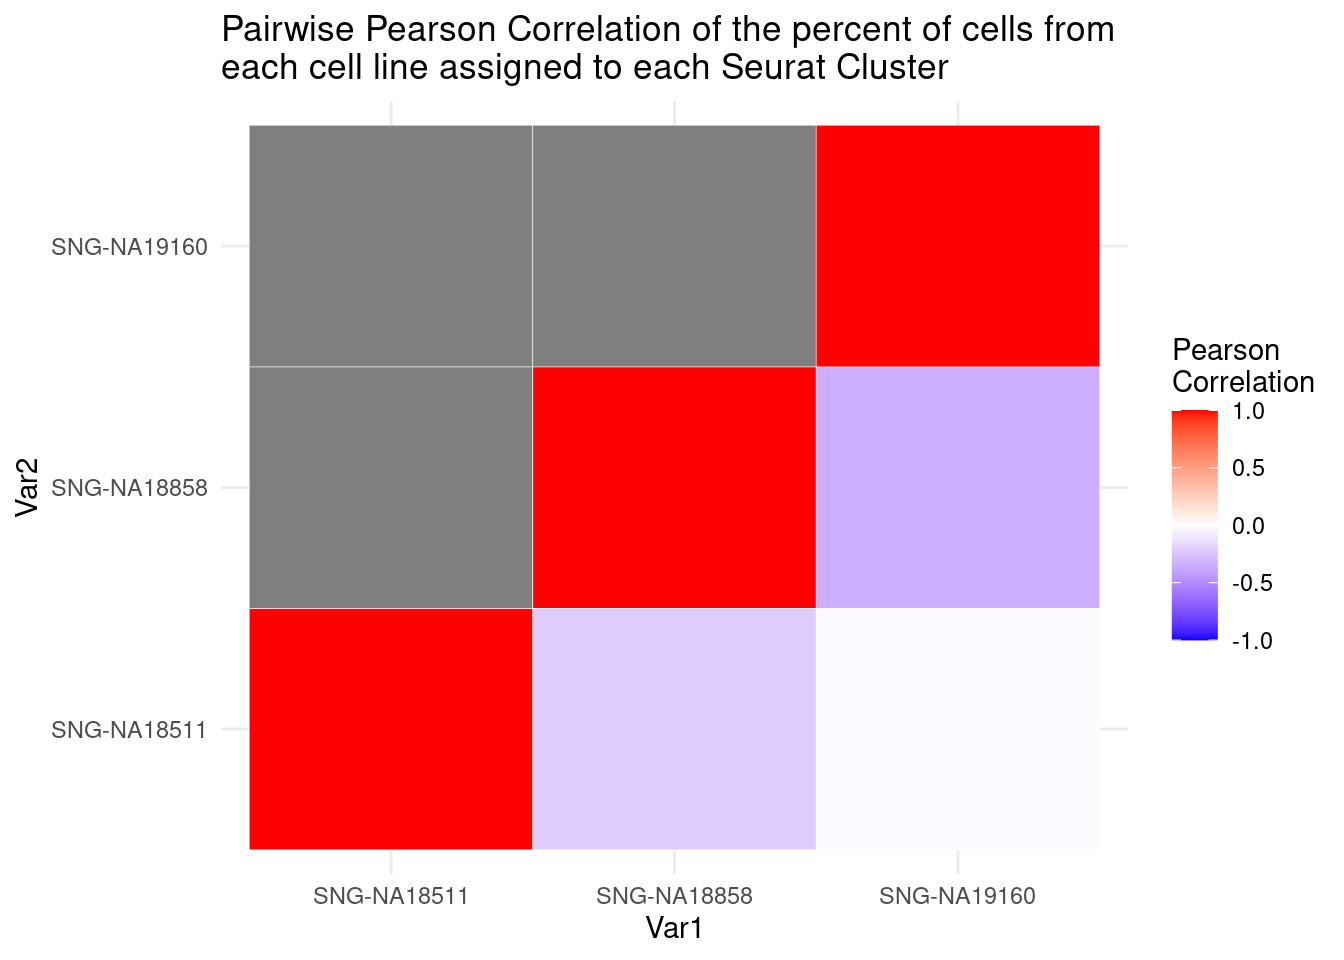
| Version | Author | Date |
|---|---|---|
| 421a225 | KLRhodes | 2020-08-10 |
#exploring similarity in the number of cells per individual between batches
merged.Batch1<- (subset(merged, Batch == "Batch1"))
b1t<- table(merged.Batch1$SCT_snn_res.1, merged.Batch1$individual)
remove("merged.Batch1")
b1tcolsums<- colSums(b1t)
percb1t<- b1t/b1tcolsums

merged.Batch2<- (subset(merged, Batch == "Batch2"))
b2t<- table(merged.Batch2$SCT_snn_res.1, merged.Batch2$individual)
remove("merged.Batch2")
b2tcolsums<- colSums(b2t)
percb2t<- b2t/b2tcolsums

merged.Batch3<- (subset(merged, Batch == "Batch3"))
b3t<- table(merged.Batch3$SCT_snn_res.1, merged.Batch3$individual)
remove("merged.Batch3")
b3tcolsums<- colSums(b3t)
percb3t<- b3t/b3tcolsums
cols1<- c("Batch1_18511","Batch1_18858","Batch1_19160", "Batch2_18511", "Batch2_18858","Batch2_19160",
"Batch3_18511","Batch3_18858", "Batch3_19160")
cols2<- c("Batch1_18511", "Batch2_18511", "Batch3_18511","Batch1_18858", "Batch2_18858", "Batch3_18858","Batch1_19160", "Batch2_19160", "Batch3_19160")
fullpercs<- as.data.frame(cbind(percb1t[,1:3], percb2t,percb3t))
colnames(fullpercs)<-cols1
fullpercs<- cbind(fullpercs$Batch1_18511, fullpercs$Batch2_18511, fullpercs$Batch3_18511,
fullpercs$Batch1_18858, fullpercs$Batch2_18858, fullpercs$Batch3_18858,
fullpercs$Batch1_19160, fullpercs$Batch2_19160, fullpercs$Batch3_19160)
colnames(fullpercs)<-cols2
fullpercs_cor<- round(cor(fullpercs),2)
fullpercs_melt<- melt(fullpercs_cor)
ggplot(data= fullpercs_melt, aes(x=Var1, y=Var2, fill=value)) +
geom_tile(color="white") +
scale_fill_gradient2(low="blue", high="red", mid="white", midpoint = 0, limit= c(-1,1), space= "Lab", name="Pearson\nCorrelation") +
theme_minimal() +
theme(axis.text.x = element_text(angle = 30, hjust=1))+
ggtitle("Pairwise Pearson Correlation of the percent of cells from \neach cell line assigned to each Seurat Cluster (res 1)")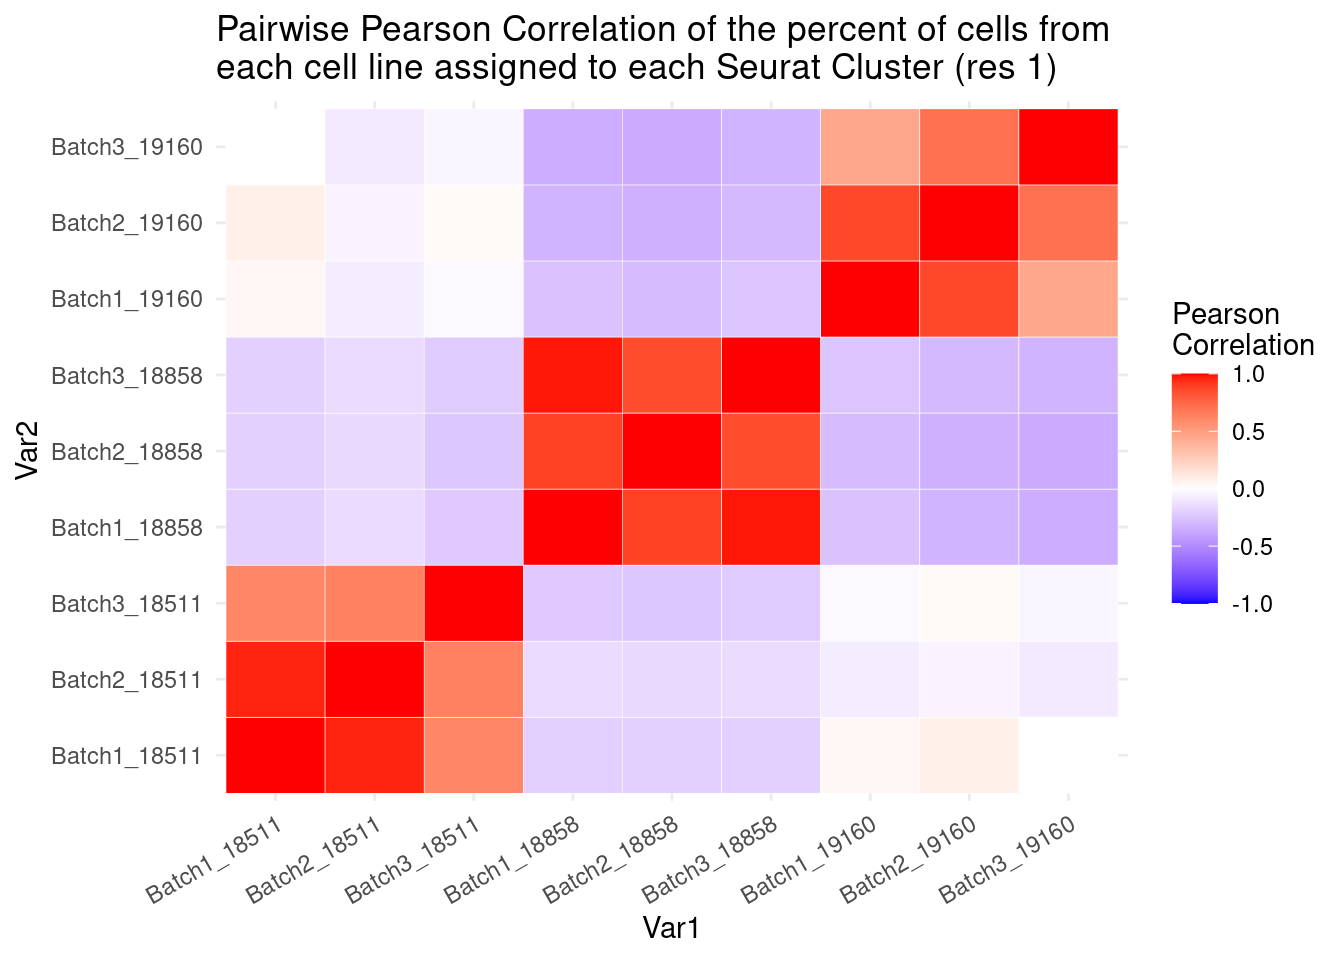
| Version | Author | Date |
|---|---|---|
| 421a225 | KLRhodes | 2020-08-10 |
#now clustering individual_Batch samples with hierarchical clustering/they will get reordered based on similarity

beauty<- colorRampPalette(brewer.pal(9,"Purples"))(200)

rownames(fullpercs)<- c(0:(nrow(fullpercs)-1))

heatmap(as.matrix(fullpercs), scale="none", col=beauty, cexCol = .7, cexRow=.6)
text(1:ncol(fullpercs),labels=names(fullpercs),srt=30)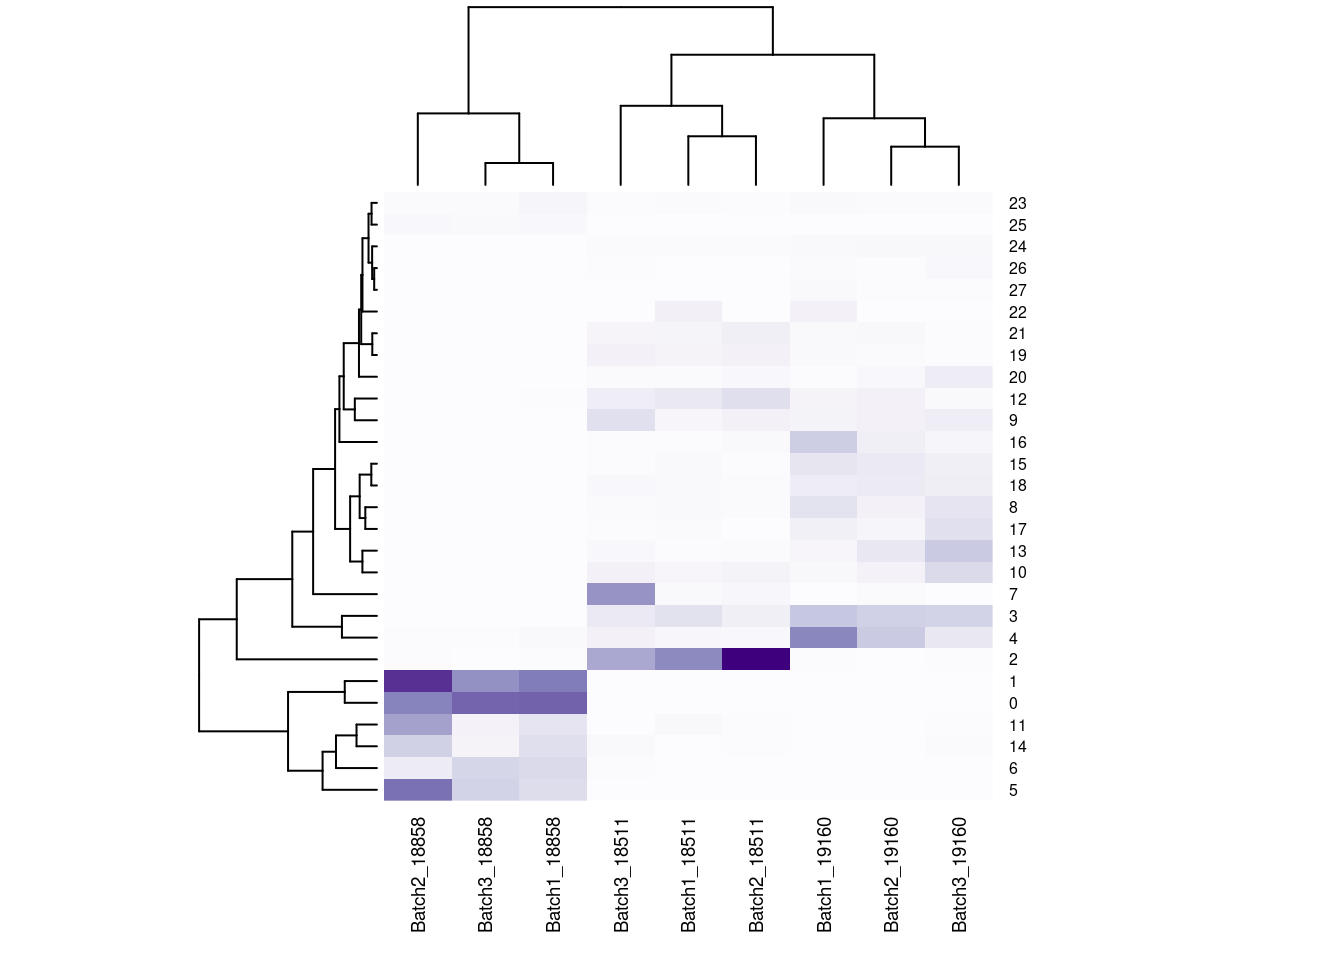
| Version | Author | Date |
|---|---|---|
| 421a225 | KLRhodes | 2020-08-10 |
#generate a heatmap of the proportion of cells from each individual_batch in each seurat cluster. dendrograms based on similarity of the vectors. should be colored by the value(proportion), but some of the cluster/sample values to seem to match with the colorReclustering with less resolution, check if everything is robust
#reassign idents
Idents(merged)<- 'SCT_snn_res.0.5'
DimPlot(merged, reduction = "umap")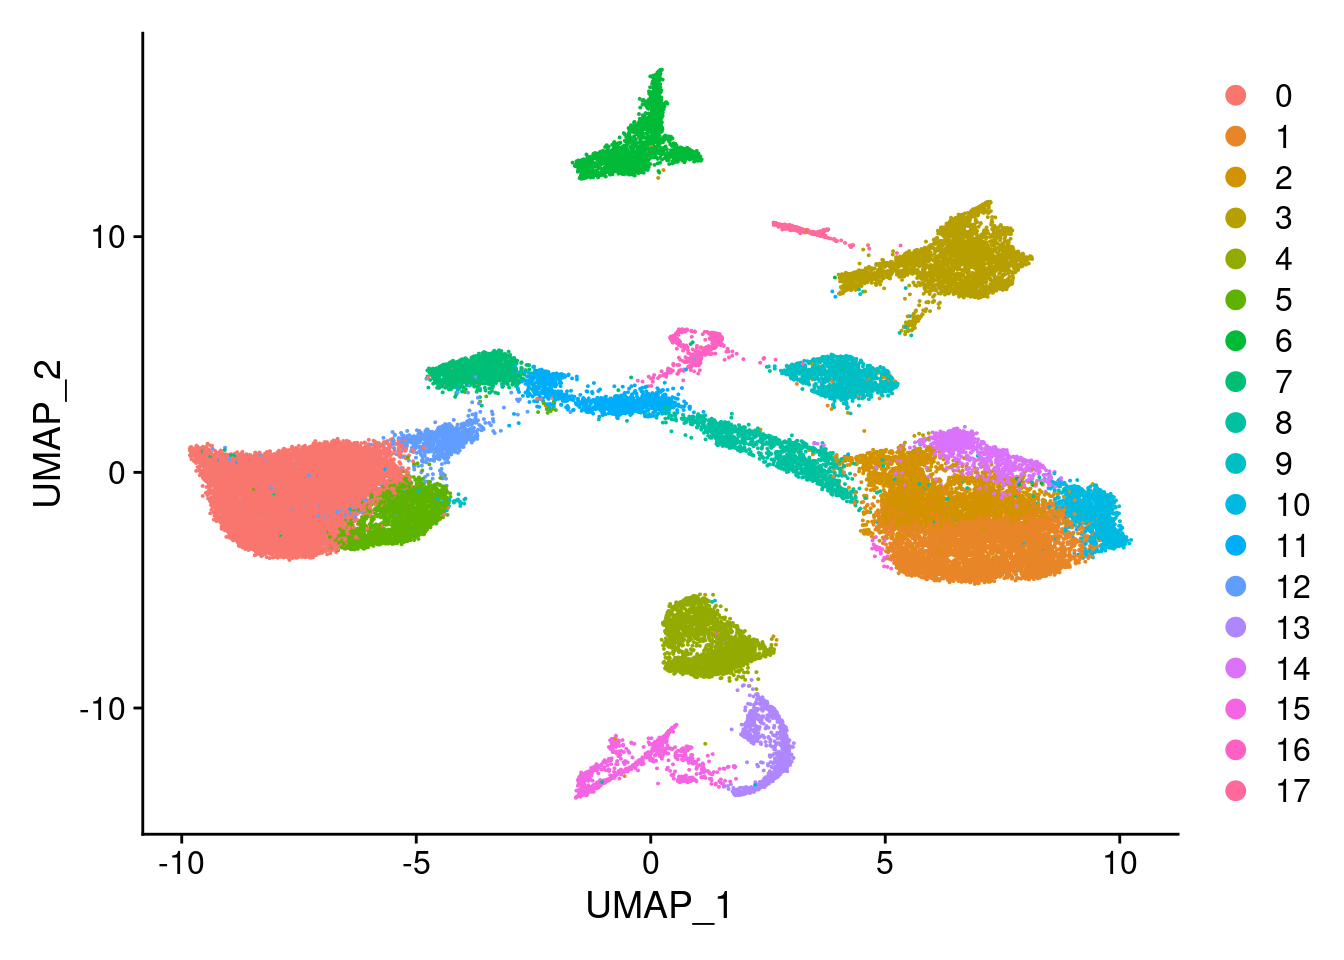
| Version | Author | Date |
|---|---|---|
| 421a225 | KLRhodes | 2020-08-10 |
DimPlot(merged, reduction = "umap", group.by = "Batch")
| Version | Author | Date |
|---|---|---|
| 421a225 | KLRhodes | 2020-08-10 |
DimPlot(merged, reduction = "umap", group.by = "individual")
| Version | Author | Date |
|---|---|---|
| 421a225 | KLRhodes | 2020-08-10 |
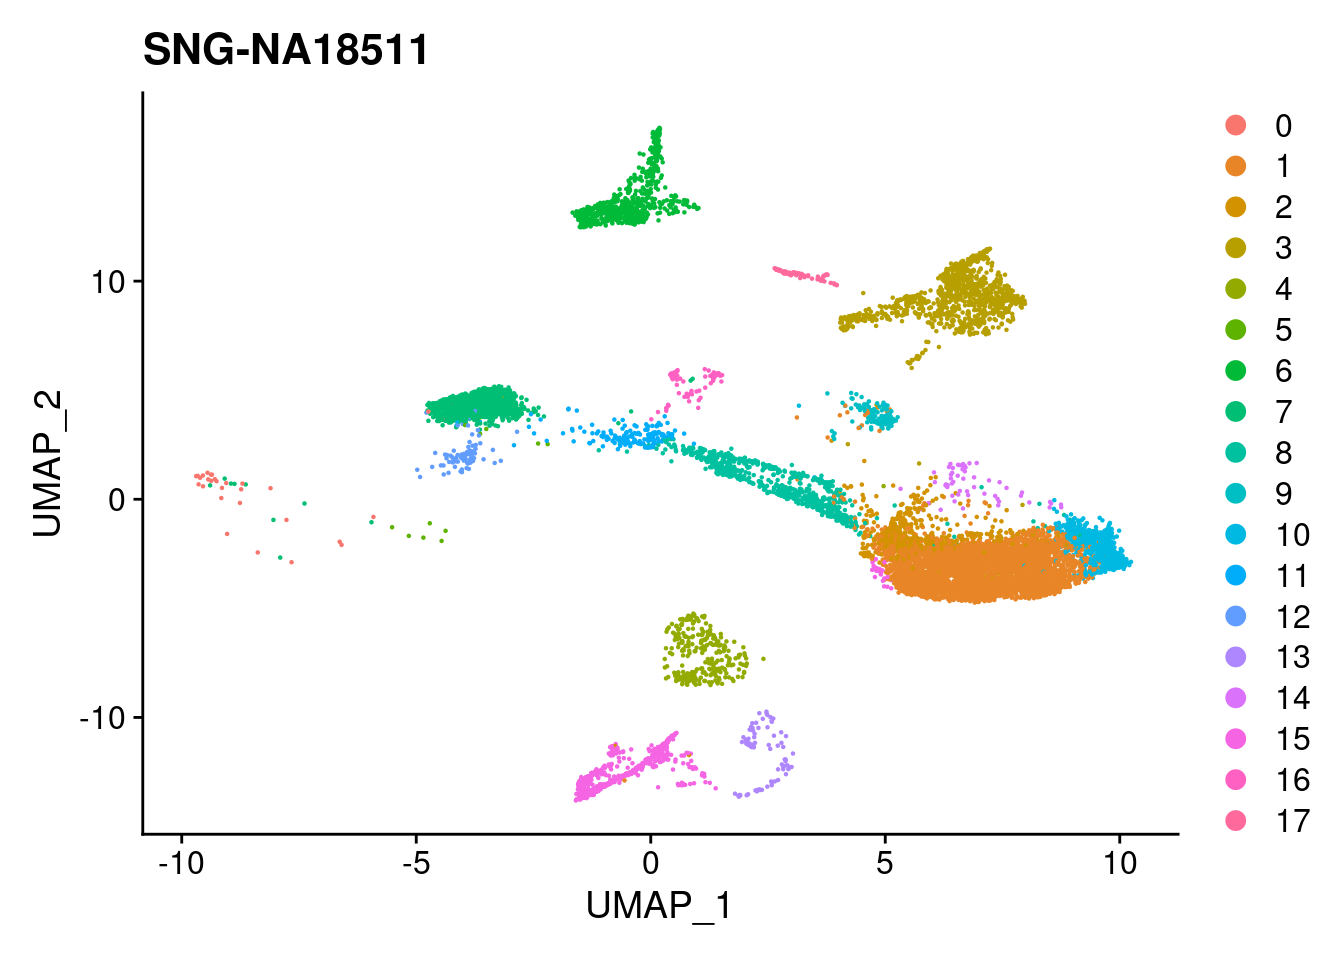
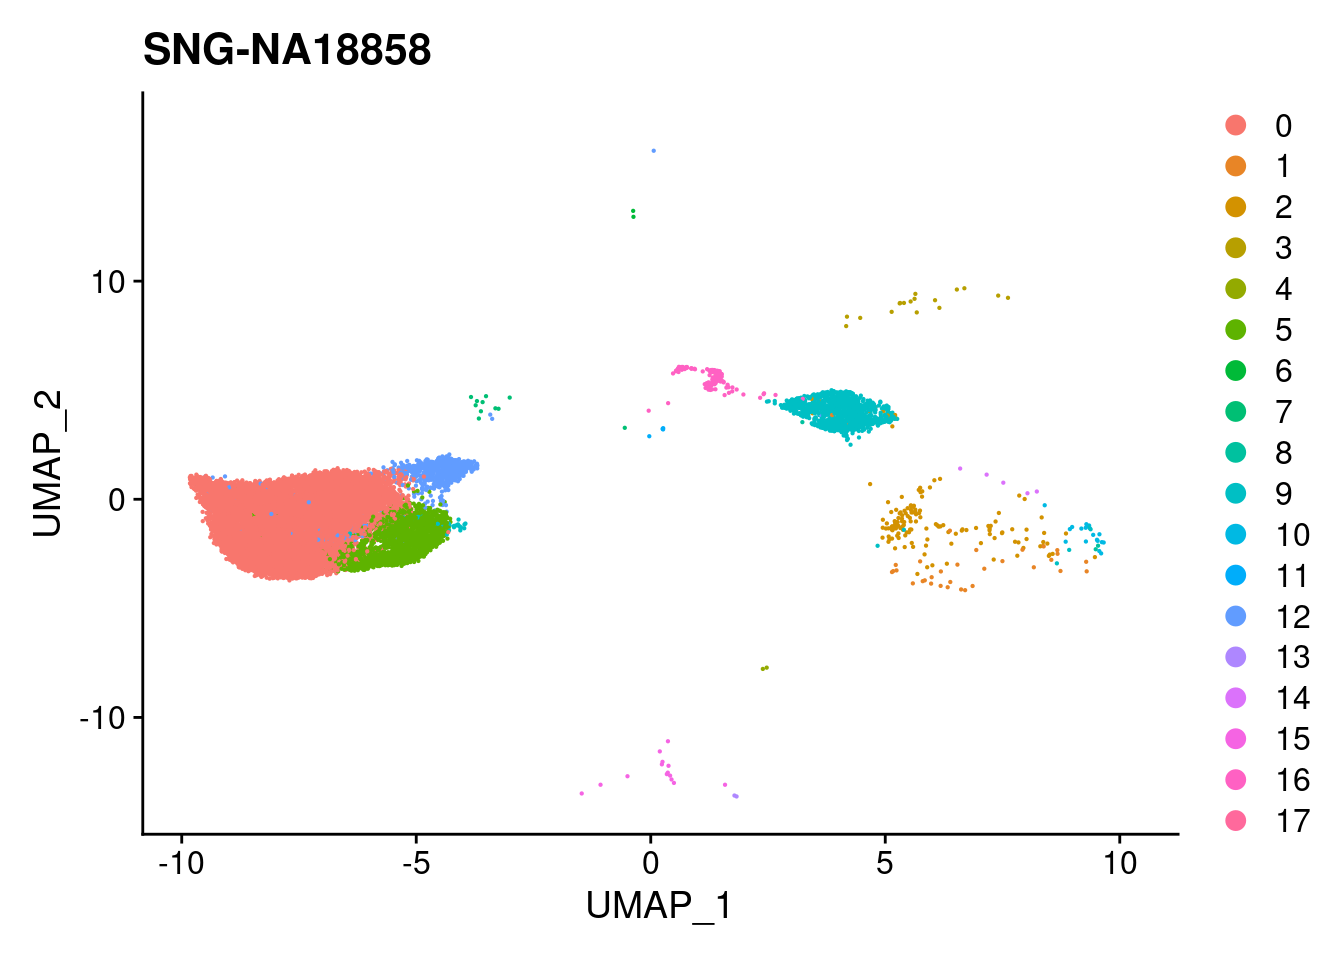
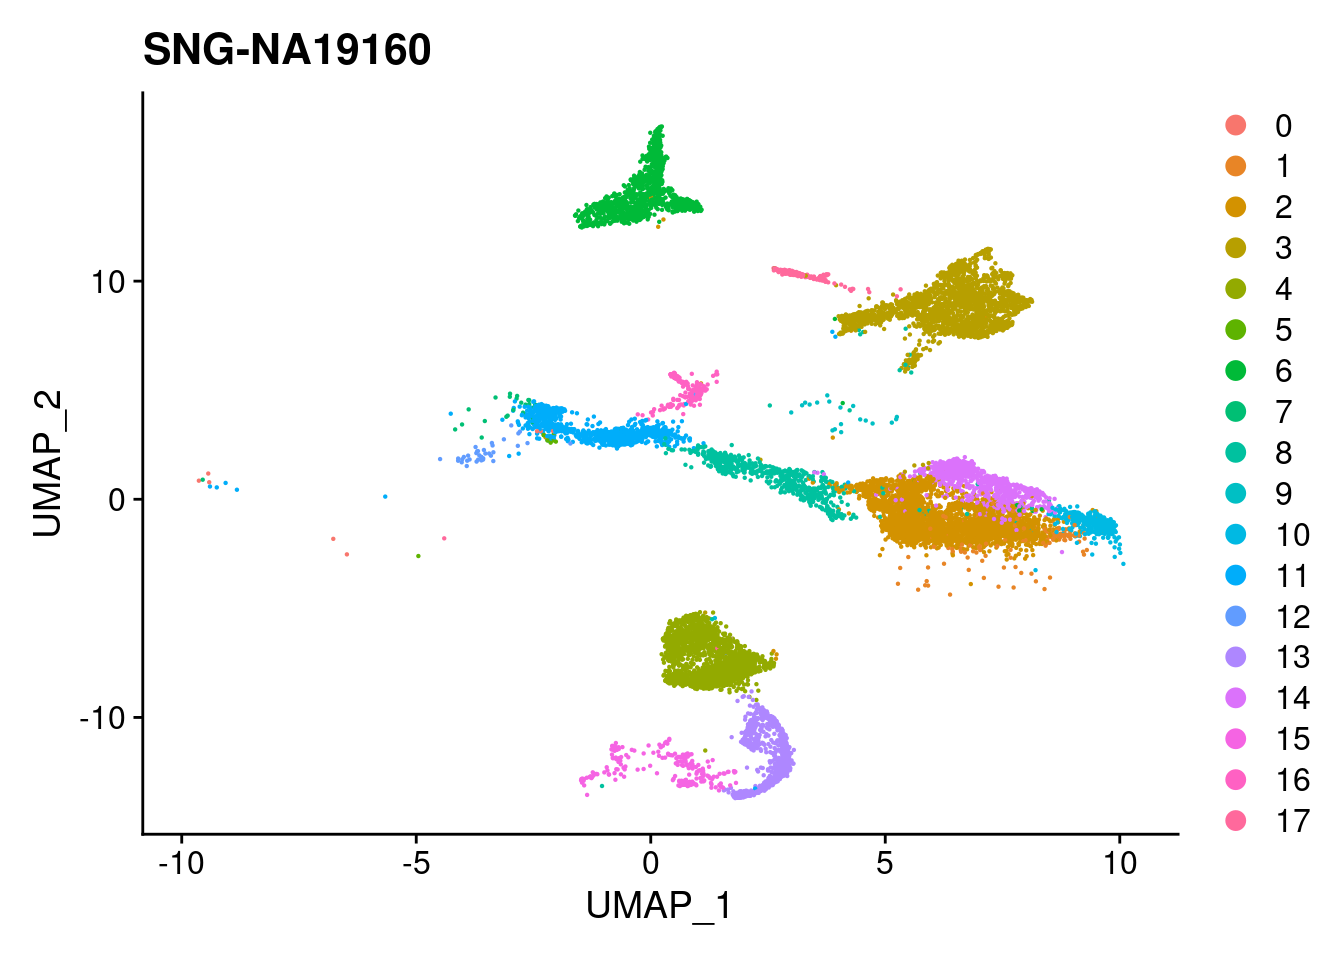
xlim <- c(min(merged@reductions$umap@cell.embeddings[,'UMAP_1']),
          max(merged@reductions$umap@cell.embeddings[,'UMAP_1']))
ylim <- c(min(merged@reductions$umap@cell.embeddings[,'UMAP_2']),
          max(merged@reductions$umap@cell.embeddings[,'UMAP_2']))
for (i in individuals)
{
  print(DimPlot(merged, reduction = "umap",
                cells = WhichCells(merged, expression = individual == i)) +
          xlim(xlim) + ylim(ylim) + ggtitle(i))
}
| Version | Author | Date |
|---|---|---|
| 421a225 | KLRhodes | 2020-08-10 |
| Version | Author | Date |
|---|---|---|
| 421a225 | KLRhodes | 2020-08-10 |
| Version | Author | Date |
|---|---|---|
| 421a225 | KLRhodes | 2020-08-10 |
#exploring similarity in the number of cells per individual between batches
merged.Batch1<- (subset(merged, Batch == "Batch1"))
b1t<- table(merged.Batch1$SCT_snn_res.0.5, merged.Batch1$individual)
remove("merged.Batch1")
b1tcolsums<- colSums(b1t)
percb1t<- b1t/b1tcolsums

merged.Batch2<- (subset(merged, Batch == "Batch2"))
b2t<- table(merged.Batch2$SCT_snn_res.0.5, merged.Batch2$individual)
remove("merged.Batch2")
b2tcolsums<- colSums(b2t)
percb2t<- b2t/b2tcolsums

merged.Batch3<- (subset(merged, Batch == "Batch3"))
b3t<- table(merged.Batch3$SCT_snn_res.0.5, merged.Batch3$individual)
remove("merged.Batch3")
b3tcolsums<- colSums(b3t)
percb3t<- b3t/b3tcolsums
cols1<- c("Batch1_18511","Batch1_18858","Batch1_19160", "Batch2_18511", "Batch2_18858","Batch2_19160",
"Batch3_18511","Batch3_18858", "Batch3_19160")
cols2<- c("Batch1_18511", "Batch2_18511", "Batch3_18511","Batch1_18858", "Batch2_18858", "Batch3_18858","Batch1_19160", "Batch2_19160", "Batch3_19160")
fullpercs<- as.data.frame(cbind(percb1t[,1:3], percb2t,percb3t))
colnames(fullpercs)<-cols1
fullpercs<- cbind(fullpercs$Batch1_18511, fullpercs$Batch2_18511, fullpercs$Batch3_18511,
fullpercs$Batch1_18858, fullpercs$Batch2_18858, fullpercs$Batch3_18858,
fullpercs$Batch1_19160, fullpercs$Batch2_19160, fullpercs$Batch3_19160)
colnames(fullpercs)<-cols2
fullpercs_cor<- round(cor(fullpercs),2)
fullpercs_melt<- melt(fullpercs_cor)
ggplot(data= fullpercs_melt, aes(x=Var1, y=Var2, fill=value)) +
geom_tile(color="white") +
scale_fill_gradient2(low="blue", high="red", mid="white", midpoint = 0, limit= c(-1,1), space= "Lab", name="Pearson\nCorrelation") +
theme_minimal() +
theme(axis.text.x = element_text(angle = 30, hjust=1))+
ggtitle("Pairwise Pearson Correlation of the percent of cells from \neach cell line assigned to each Seurat Cluster\ncluster res. 0.5")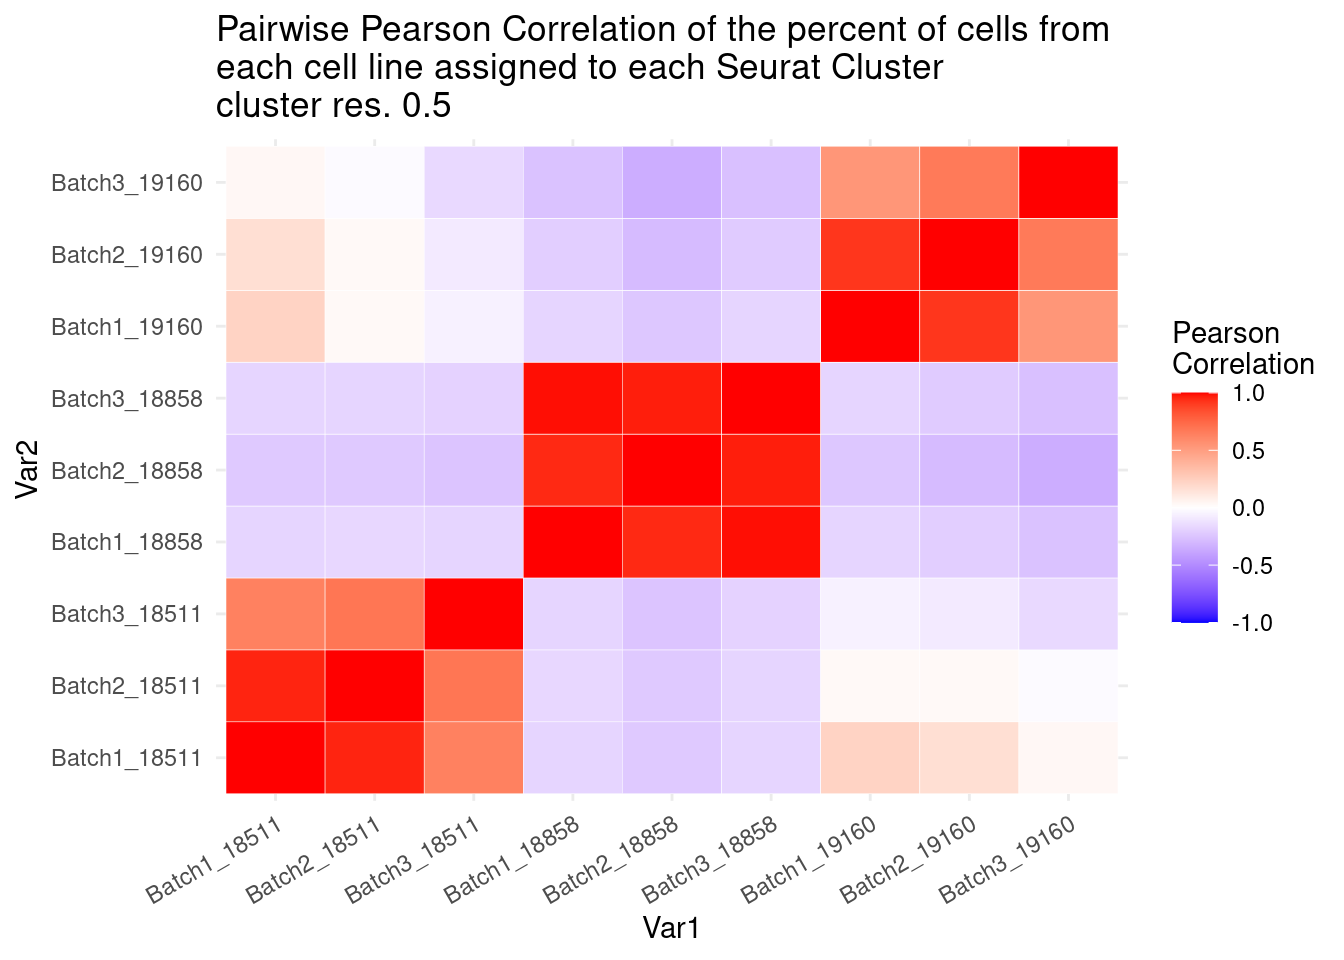
| Version | Author | Date |
|---|---|---|
| 421a225 | KLRhodes | 2020-08-10 |
#now clustering individual_Batch samples with hierarchical clustering/they will get reordered based on similarity

beauty<- colorRampPalette(brewer.pal(9,"Purples"))(200)

rownames(fullpercs)<- c(0:(nrow(fullpercs)-1))

heatmap(as.matrix(fullpercs), scale="none", col=beauty, cexCol = .7, cexRow=.6)
text(1:ncol(fullpercs),labels=names(fullpercs),srt=30)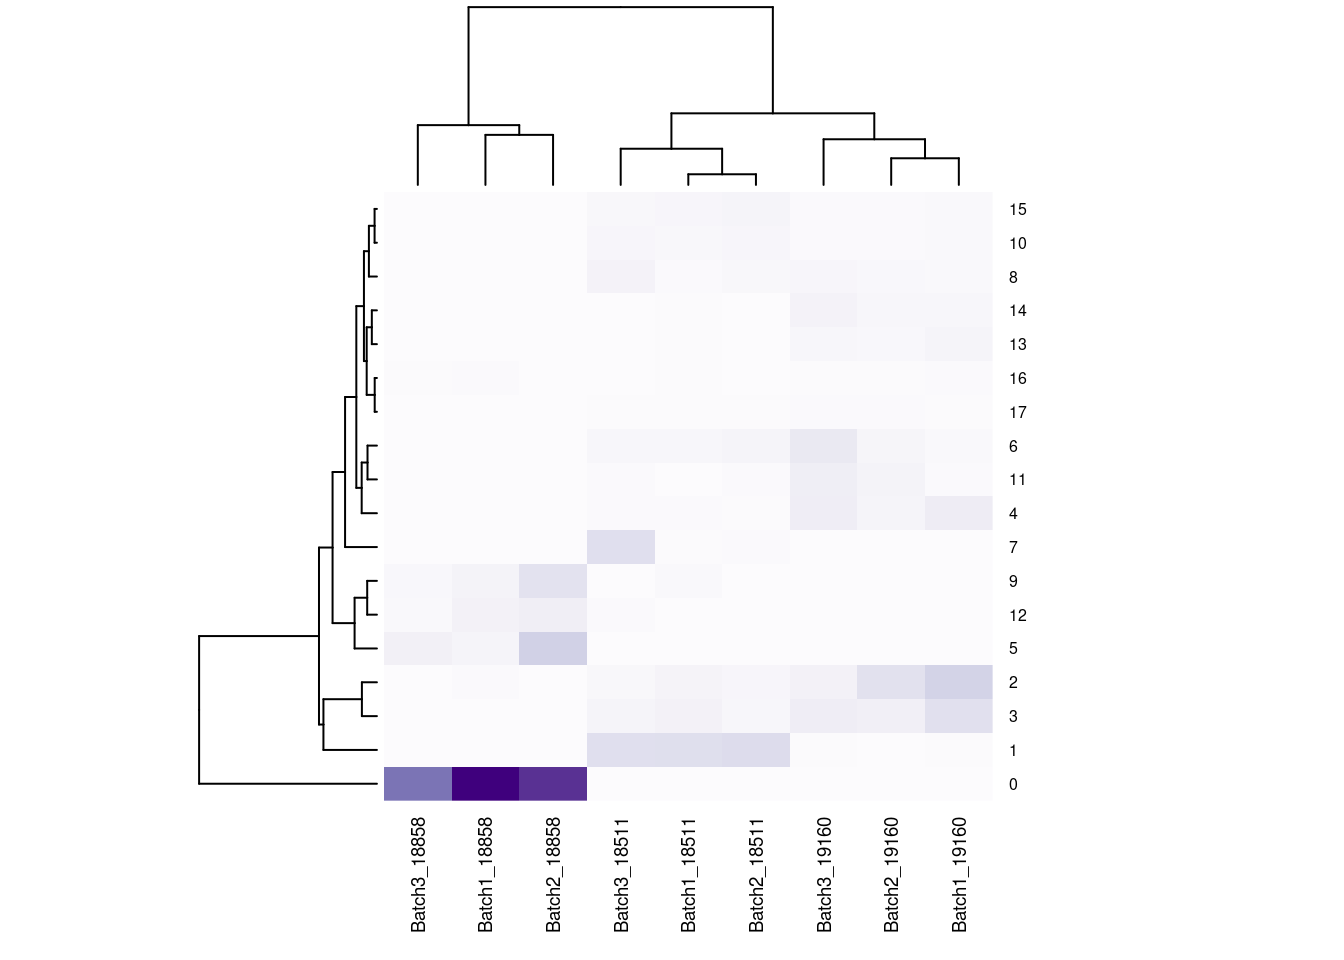
| Version | Author | Date |
|---|---|---|
| 421a225 | KLRhodes | 2020-08-10 |
#generate a heatmap of the raw proportion of cells from each individual_batch in each seurat cluster. dendrograms based on similarity of the vectors. should be colored by the value(proportion), but some of the cluster/sample values to seem to match with the color#reassign idents
Idents(merged)<- 'SCT_snn_res.0.1'DimPlot(merged, reduction = "umap")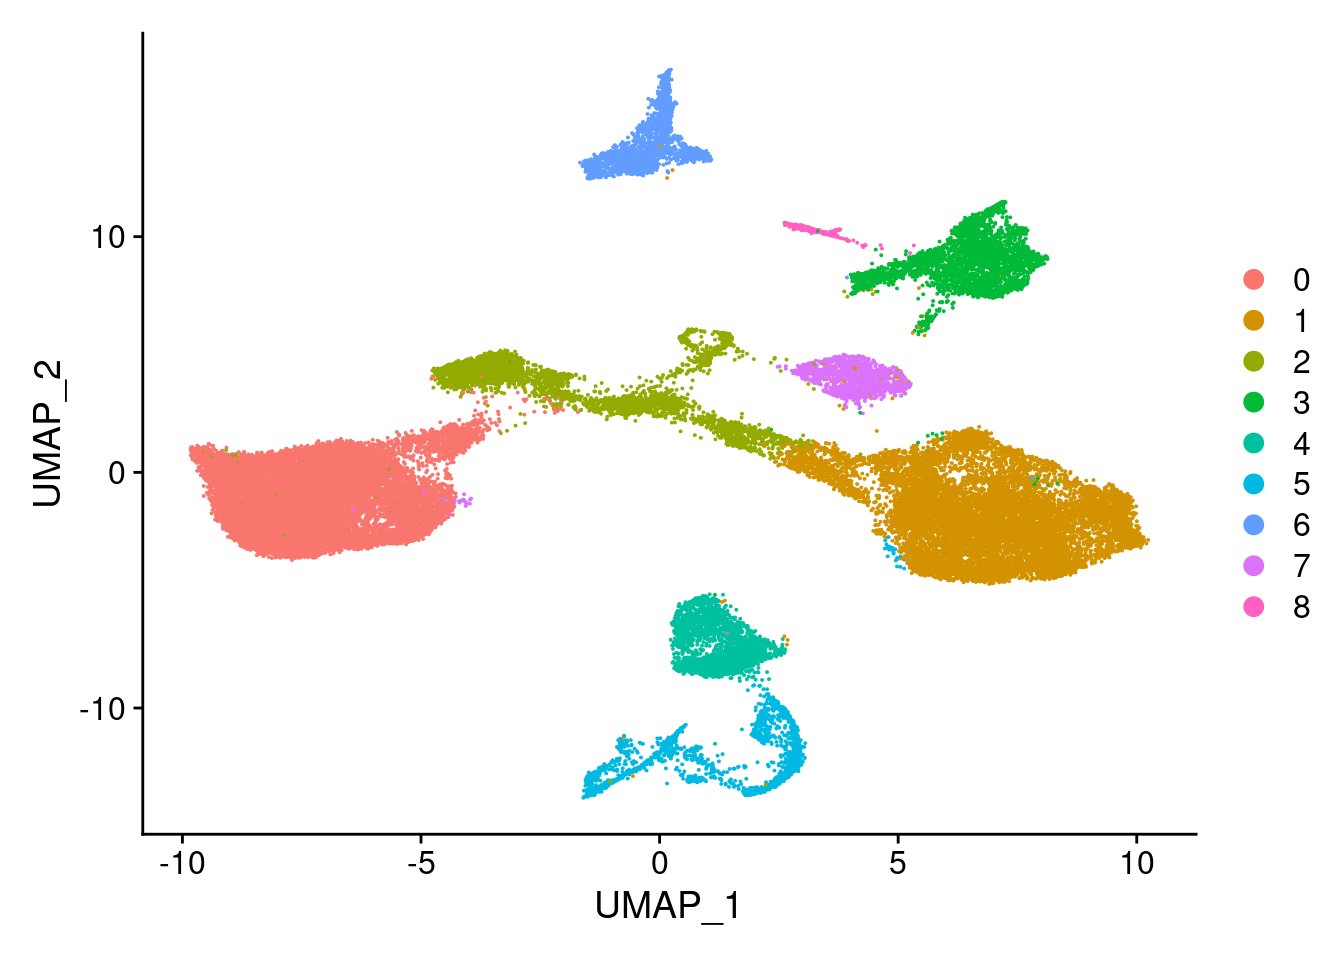
| Version | Author | Date |
|---|---|---|
| 421a225 | KLRhodes | 2020-08-10 |
DimPlot(merged, reduction = "umap", group.by = "Batch")
| Version | Author | Date |
|---|---|---|
| 421a225 | KLRhodes | 2020-08-10 |
DimPlot(merged, reduction = "umap", group.by = "individual")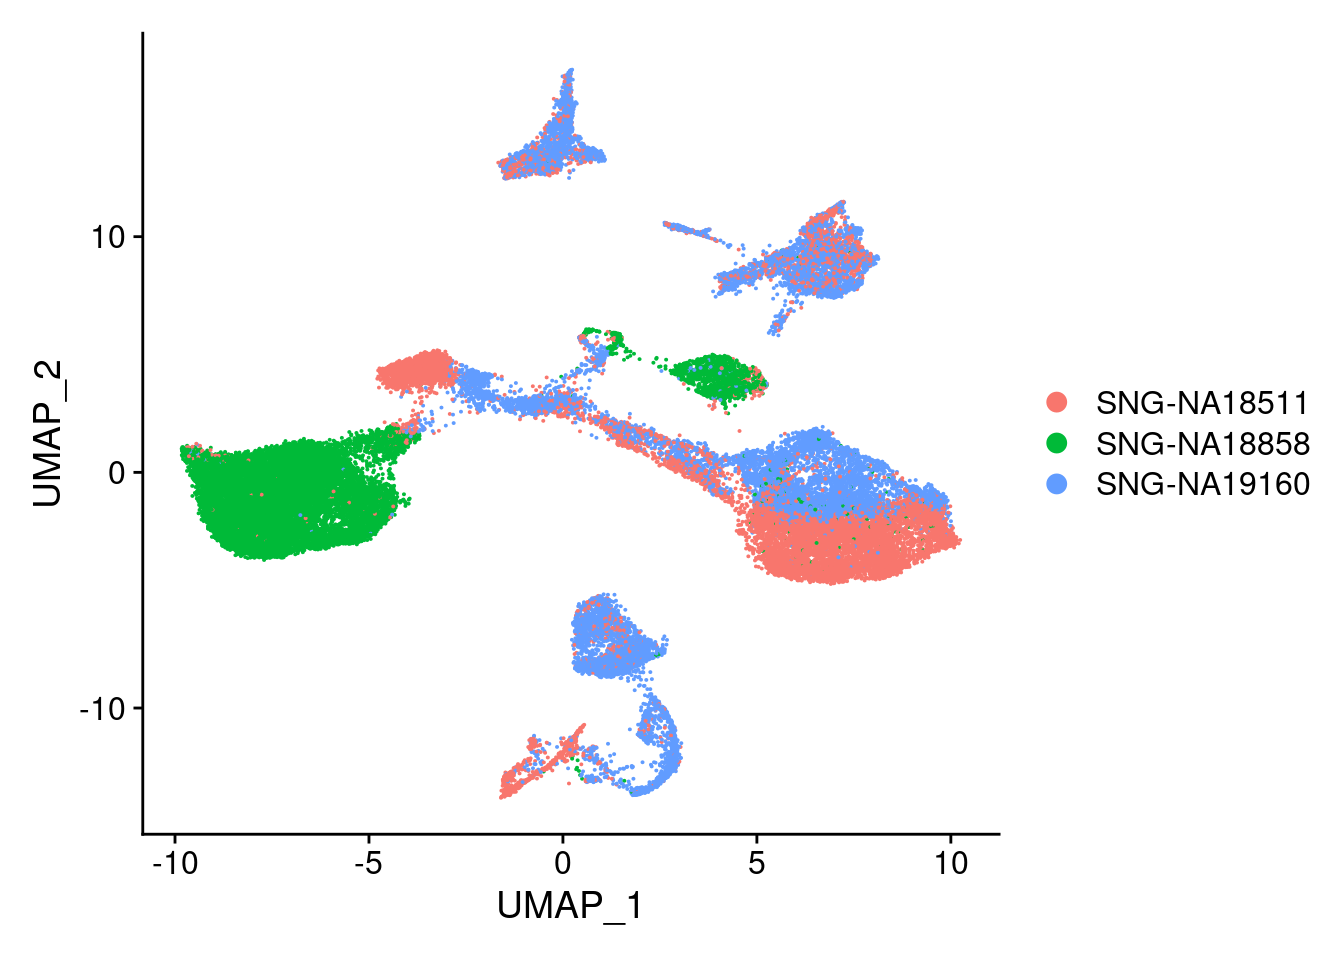
| Version | Author | Date |
|---|---|---|
| 421a225 | KLRhodes | 2020-08-10 |
xlim <- c(min(merged@reductions$umap@cell.embeddings[,'UMAP_1']),
          max(merged@reductions$umap@cell.embeddings[,'UMAP_1']))
ylim <- c(min(merged@reductions$umap@cell.embeddings[,'UMAP_2']),
          max(merged@reductions$umap@cell.embeddings[,'UMAP_2']))
for (i in individuals)
{
  print(DimPlot(merged, reduction = "umap",
                cells = WhichCells(merged, expression = individual == i)) +
          xlim(xlim) + ylim(ylim) + ggtitle(i))
}
| Version | Author | Date |
|---|---|---|
| 421a225 | KLRhodes | 2020-08-10 |
| Version | Author | Date |
|---|---|---|
| 421a225 | KLRhodes | 2020-08-10 |
| Version | Author | Date |
|---|---|---|
| 421a225 | KLRhodes | 2020-08-10 |
#exploring similarity in the number of cells per individual between batches
merged.Batch1<- (subset(merged, Batch == "Batch1"))
b1t<- table(merged.Batch1$SCT_snn_res.0.1, merged.Batch1$individual)
remove("merged.Batch1")
b1tcolsums<- colSums(b1t)
percb1t<- b1t/b1tcolsums

merged.Batch2<- (subset(merged, Batch == "Batch2"))
b2t<- table(merged.Batch2$SCT_snn_res.0.1, merged.Batch2$individual)
remove("merged.Batch2")
b2tcolsums<- colSums(b2t)
percb2t<- b2t/b2tcolsums

merged.Batch3<- (subset(merged, Batch == "Batch3"))
b3t<- table(merged.Batch3$SCT_snn_res.0.1, merged.Batch3$individual)
remove("merged.Batch3")
b3tcolsums<- colSums(b3t)
percb3t<- b3t/b3tcolsums
cols1<- c("Batch1_18511","Batch1_18858","Batch1_19160", "Batch2_18511", "Batch2_18858","Batch2_19160",
"Batch3_18511","Batch3_18858", "Batch3_19160")
cols2<- c("Batch1_18511", "Batch2_18511", "Batch3_18511","Batch1_18858", "Batch2_18858", "Batch3_18858","Batch1_19160", "Batch2_19160", "Batch3_19160")
fullpercs<- as.data.frame(cbind(percb1t[,1:3], percb2t,percb3t))
colnames(fullpercs)<-cols1
fullpercs<- cbind(fullpercs$Batch1_18511, fullpercs$Batch2_18511, fullpercs$Batch3_18511,
fullpercs$Batch1_18858, fullpercs$Batch2_18858, fullpercs$Batch3_18858,
fullpercs$Batch1_19160, fullpercs$Batch2_19160, fullpercs$Batch3_19160)
colnames(fullpercs)<-cols2
fullpercs_cor<- round(cor(fullpercs),2)
fullpercs_melt<- melt(fullpercs_cor)
ggplot(data= fullpercs_melt, aes(x=Var1, y=Var2, fill=value)) +
geom_tile(color="white") +
scale_fill_gradient2(low="blue", high="red", mid="white", midpoint = 0, limit= c(-1,1), space= "Lab", name="Pearson\nCorrelation") +
theme_minimal() +
theme(axis.text.x = element_text(angle = 30, hjust=1))+
ggtitle("Pairwise Pearson Correlation of the percent of cells from \neach cell line assigned to each Seurat Cluster\ncluster res. 0.1")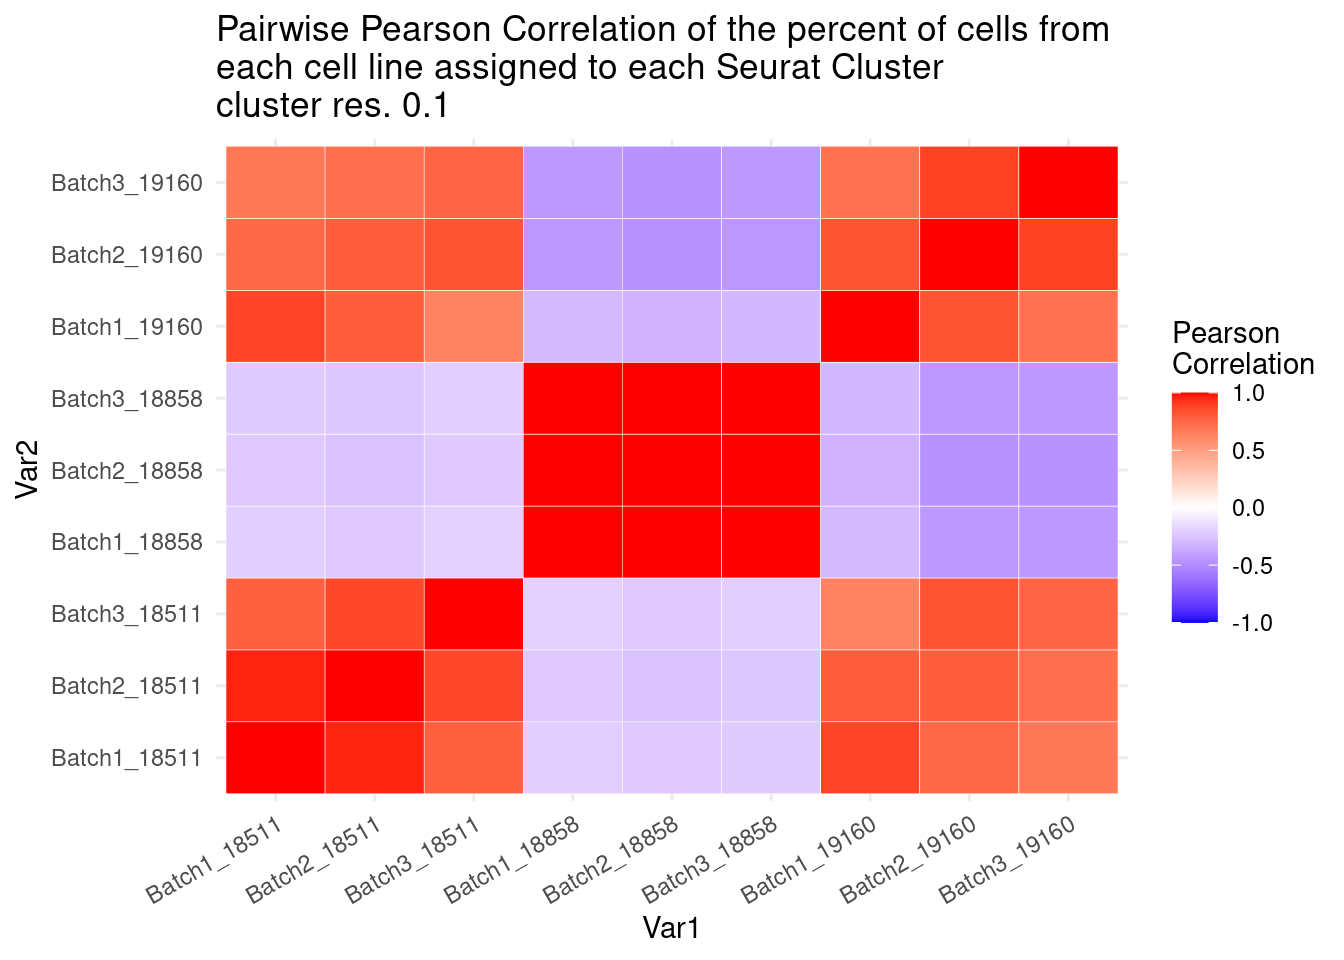
| Version | Author | Date |
|---|---|---|
| 421a225 | KLRhodes | 2020-08-10 |
#now clustering individual_Batch samples with hierarchical clustering/they will get reordered based on similarity

beauty<- colorRampPalette(brewer.pal(9,"Purples"))(200)
#fullnonorm<- as.data.frame(cbind(b1t[,1:3], b2t,b3t))
#colnames(fullnonorm)<-cols1
#heatmap((as.matrix(fullnonorm)), scale="column", col= beauty)

rownames(fullpercs)<- c(0:(nrow(fullpercs)-1))

heatmap(as.matrix(fullpercs), scale="none", col=beauty, cexCol = .7, cexRow=.6)
text(1:ncol(fullpercs),labels=names(fullpercs),srt=30)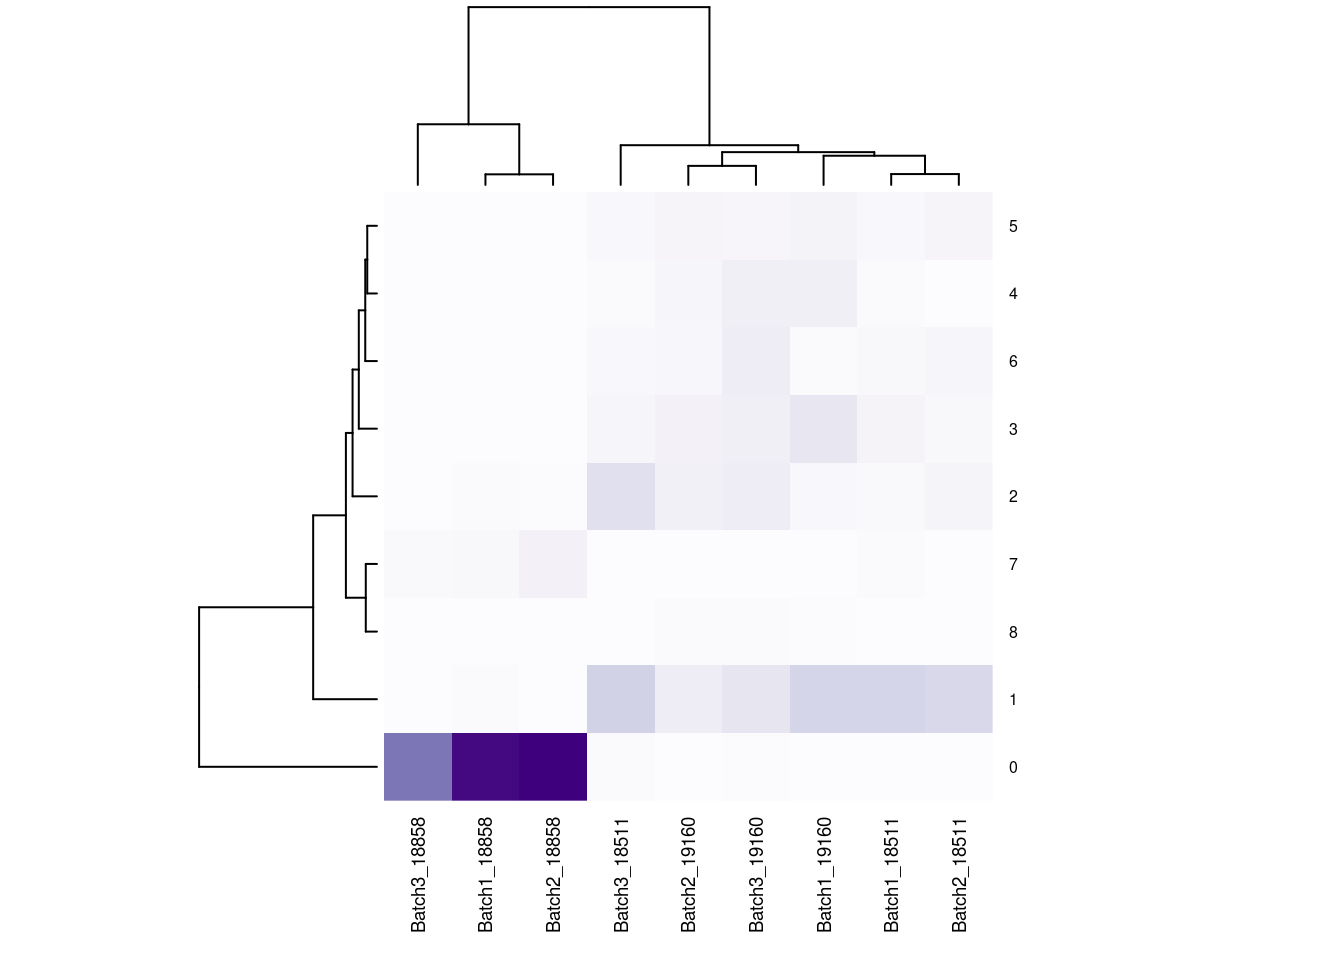
| Version | Author | Date |
|---|---|---|
| 421a225 | KLRhodes | 2020-08-10 |
#generate a heatmap of the raw proportion of cells from each individual_batch in each seurat cluster. dendrograms based on similarity of the vectors. should be colored by the value(proportion), but some of the cluster/sample values to seem to match with the color#reassign idents
Idents(merged)<- 'SCT_snn_res.0.8'DimPlot(merged, reduction = "umap")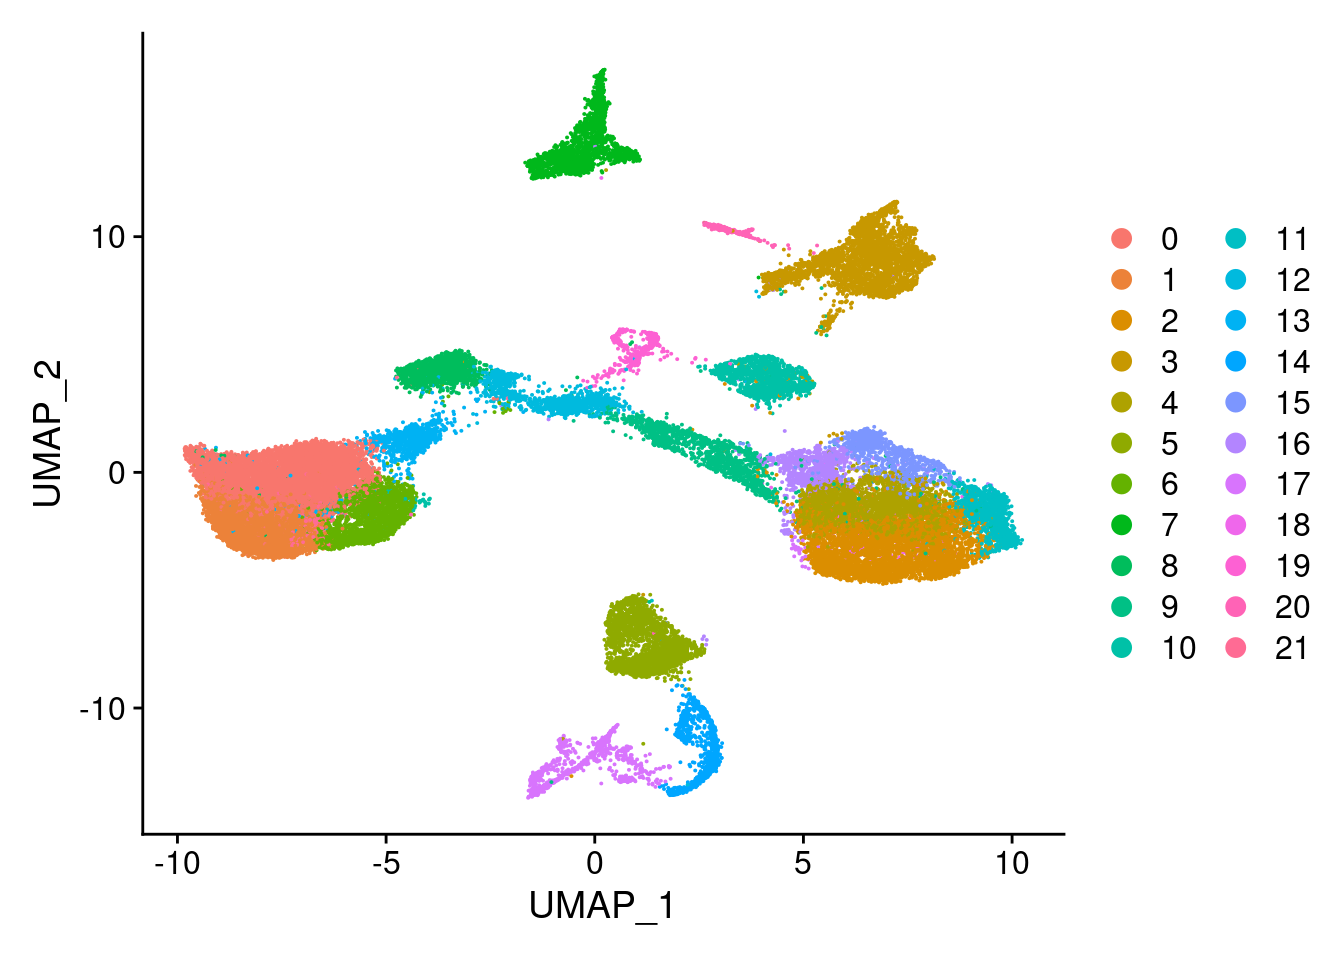
| Version | Author | Date |
|---|---|---|
| 421a225 | KLRhodes | 2020-08-10 |
DimPlot(merged, reduction = "umap", group.by = "Batch")
| Version | Author | Date |
|---|---|---|
| 421a225 | KLRhodes | 2020-08-10 |
DimPlot(merged, reduction = "umap", group.by = "individual")
| Version | Author | Date |
|---|---|---|
| 421a225 | KLRhodes | 2020-08-10 |
xlim <- c(min(merged@reductions$umap@cell.embeddings[,'UMAP_1']),
          max(merged@reductions$umap@cell.embeddings[,'UMAP_1']))
ylim <- c(min(merged@reductions$umap@cell.embeddings[,'UMAP_2']),
          max(merged@reductions$umap@cell.embeddings[,'UMAP_2']))
for (i in individuals)
{
  print(DimPlot(merged, reduction = "umap",
                cells = WhichCells(merged, expression = individual == i)) +
          xlim(xlim) + ylim(ylim) + ggtitle(i))
}
| Version | Author | Date |
|---|---|---|
| 421a225 | KLRhodes | 2020-08-10 |
| Version | Author | Date |
|---|---|---|
| 421a225 | KLRhodes | 2020-08-10 |
| Version | Author | Date |
|---|---|---|
| 421a225 | KLRhodes | 2020-08-10 |
#exploring similarity in the number of cells per individual between batches
merged.Batch1<- (subset(merged, Batch == "Batch1"))
b1t<- table(merged.Batch1$SCT_snn_res.0.8, merged.Batch1$individual)
remove("merged.Batch1")
b1tcolsums<- colSums(b1t)
percb1t<- b1t/b1tcolsums

merged.Batch2<- (subset(merged, Batch == "Batch2"))
b2t<- table(merged.Batch2$SCT_snn_res.0.8, merged.Batch2$individual)
remove("merged.Batch2")
b2tcolsums<- colSums(b2t)
percb2t<- b2t/b2tcolsums

merged.Batch3<- (subset(merged, Batch == "Batch3"))
b3t<- table(merged.Batch3$SCT_snn_res.0.8, merged.Batch3$individual)
remove("merged.Batch3")
b3tcolsums<- colSums(b3t)
percb3t<- b3t/b3tcolsums
cols1<- c("Batch1_18511","Batch1_18858","Batch1_19160", "Batch2_18511", "Batch2_18858","Batch2_19160",
"Batch3_18511","Batch3_18858", "Batch3_19160")
cols2<- c("Batch1_18511", "Batch2_18511", "Batch3_18511","Batch1_18858", "Batch2_18858", "Batch3_18858","Batch1_19160", "Batch2_19160", "Batch3_19160")
fullpercs<- as.data.frame(cbind(percb1t[,1:3], percb2t,percb3t))
colnames(fullpercs)<-cols1
fullpercs<- cbind(fullpercs$Batch1_18511, fullpercs$Batch2_18511, fullpercs$Batch3_18511,
fullpercs$Batch1_18858, fullpercs$Batch2_18858, fullpercs$Batch3_18858,
fullpercs$Batch1_19160, fullpercs$Batch2_19160, fullpercs$Batch3_19160)
colnames(fullpercs)<-cols2
fullpercs_cor<- round(cor(fullpercs),2)
fullpercs_melt<- melt(fullpercs_cor)
ggplot(data= fullpercs_melt, aes(x=Var1, y=Var2, fill=value)) +
geom_tile(color="white") +
scale_fill_gradient2(low="blue", high="red", mid="white", midpoint = 0, limit= c(-1,1), space= "Lab", name="Pearson\nCorrelation") +
theme_minimal() +
ggtitle("Pairwise Pearson Correlation of the percent of cells from \neach cell line assigned to each Seurat Cluster\ncluster res. 0.8")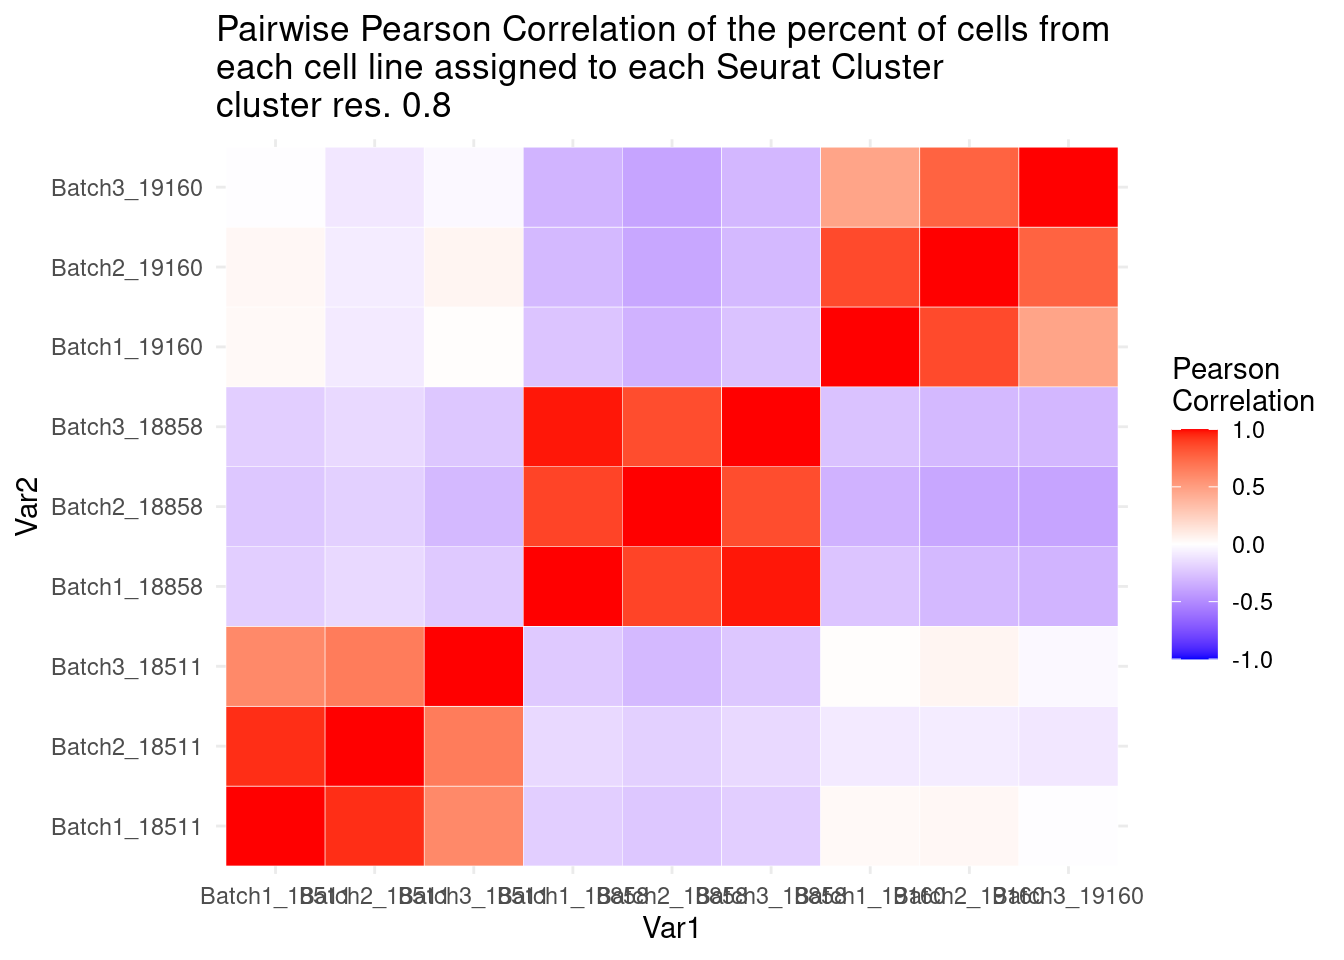
| Version | Author | Date |
|---|---|---|
| 421a225 | KLRhodes | 2020-08-10 |
#now clustering individual_Batch samples with hierarchical clustering/they will get reordered based on similarity

beauty<- colorRampPalette(brewer.pal(9,"Purples"))(200)

rownames(fullpercs)<- c(0:(nrow(fullpercs)-1))

heatmap(as.matrix(fullpercs), scale="none", col=beauty, cexCol = .7, cexRow=.6)
text(1:ncol(fullpercs),labels=names(fullpercs),srt=30)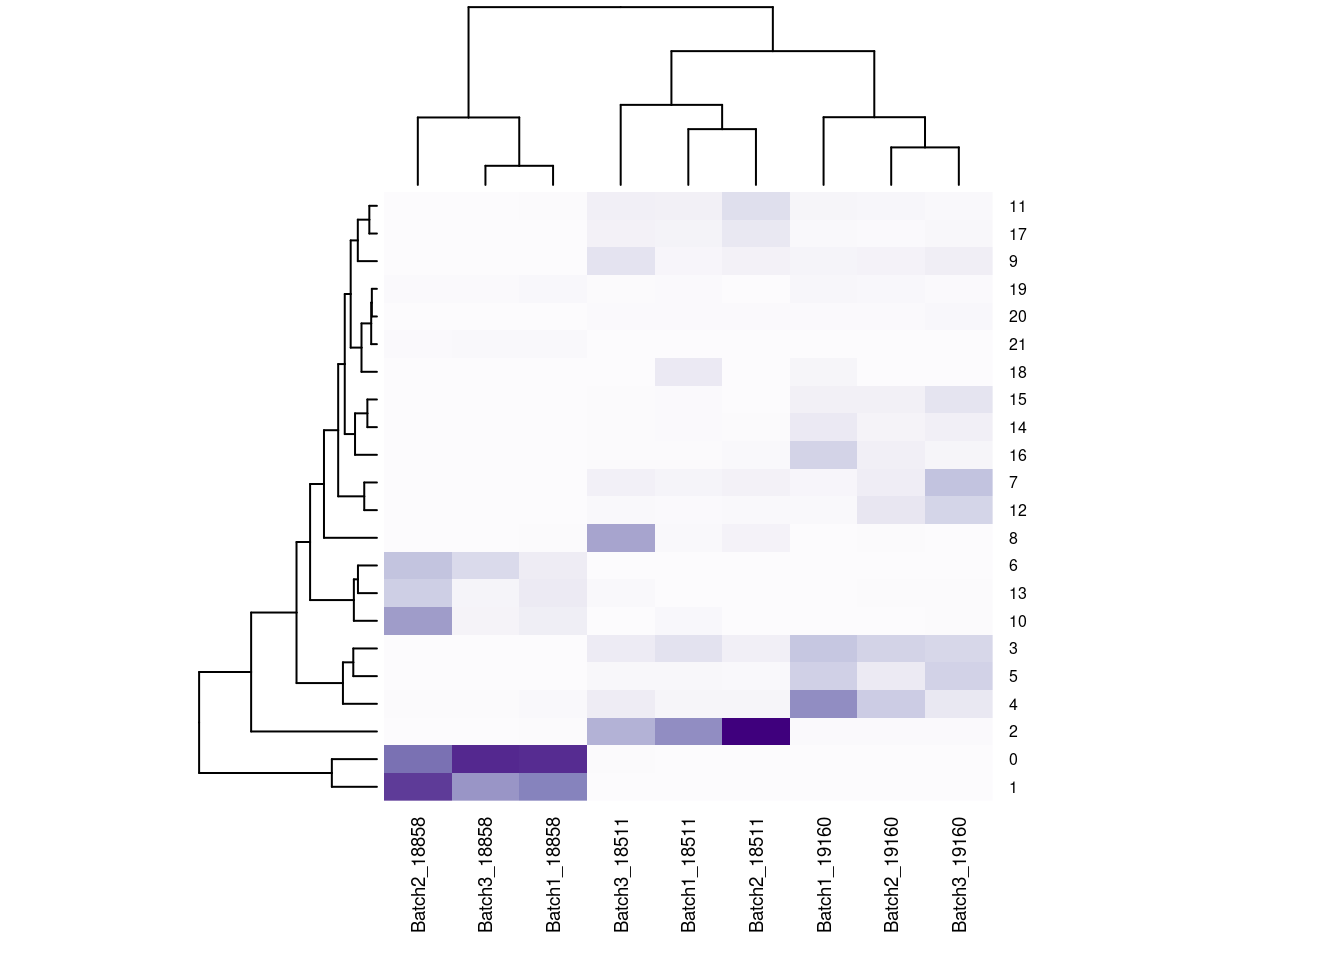
| Version | Author | Date |
|---|---|---|
| 421a225 | KLRhodes | 2020-08-10 |
#generate a heatmap of the raw proportion of cells from each individual_batch in each seurat cluster. dendrograms based on similarity of the vectors. should be colored by the value(proportion), but some of the cluster/sample values to seem to match with the colorVlnPlot(merged, features= "percent.mt", group.by = "SCT_snn_res.1", pt.size = 0)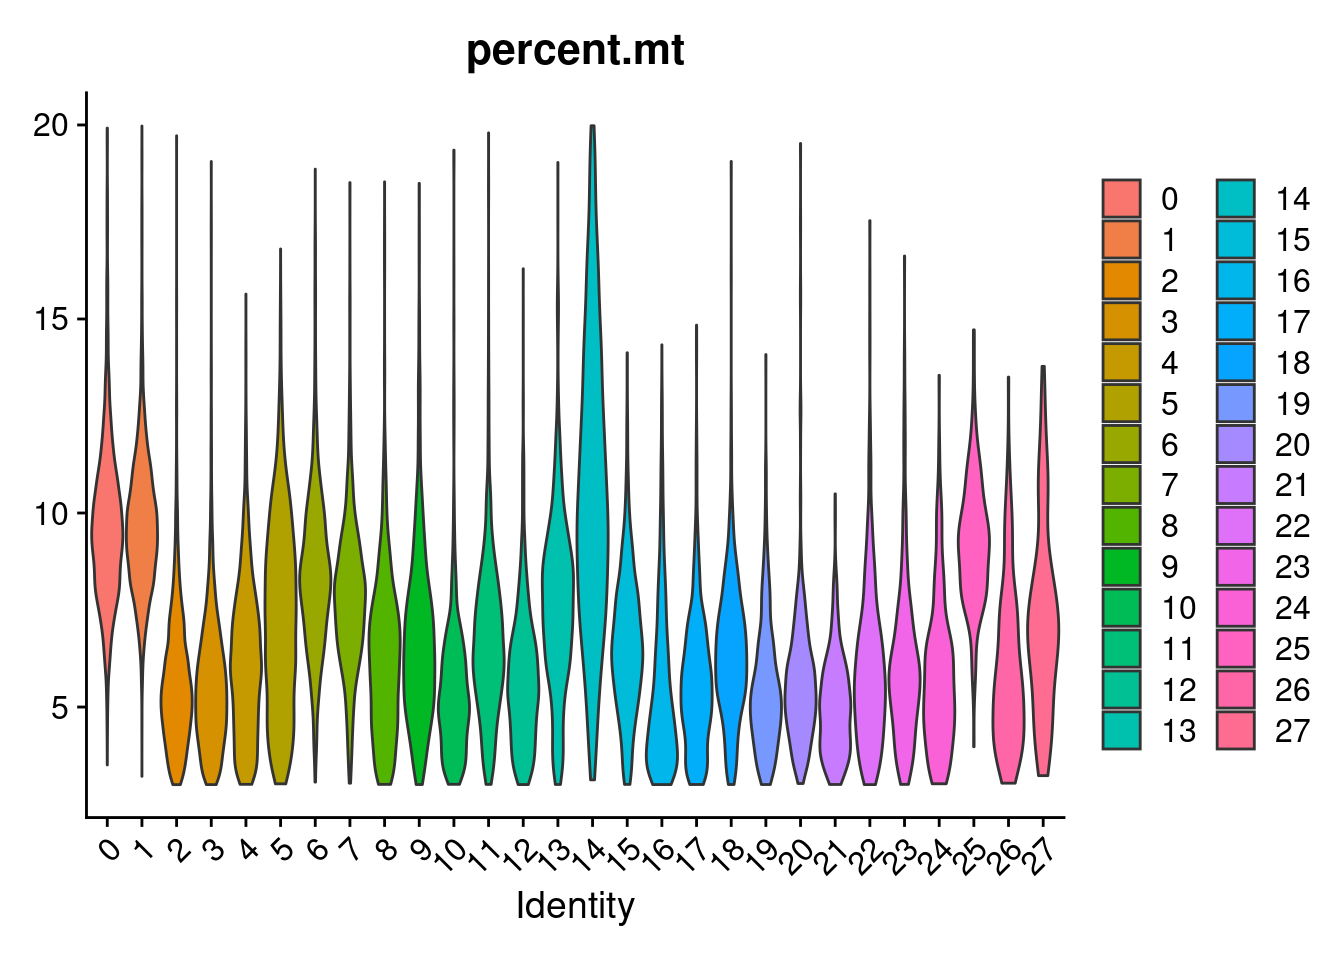
| Version | Author | Date |
|---|---|---|
| 421a225 | KLRhodes | 2020-08-10 |
merged[["percent.rps"]]<- PercentageFeatureSet(merged, pattern = "^RPS")
merged[["percent.rpl"]]<- PercentageFeatureSet(merged, pattern = "^RPL")
merged[["percent.rp"]]<- merged[["percent.rps"]]+merged[["percent.rpl"]]
VlnPlot(merged, features= "percent.rp", group.by = "SCT_snn_res.1", pt.size=0)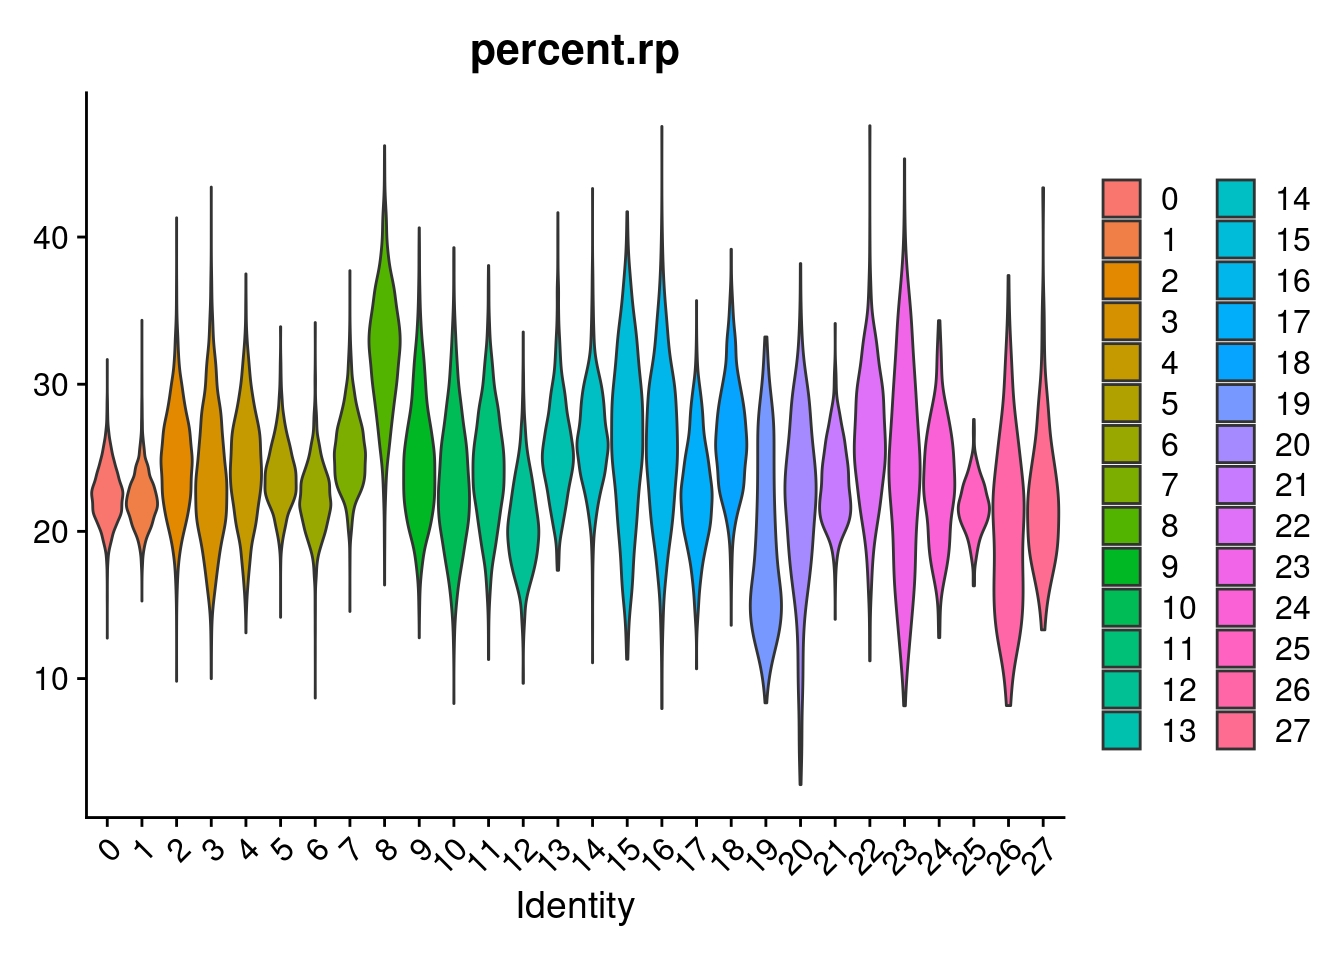
| Version | Author | Date |
|---|---|---|
| 421a225 | KLRhodes | 2020-08-10 |
FeaturePlot(merged, features = "nFeature_RNA")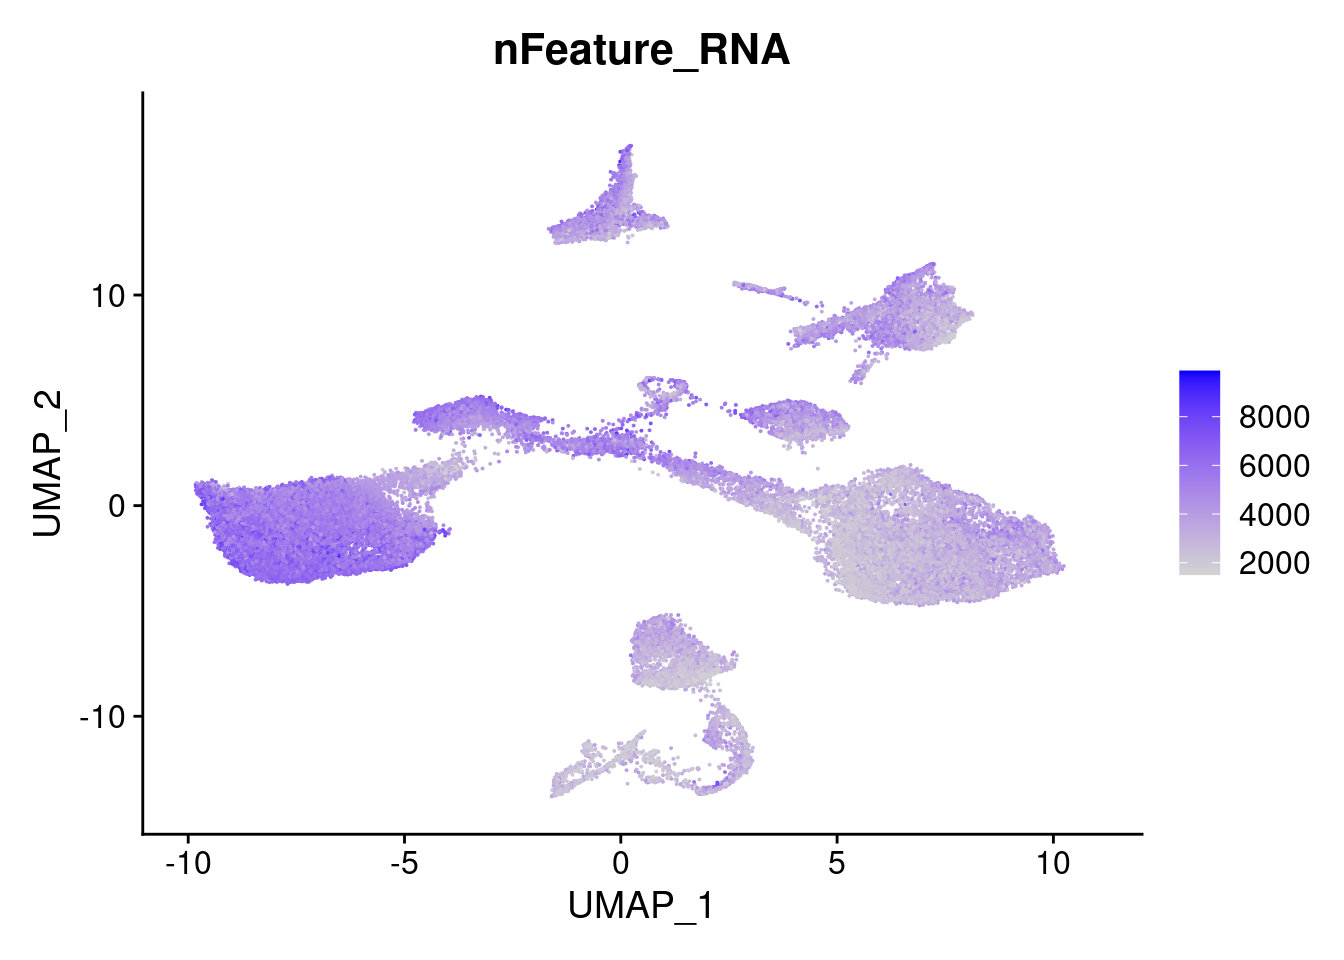
| Version | Author | Date |
|---|---|---|
| 421a225 | KLRhodes | 2020-08-10 |
head(merged)An object of class Seurat
2 features across 42488 samples within 2 assays
Active assay: SCT (1 features, 1 variable features)
1 other assay present: RNA
3 dimensional reductions calculated: pca, harmony, umapVlnPlot(merged, features= "nFeature_RNA", group.by = "SCT_snn_res.1", pt.size=0)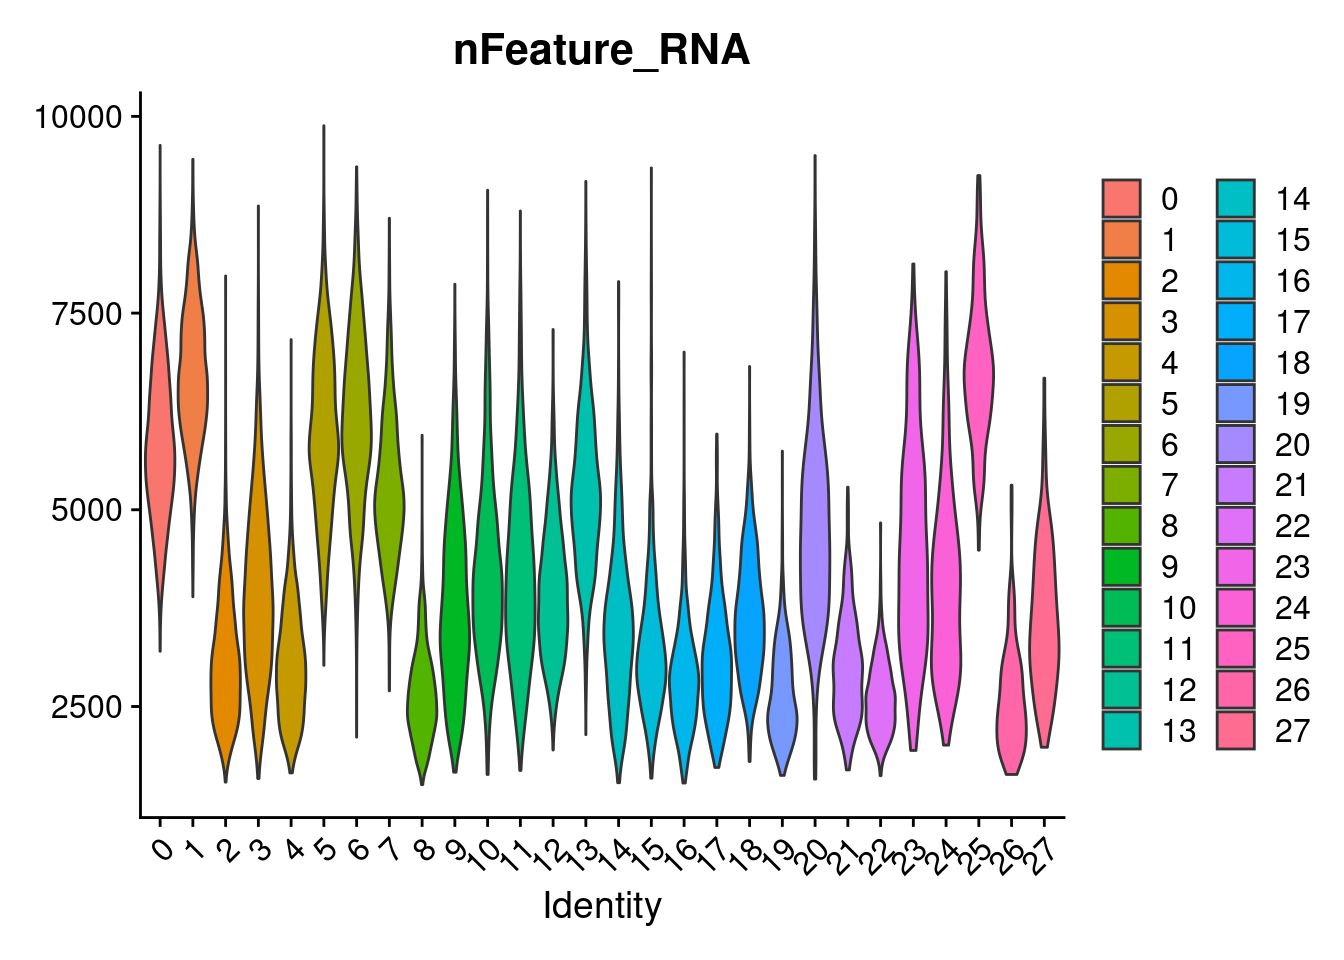
| Version | Author | Date |
|---|---|---|
| 421a225 | KLRhodes | 2020-08-10 |
FeaturePlot(merged, features = c("POU5F1", "SOX17", "HAND1", "PAX6"), pt.size = 0.2, ncol=2, combine=T)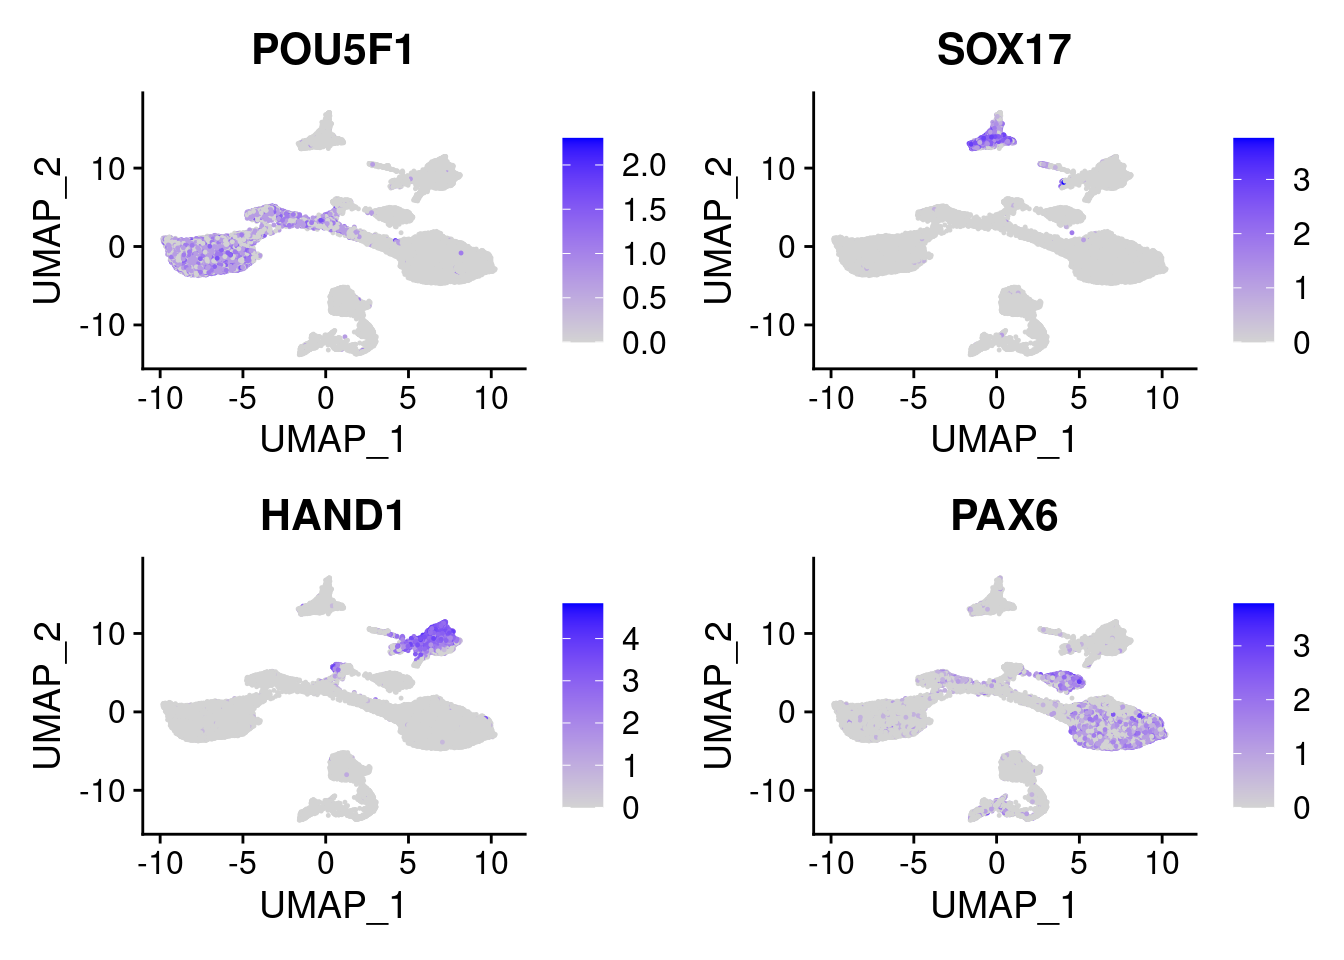
| Version | Author | Date |
|---|---|---|
| 421a225 | KLRhodes | 2020-08-10 |
FeaturePlot(merged, features = c("FGB", "ECSCR", "NEUROD1", "SOX10"), pt.size = 0.2, ncol=2)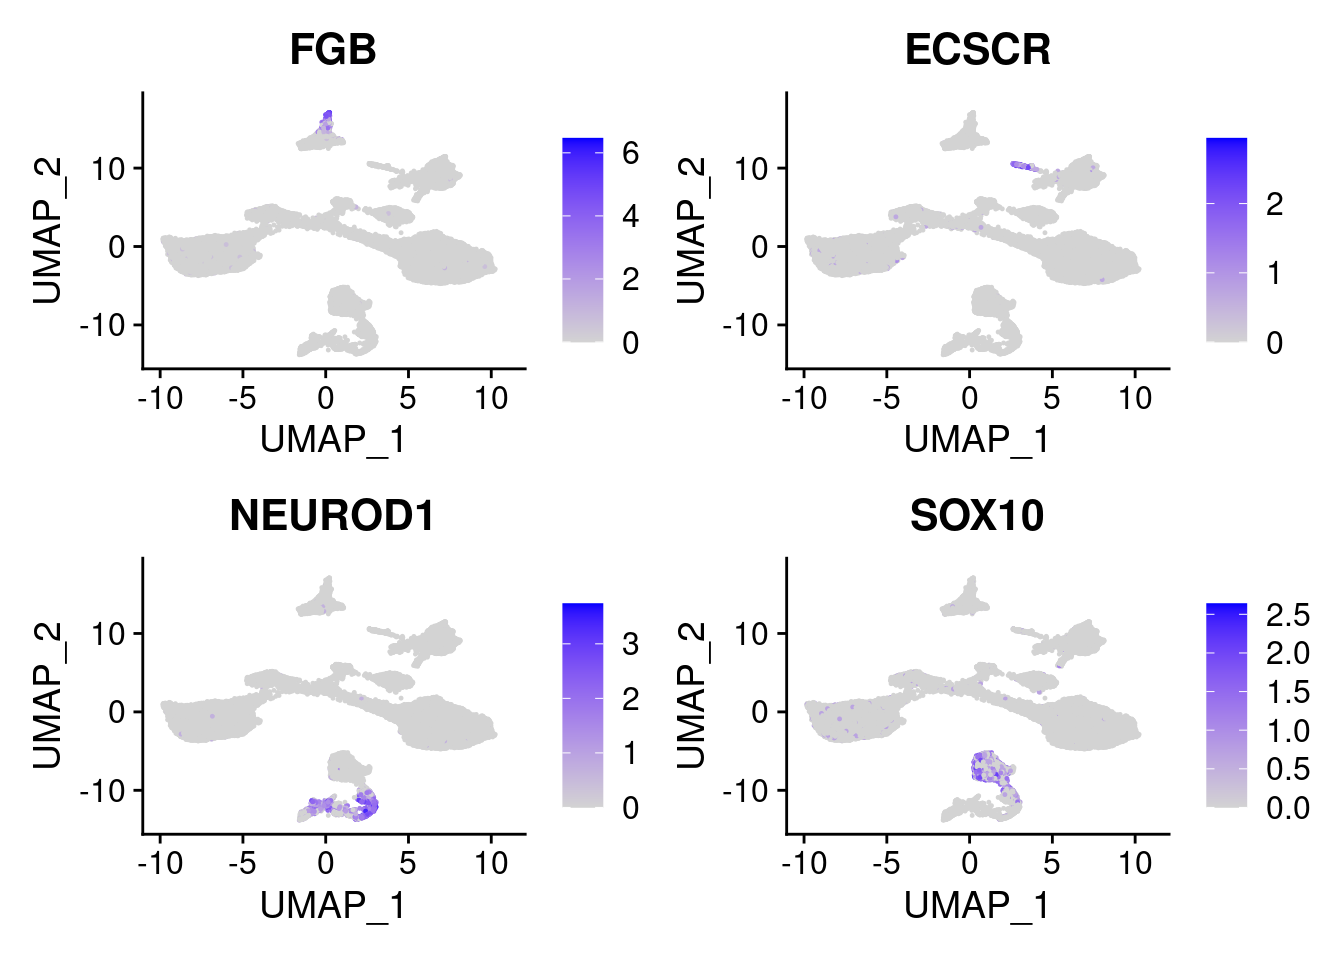
| Version | Author | Date |
|---|---|---|
| 421a225 | KLRhodes | 2020-08-10 |
sessionInfo()R version 3.6.1 (2019-07-05)
Platform: x86_64-pc-linux-gnu (64-bit)
Running under: Scientific Linux 7.4 (Nitrogen)
Matrix products: default
BLAS/LAPACK: /software/openblas-0.2.19-el7-x86_64/lib/libopenblas_haswellp-r0.2.19.so
locale:
[1] C
attached base packages:
[1] stats graphics grDevices utils datasets methods base
other attached packages:
[1] reshape2_1.4.4 RColorBrewer_1.1-2 here_0.1-11 DataCombine_0.2.21
[5] ggplot2_3.3.2 harmony_1.0 Rcpp_1.0.5 Seurat_3.2.0
[9] workflowr_1.6.2
loaded via a namespace (and not attached):
[1] Rtsne_0.15 colorspace_1.4-1 deldir_0.1-28
[4] ellipsis_0.3.1 ggridges_0.5.2 rprojroot_1.3-2
[7] fs_1.4.2 spatstat.data_1.4-3 farver_2.0.3
[10] leiden_0.3.3 listenv_0.8.0 npsurv_0.4-0
[13] ggrepel_0.8.2 RSpectra_0.16-0 codetools_0.2-16
[16] splines_3.6.1 lsei_1.2-0 knitr_1.29
[19] polyclip_1.10-0 jsonlite_1.7.0 ica_1.0-2
[22] cluster_2.1.0 png_0.1-7 uwot_0.1.8
[25] shiny_1.5.0 sctransform_0.2.1 compiler_3.6.1
[28] httr_1.4.2 backports_1.1.8 Matrix_1.2-18
[31] fastmap_1.0.1 lazyeval_0.2.2 later_1.1.0.1
[34] htmltools_0.5.0 tools_3.6.1 rsvd_1.0.3
[37] igraph_1.2.5 gtable_0.3.0 glue_1.4.1
[40] RANN_2.6.1 dplyr_1.0.0 rappdirs_0.3.1
[43] spatstat_1.64-1 vctrs_0.3.2 gdata_2.18.0
[46] ape_5.3 nlme_3.1-140 lmtest_0.9-37
[49] xfun_0.16 stringr_1.4.0 globals_0.12.5
[52] mime_0.9 miniUI_0.1.1.1 lifecycle_0.2.0
[55] irlba_2.3.3 gtools_3.8.2 goftest_1.2-2
[58] future_1.18.0 MASS_7.3-51.4 zoo_1.8-8
[61] scales_1.1.1 promises_1.1.1 spatstat.utils_1.17-0
[64] parallel_3.6.1 yaml_2.2.1 reticulate_1.16
[67] pbapply_1.4-2 gridExtra_2.3 rpart_4.1-15
[70] stringi_1.4.6 caTools_1.18.0 rlang_0.4.7
[73] pkgconfig_2.0.3 bitops_1.0-6 evaluate_0.14
[76] lattice_0.20-38 ROCR_1.0-7 purrr_0.3.4
[79] tensor_1.5 labeling_0.3 patchwork_1.0.1
[82] htmlwidgets_1.5.1 cowplot_1.0.0 tidyselect_1.1.0
[85] RcppAnnoy_0.0.16 plyr_1.8.6 magrittr_1.5
[88] R6_2.4.1 gplots_3.0.4 generics_0.0.2
[91] withr_2.2.0 pillar_1.4.6 whisker_0.4
[94] mgcv_1.8-28 fitdistrplus_1.0-14 survival_3.2-3
[97] abind_1.4-5 tibble_3.0.3 future.apply_1.6.0
[100] crayon_1.3.4 KernSmooth_2.23-15 plotly_4.9.2.1
[103] rmarkdown_2.3 grid_3.6.1 data.table_1.13.0
[106] git2r_0.26.1 digest_0.6.25 xtable_1.8-4
[109] tidyr_1.1.0 httpuv_1.5.4 munsell_0.5.0
[112] viridisLite_0.3.0