Integrate lanes from all batches of EB pilot (Human data only, no doublets
Last updated: 2020-08-10
Checks: 7 0
Knit directory: Embryoid_Body_Pilot_Workflowr/analysis/
This reproducible R Markdown analysis was created with workflowr (version 1.6.2). The Checks tab describes the reproducibility checks that were applied when the results were created. The Past versions tab lists the development history.
Great! Since the R Markdown file has been committed to the Git repository, you know the exact version of the code that produced these results.
Great job! The global environment was empty. Objects defined in the global environment can affect the analysis in your R Markdown file in unknown ways. For reproduciblity it’s best to always run the code in an empty environment.
The command set.seed(20200804) was run prior to running the code in the R Markdown file. Setting a seed ensures that any results that rely on randomness, e.g. subsampling or permutations, are reproducible.
Great job! Recording the operating system, R version, and package versions is critical for reproducibility.
Nice! There were no cached chunks for this analysis, so you can be confident that you successfully produced the results during this run.
Great job! Using relative paths to the files within your workflowr project makes it easier to run your code on other machines.
Great! You are using Git for version control. Tracking code development and connecting the code version to the results is critical for reproducibility.
The results in this page were generated with repository version f50ebd3. See the Past versions tab to see a history of the changes made to the R Markdown and HTML files.
Note that you need to be careful to ensure that all relevant files for the analysis have been committed to Git prior to generating the results (you can use wflow_publish or wflow_git_commit). workflowr only checks the R Markdown file, but you know if there are other scripts or data files that it depends on. Below is the status of the Git repository when the results were generated:
Ignored files:
    Ignored:    .Rhistory
    Ignored:    .Rproj.user/
    Ignored:    output/.Rhistory

Untracked files:
    Untracked:  analysis/child/
    Untracked:  code/EB.getHumanMetadata.Rmd
    Untracked:  figure/
    Untracked:  output/mergedObjects/
    Untracked:  output/sampleQCrds/

Unstaged changes:
    Modified:   .Rprofile
    Modified:   .gitattributes
    Modified:   .gitignore
    Modified:   Embryoid_Body_Pilot_Workflowr.Rproj
    Modified:   README.md
    Modified:   _workflowr.yml
    Modified:   analysis/_site.yml
    Modified:   analysis/about.Rmd
    Modified:   analysis/index.Rmd
    Modified:   analysis/license.Rmd
    Modified:   code/README.md
    Modified:   data/README.md
    Modified:   output/README.md
Note that any generated files, e.g. HTML, png, CSS, etc., are not included in this status report because it is ok for generated content to have uncommitted changes.
These are the previous versions of the repository in which changes were made to the R Markdown (analysis/IntegrateAnalysis.afterFilter.HarmonyBatchSampleIDindividual.Rmd) and HTML (docs/IntegrateAnalysis.afterFilter.HarmonyBatchSampleIDindividual.html) files. If you’ve configured a remote Git repository (see ?wflow_git_remote), click on the hyperlinks in the table below to view the files as they were in that past version.
| File | Version | Author | Date | Message |
|---|---|---|---|---|
| html | 421a225 | KLRhodes | 2020-08-10 | Build site. |
| Rmd | bc8ec6f | KLRhodes | 2020-08-10 | cleaning various versions of merging/intCurrent working directory |
library(Seurat)
library(harmony)
library(ggplot2)
library(DataCombine)
library(here)
library(RColorBrewer)
options(future.globals.maxSize= 15000*1024^2) #allow global exceeding 4Gb
Read in the files, add metadata, and create an object list
filelist<-list.files(here::here('output/sampleQCrds/'), full.names = T)
objectlist<- list()
for (i in 1:length(filelist)){
  rds<- readRDS(filelist[i])
  objectlist[i]<- rds

}
Warning in `[<-`(`*tmp*`, i, value = rds): implicit list embedding of S4 objects
is deprecated
Warning in `[<-`(`*tmp*`, i, value = rds): implicit list embedding of S4 objects
is deprecated
Warning in `[<-`(`*tmp*`, i, value = rds): implicit list embedding of S4 objects
is deprecated
Warning in `[<-`(`*tmp*`, i, value = rds): implicit list embedding of S4 objects
is deprecated
Warning in `[<-`(`*tmp*`, i, value = rds): implicit list embedding of S4 objects
is deprecated
Warning in `[<-`(`*tmp*`, i, value = rds): implicit list embedding of S4 objects
is deprecated
Warning in `[<-`(`*tmp*`, i, value = rds): implicit list embedding of S4 objects
is deprecated
Warning in `[<-`(`*tmp*`, i, value = rds): implicit list embedding of S4 objects
is deprecated
Warning in `[<-`(`*tmp*`, i, value = rds): implicit list embedding of S4 objects
is deprecated
Warning in `[<-`(`*tmp*`, i, value = rds): implicit list embedding of S4 objects
is deprecated
Warning in `[<-`(`*tmp*`, i, value = rds): implicit list embedding of S4 objects
is deprecated
Warning in `[<-`(`*tmp*`, i, value = rds): implicit list embedding of S4 objects
is deprecated
Warning in `[<-`(`*tmp*`, i, value = rds): implicit list embedding of S4 objects
is deprecated
Warning in `[<-`(`*tmp*`, i, value = rds): implicit list embedding of S4 objects
is deprecated
Warning in `[<-`(`*tmp*`, i, value = rds): implicit list embedding of S4 objects
is deprecated
Warning in `[<-`(`*tmp*`, i, value = rds): implicit list embedding of S4 objects
is deprecatedcreate a merged seurat object
ids<-substr(basename(filelist),1,12)
merged<- merge(objectlist[[1]], c(objectlist[[2]], objectlist[[3]],objectlist[[4]],objectlist[[5]],objectlist[[6]],objectlist[[7]],objectlist[[8]],objectlist[[9]],objectlist[[10]],objectlist[[11]],objectlist[[12]],objectlist[[13]],objectlist[[14]],objectlist[[15]],objectlist[[16]]),add.cell.ids=ids, merge.data=T)
#need to fix the individual names because they are slightly different from batch1
replacements<- data.frame(from= c("SNG-NA18511.variant2", "SNG-NA18858.variant2", "SNG-NA19160.variant2"), to=c("SNG-NA18511", "SNG-NA18858", "SNG-NA19160"))
merged@meta.data<-FindReplace(merged@meta.data, "individual", replacements, from = "from", to= "to", exact=T, vector=F )Only exact matches will be replaced.#run PCA on full dataset pre-alignment
all.genes= rownames(merged)
merged<-FindVariableFeatures(merged,selection.method="vst", nfeatures = 5000)
#have previously used all genes (nfeatures=25000) and clustering by individual rather than batch (based on proportion of cells per cluster) was still observed downstream. Now using 5000 because it is the upper bound of what has been recommended in the literature.
merged<- ScaleData(merged, features = all.genes)Centering and scaling data matrixmerged<-RunPCA(merged, npcs = 100, verbose=F)DimPlot(merged, reduction = "pca", group.by = "Batch")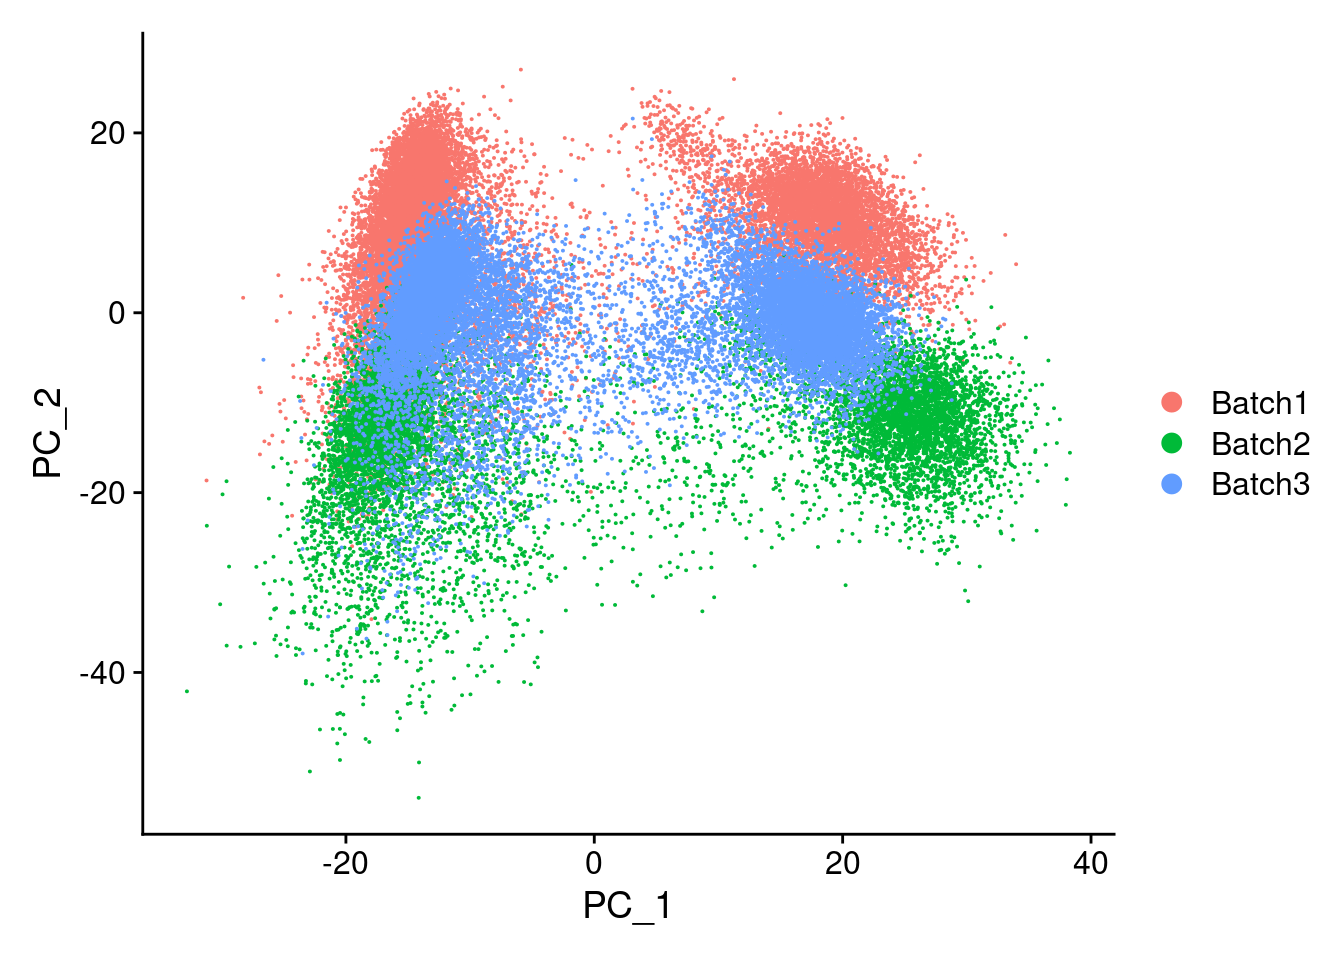
| Version | Author | Date |
|---|---|---|
| 421a225 | KLRhodes | 2020-08-10 |
Now, running harmony to integrate. Here, using Batch, SampleID(10x Lane), and individual to integrate. Since Batch and Lane are confounded, this may over correct for Batch.
merged<- RunHarmony(merged, c("Batch", "SampleID", "individual"), plot_convergence = T, assay.use = "SCT")Harmony 1/10Harmony 2/10Harmony 3/10Harmony 4/10Harmony 5/10Harmony 6/10Harmony 7/10Harmony converged after 7 iterationsWarning: Invalid name supplied, making object name syntactically valid. New
object name is Seurat..ProjectDim.SCT.harmony; see ?make.names for more details
on syntax validity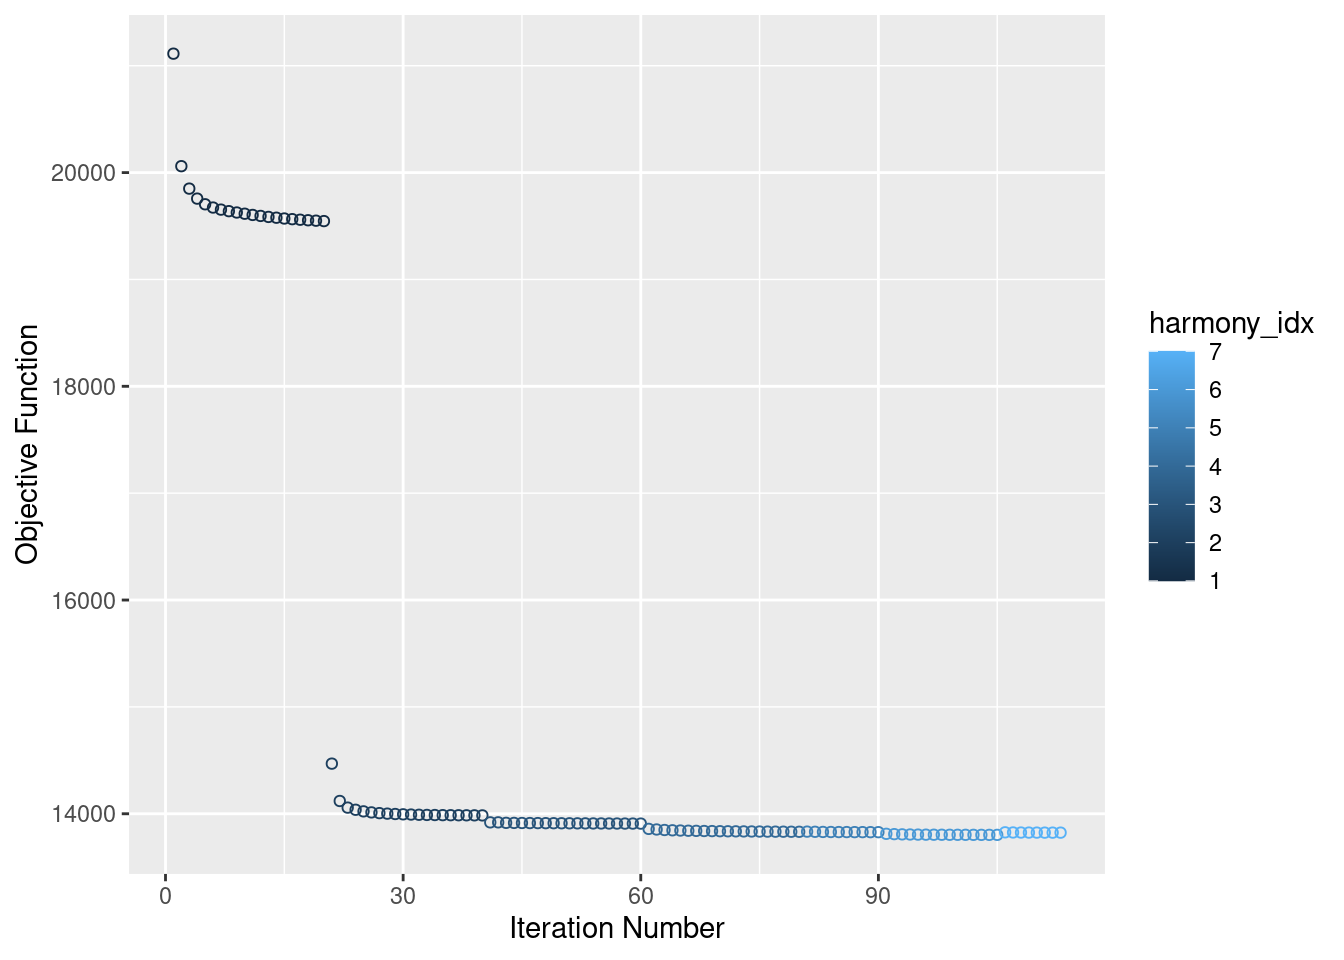
| Version | Author | Date |
|---|---|---|
| 421a225 | KLRhodes | 2020-08-10 |
Visualize Harmony embeddings
DimPlot(merged, reduction="harmony", group.by= c("individual", "Batch"), combine=F)[[1]]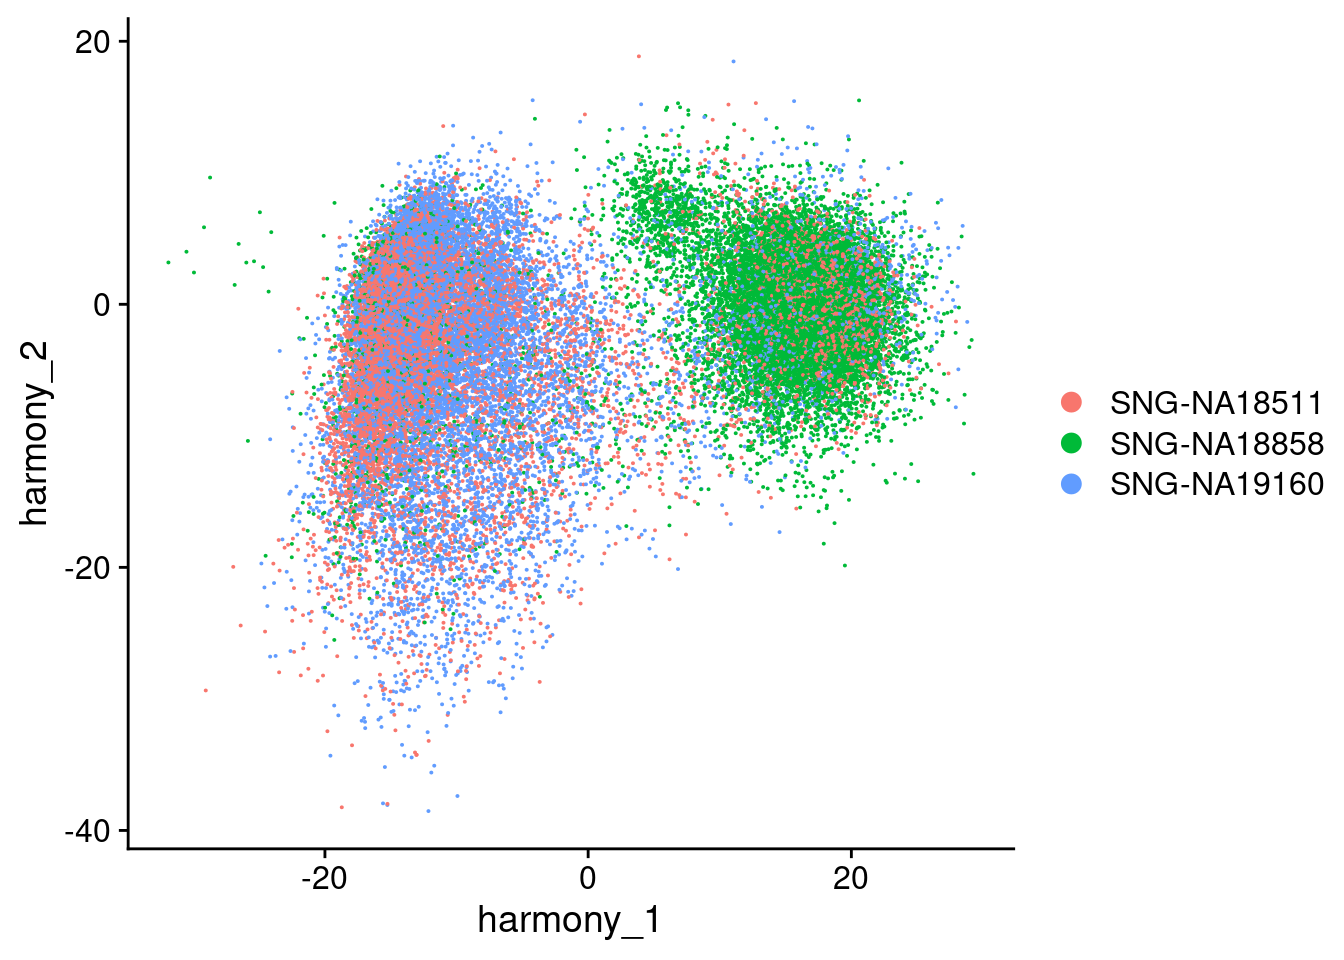
| Version | Author | Date |
|---|---|---|
| 421a225 | KLRhodes | 2020-08-10 |
[[2]]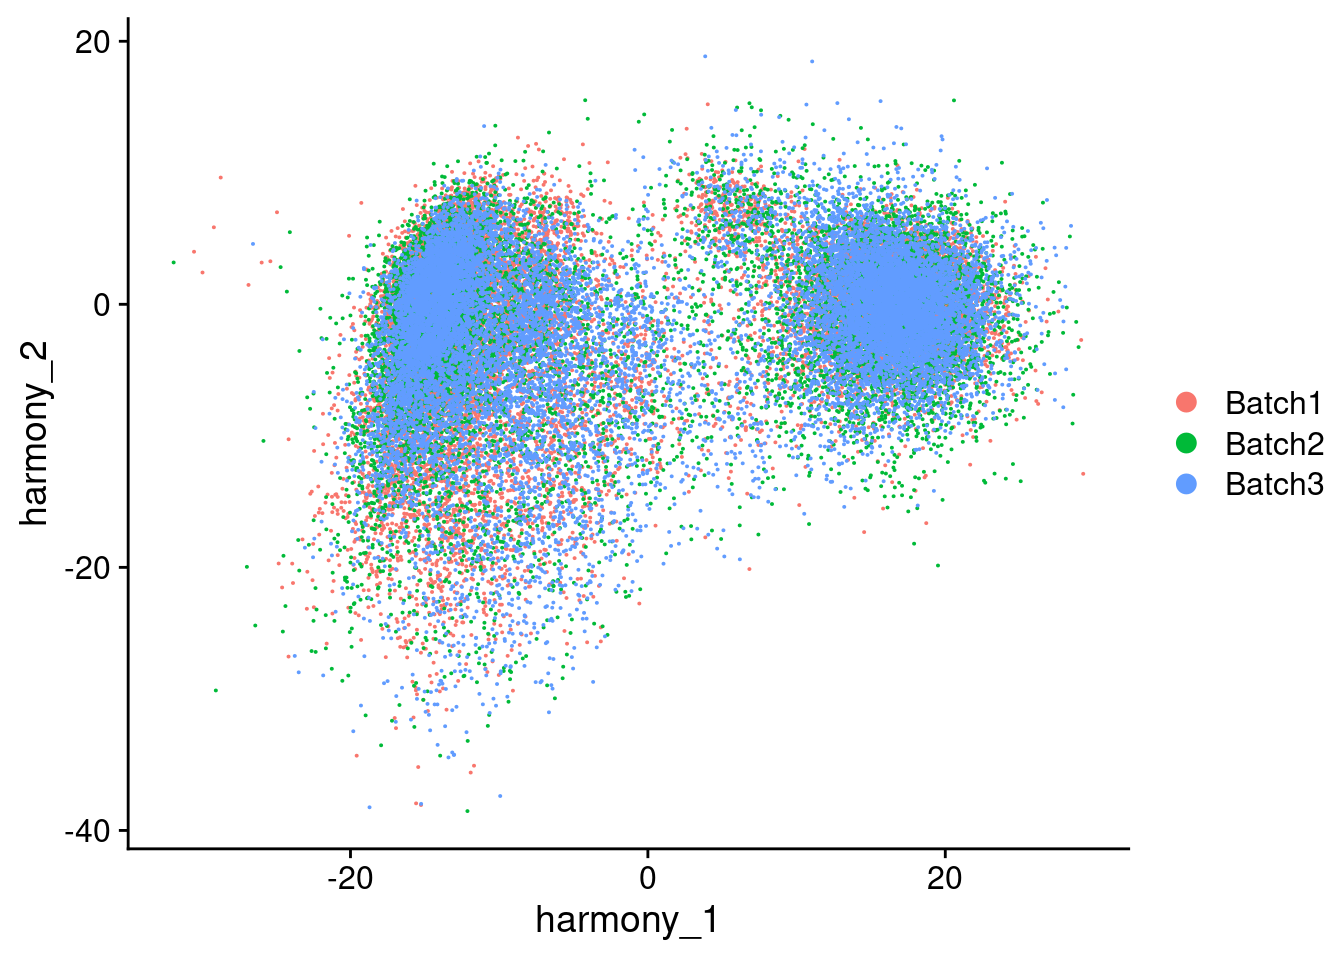
| Version | Author | Date |
|---|---|---|
| 421a225 | KLRhodes | 2020-08-10 |
Now Running UMAP and identifying clusters, etc
merged<- RunUMAP(merged, reduction = "harmony", dims = 1:100, verbose = F)Warning: The default method for RunUMAP has changed from calling Python UMAP via reticulate to the R-native UWOT using the cosine metric
To use Python UMAP via reticulate, set umap.method to 'umap-learn' and metric to 'correlation'
This message will be shown once per sessionmerged<- FindNeighbors(merged, reduction="harmony", dims = 1:100, verbose = F)
merged<- FindClusters(merged, resolution=1, verbose = F)
merged<- FindClusters(merged, resolution=0.8, verbose = F)
merged<- FindClusters(merged, resolution=0.5, verbose = F)
merged<- FindClusters(merged, resolution=0.1, verbose = F)SAVING merged/aligned/reclustered object
path<- here::here("output/mergedObjects/")
saveRDS(merged, file=paste0(path,'Harmony.BatchSampleIDindividual.rds'))
#reassign idents
Idents(merged)<- 'SCT_snn_res.1'VizDimLoadings(merged, dims = 1:2, reduction = "harmony")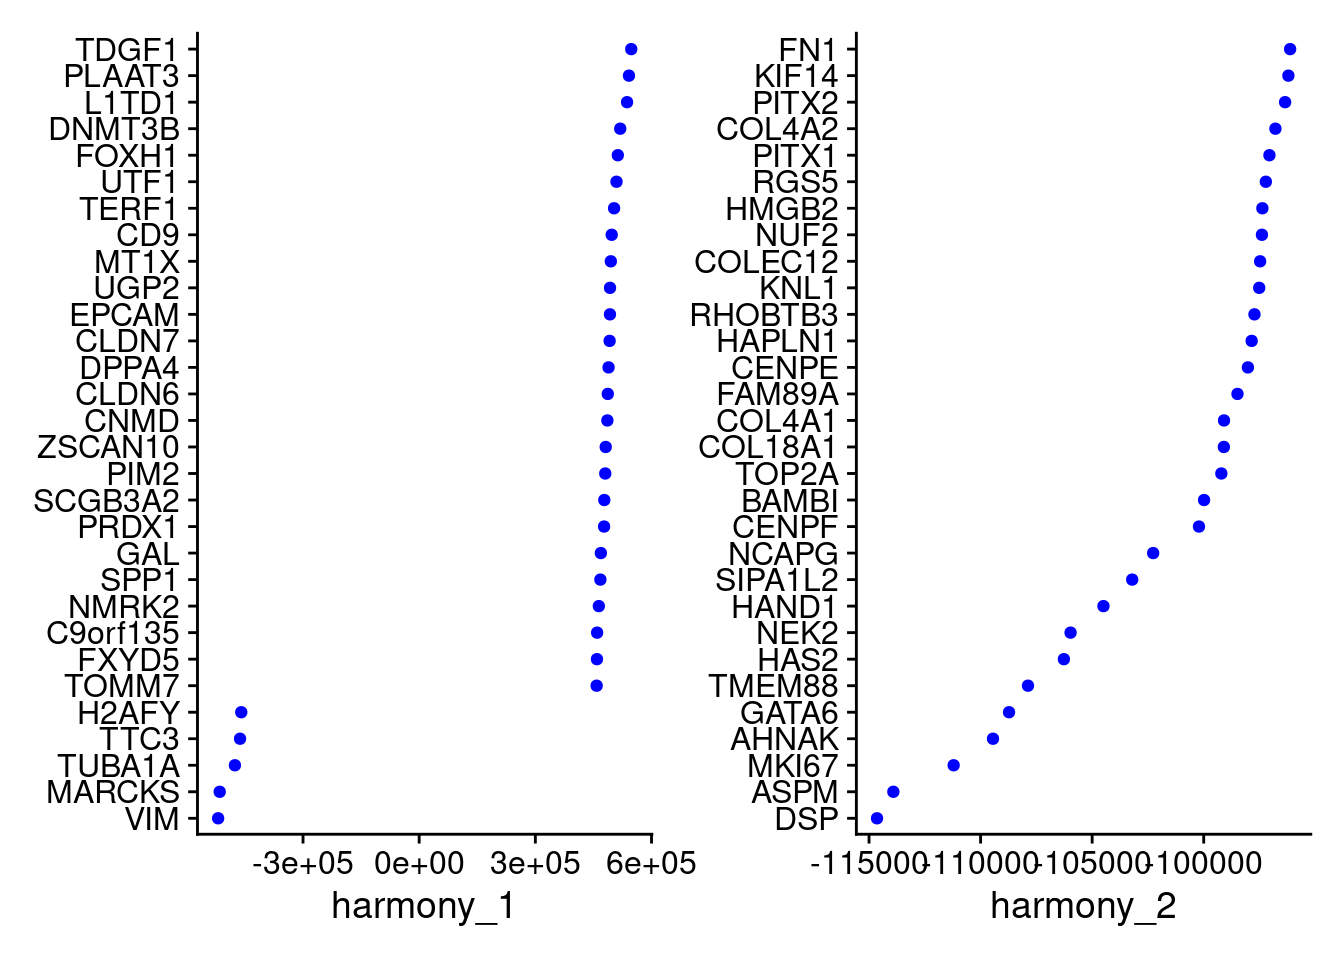
| Version | Author | Date |
|---|---|---|
| 421a225 | KLRhodes | 2020-08-10 |
VizDimLoadings(merged, dims = 3:4, reduction = "harmony")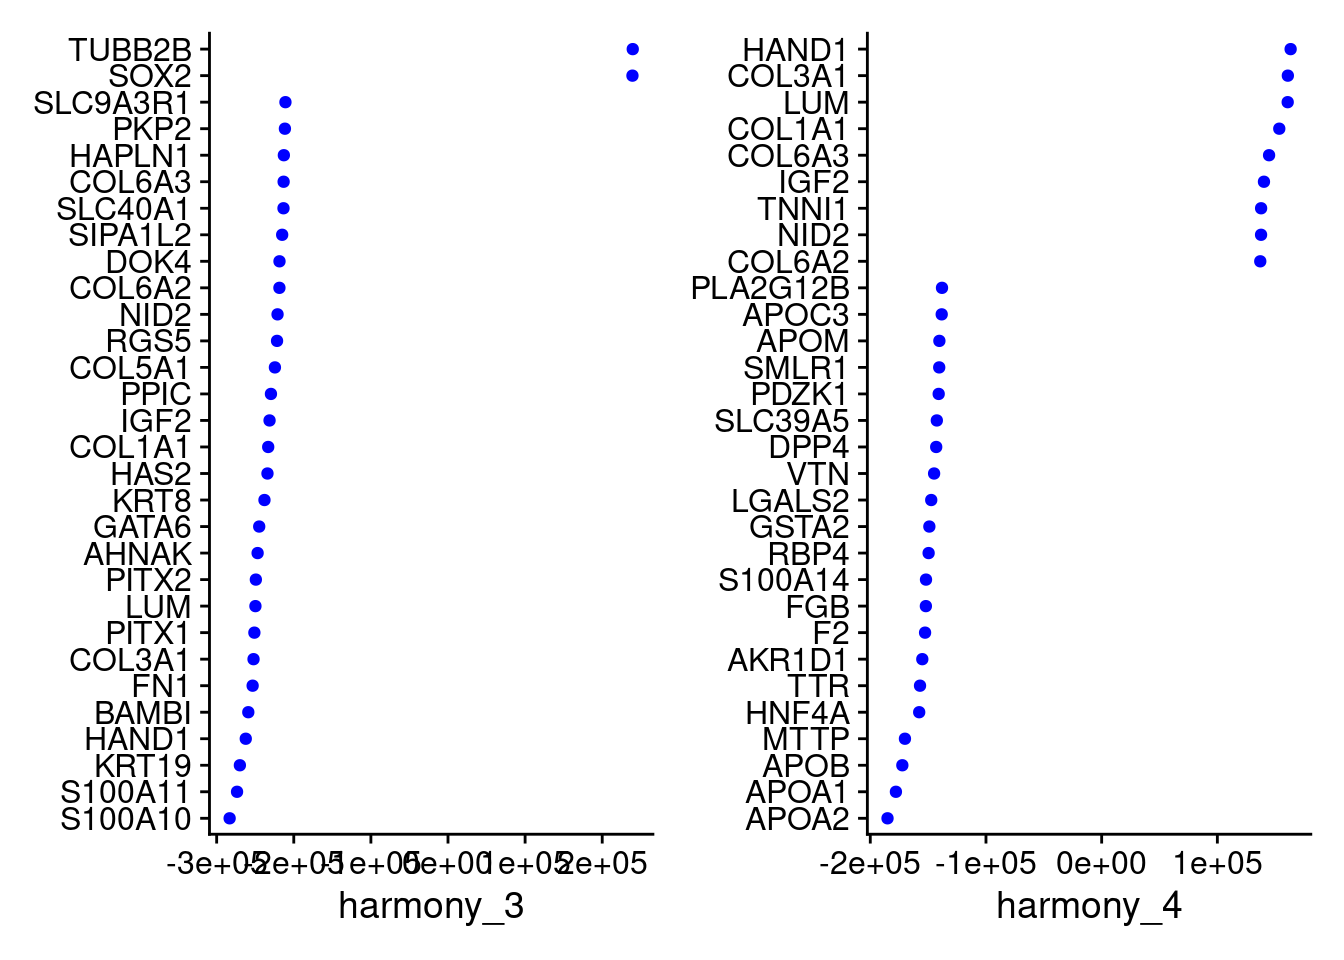
| Version | Author | Date |
|---|---|---|
| 421a225 | KLRhodes | 2020-08-10 |
VizDimLoadings(merged, dims = 5:6, reduction = "harmony")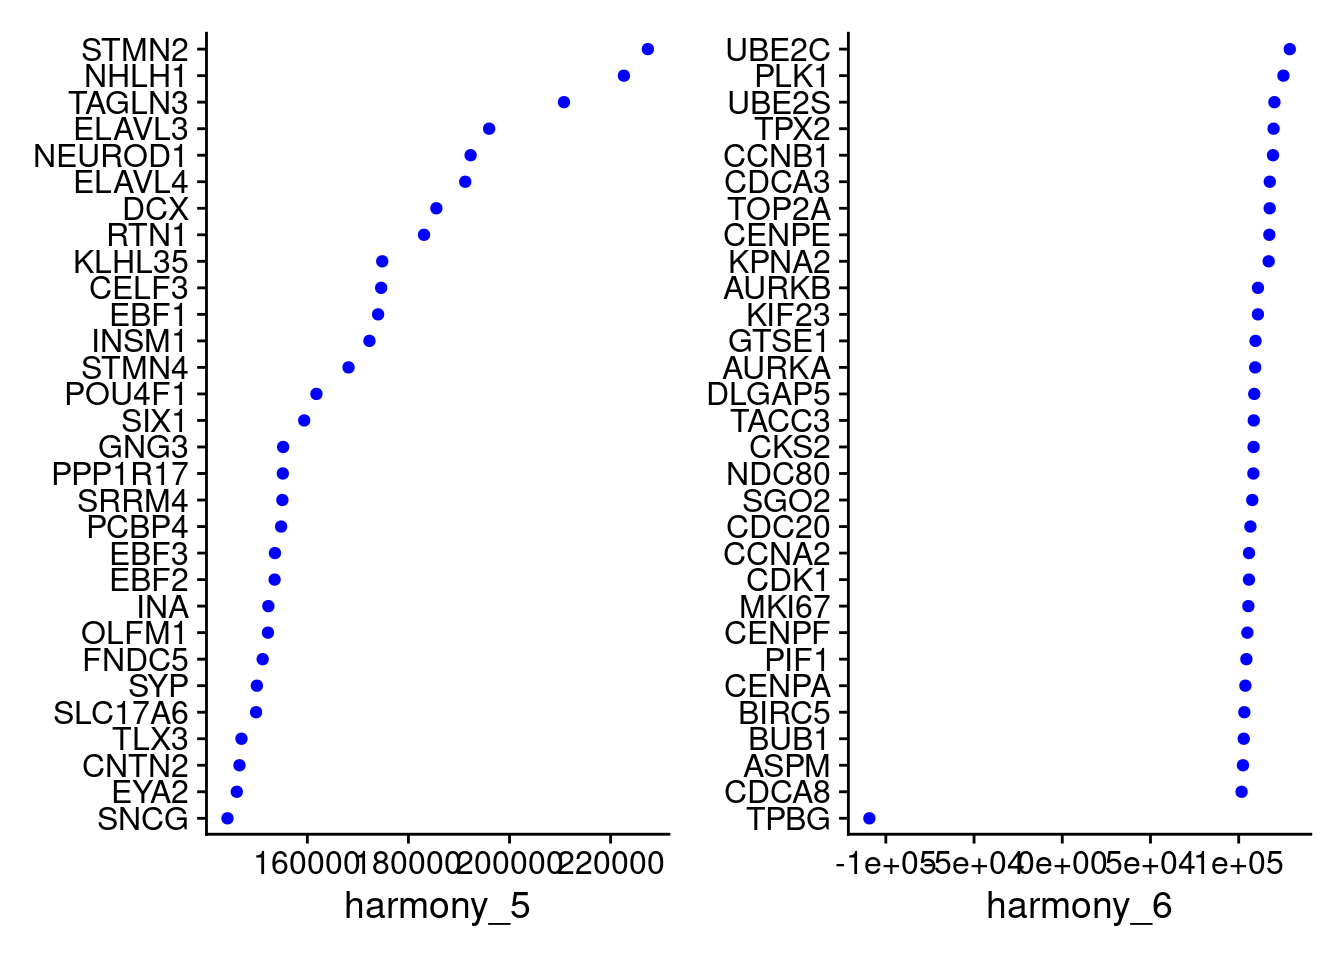
| Version | Author | Date |
|---|---|---|
| 421a225 | KLRhodes | 2020-08-10 |
xlim <- c(min(merged@reductions$harmony@cell.embeddings[,'harmony_1']),
max(merged@reductions$harmony@cell.embeddings[,'harmony_1']))
ylim <- c(min(merged@reductions$harmony@cell.embeddings[,'harmony_2']),
max(merged@reductions$harmony@cell.embeddings[,'harmony_2']))
individuals <- table(merged$individual)
individuals <- individuals[individuals>50]
individuals <- names(individuals)
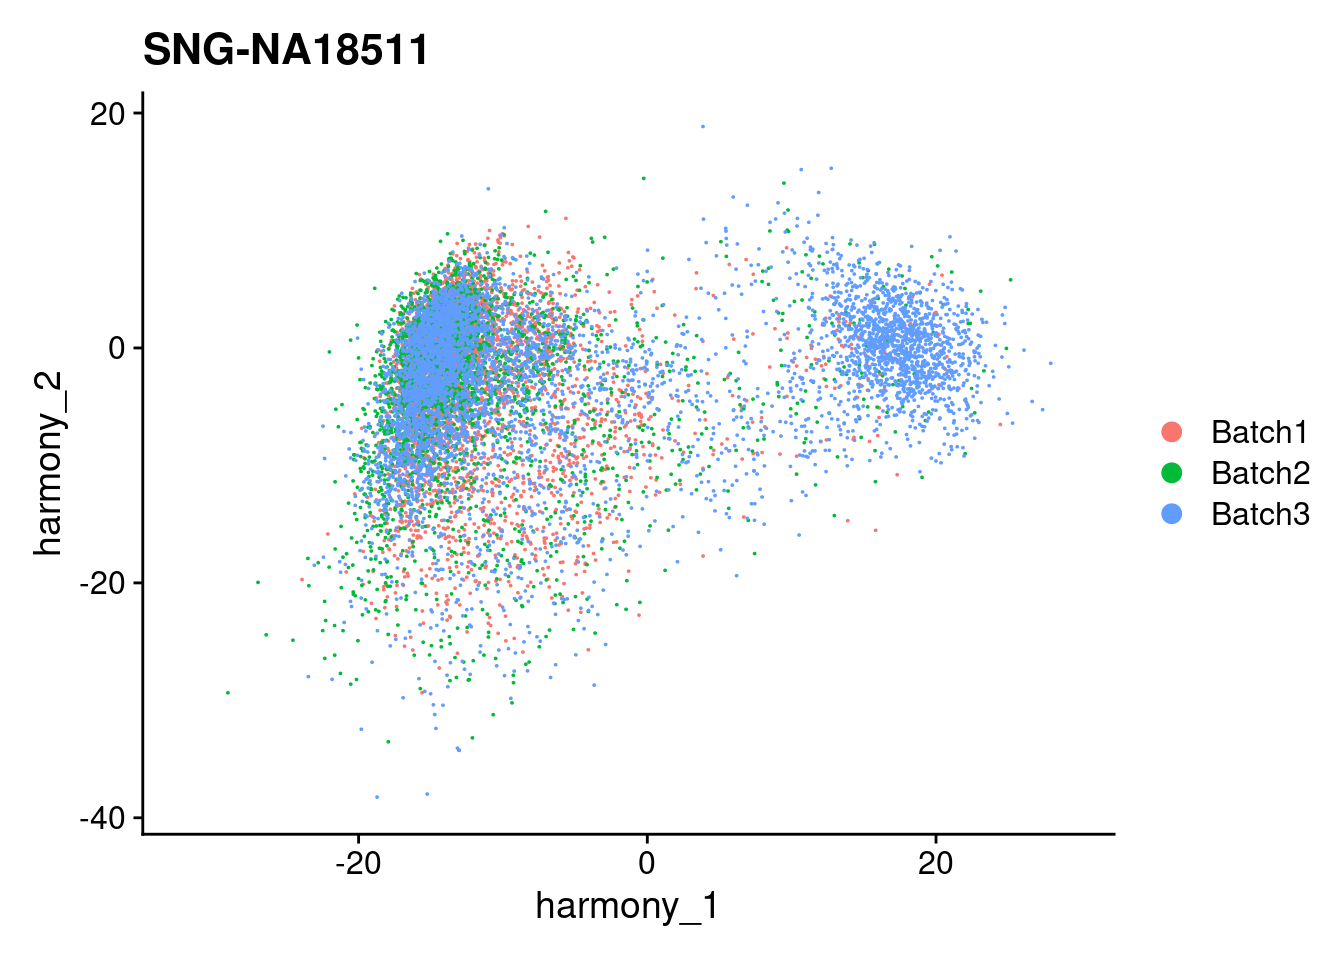
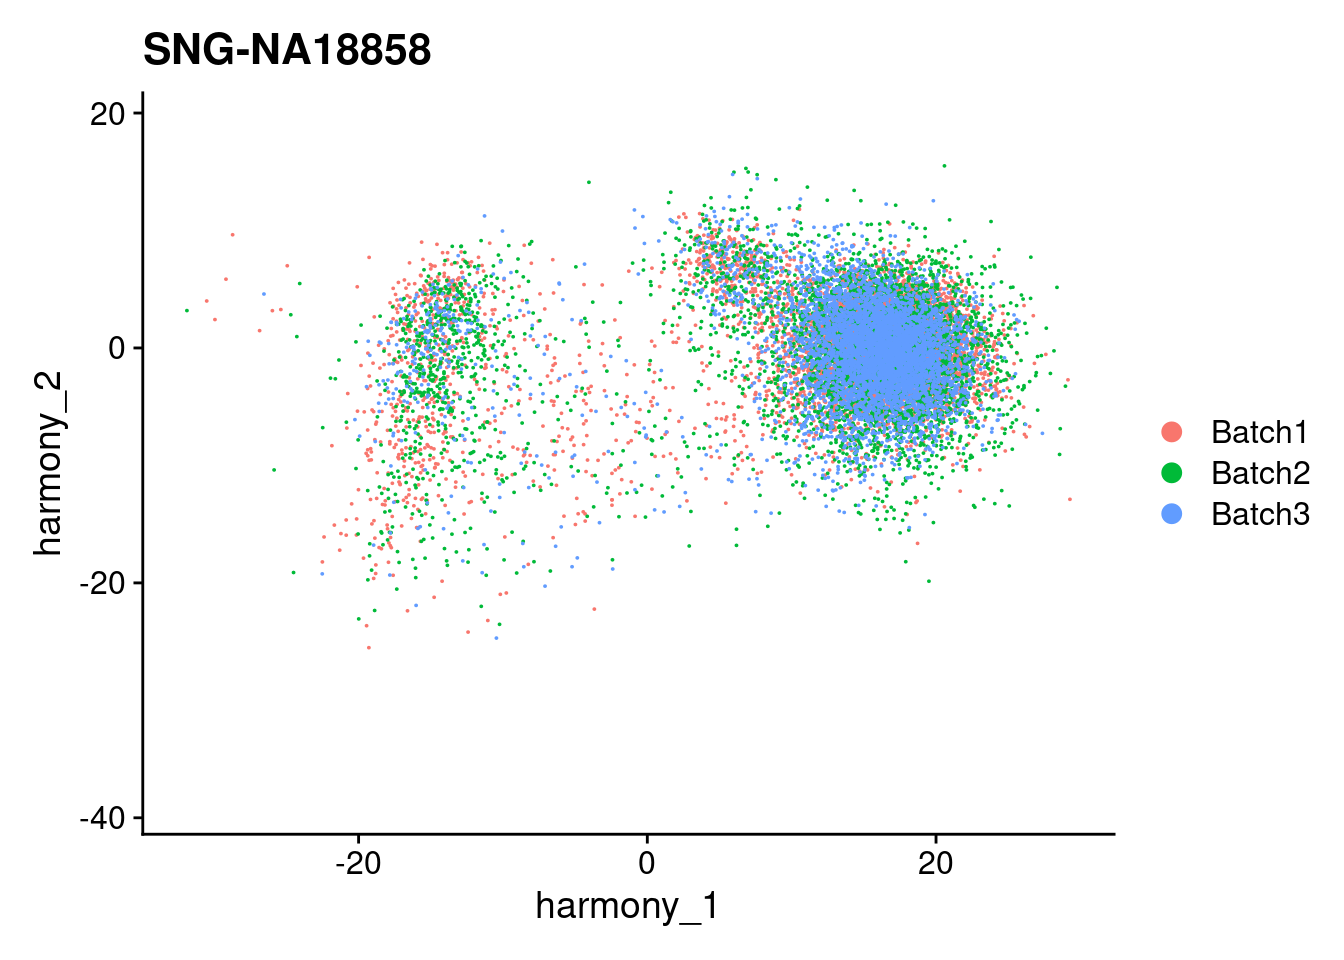
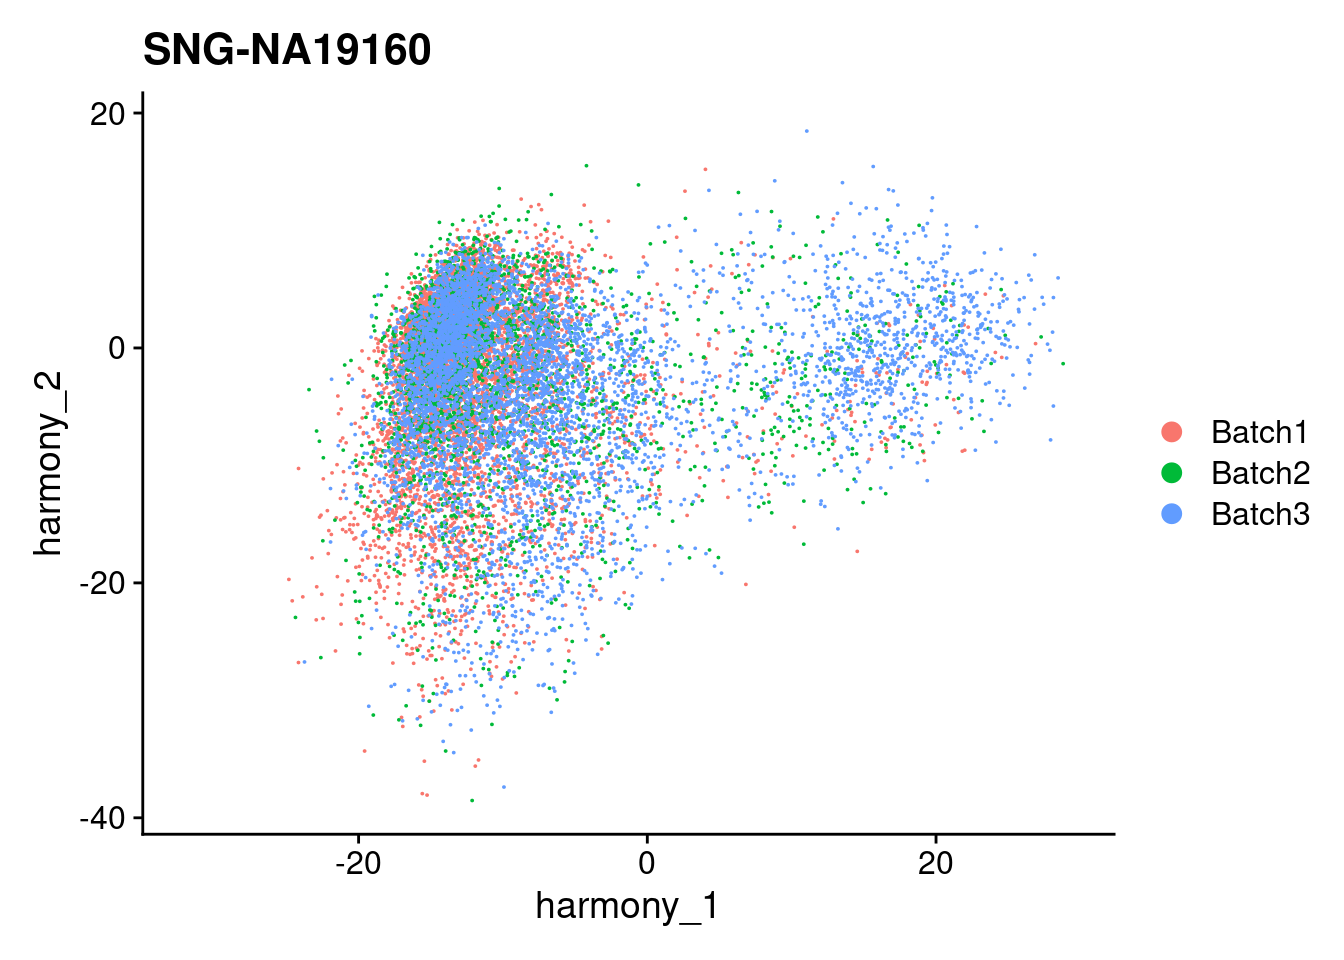
for (i in individuals)
{
print(DimPlot(merged, reduction = "harmony", group.by = c("Batch"), pt.size = 0.01,
cells = WhichCells(merged, expression = individual == i)) +
xlim(xlim) + ylim(ylim) + ggtitle(i))
}
| Version | Author | Date |
|---|---|---|
| 421a225 | KLRhodes | 2020-08-10 |
| Version | Author | Date |
|---|---|---|
| 421a225 | KLRhodes | 2020-08-10 |
| Version | Author | Date |
|---|---|---|
| 421a225 | KLRhodes | 2020-08-10 |
DimPlot(merged, reduction = "umap")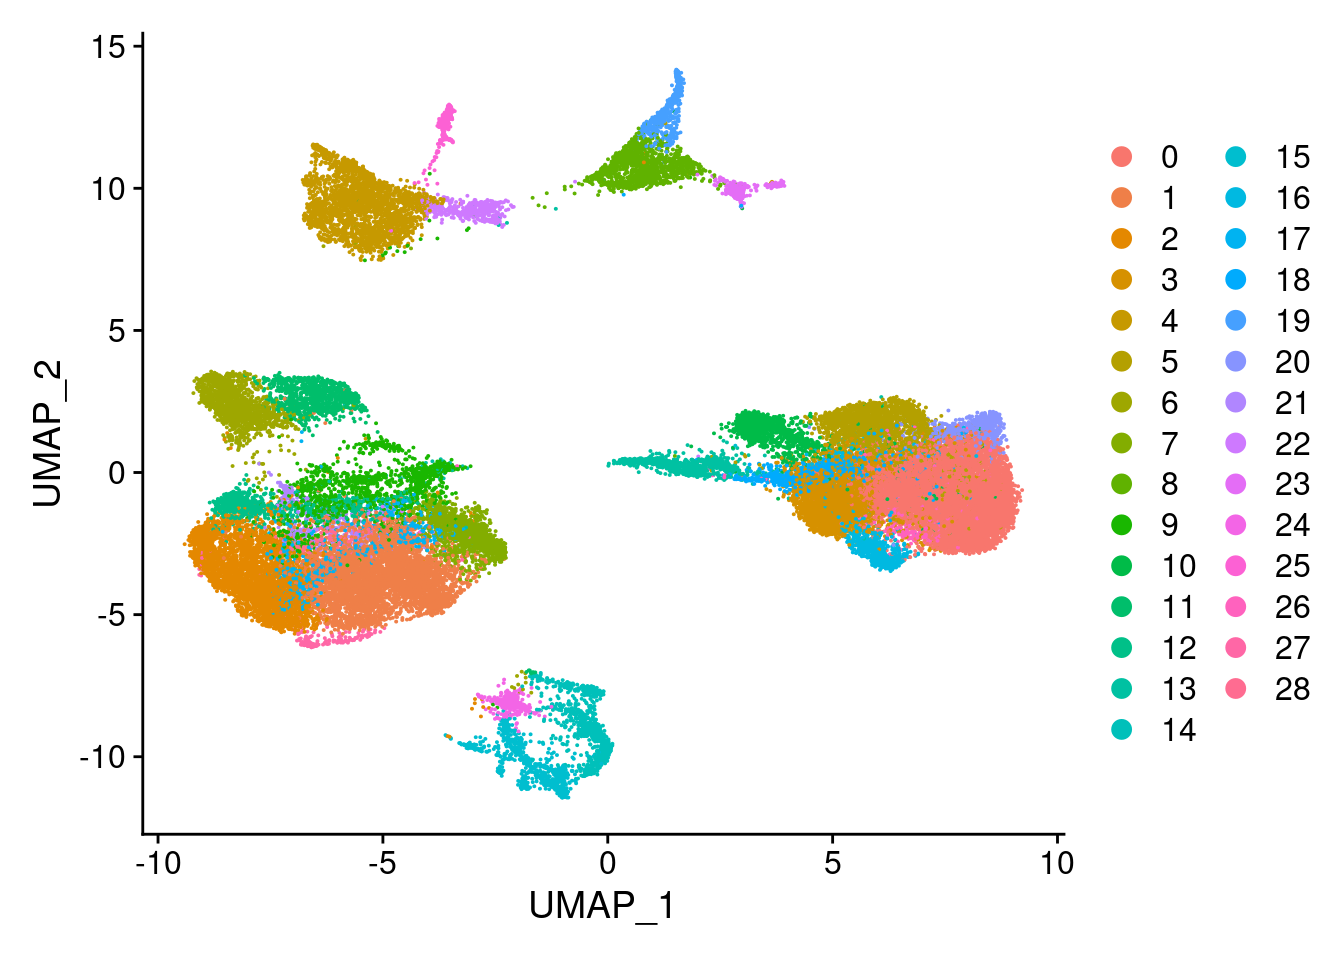
| Version | Author | Date |
|---|---|---|
| 421a225 | KLRhodes | 2020-08-10 |
DimPlot(merged, reduction = "umap", group.by = "Batch")
| Version | Author | Date |
|---|---|---|
| 421a225 | KLRhodes | 2020-08-10 |
DimPlot(merged, reduction = "umap", group.by = "individual")
| Version | Author | Date |
|---|---|---|
| 421a225 | KLRhodes | 2020-08-10 |
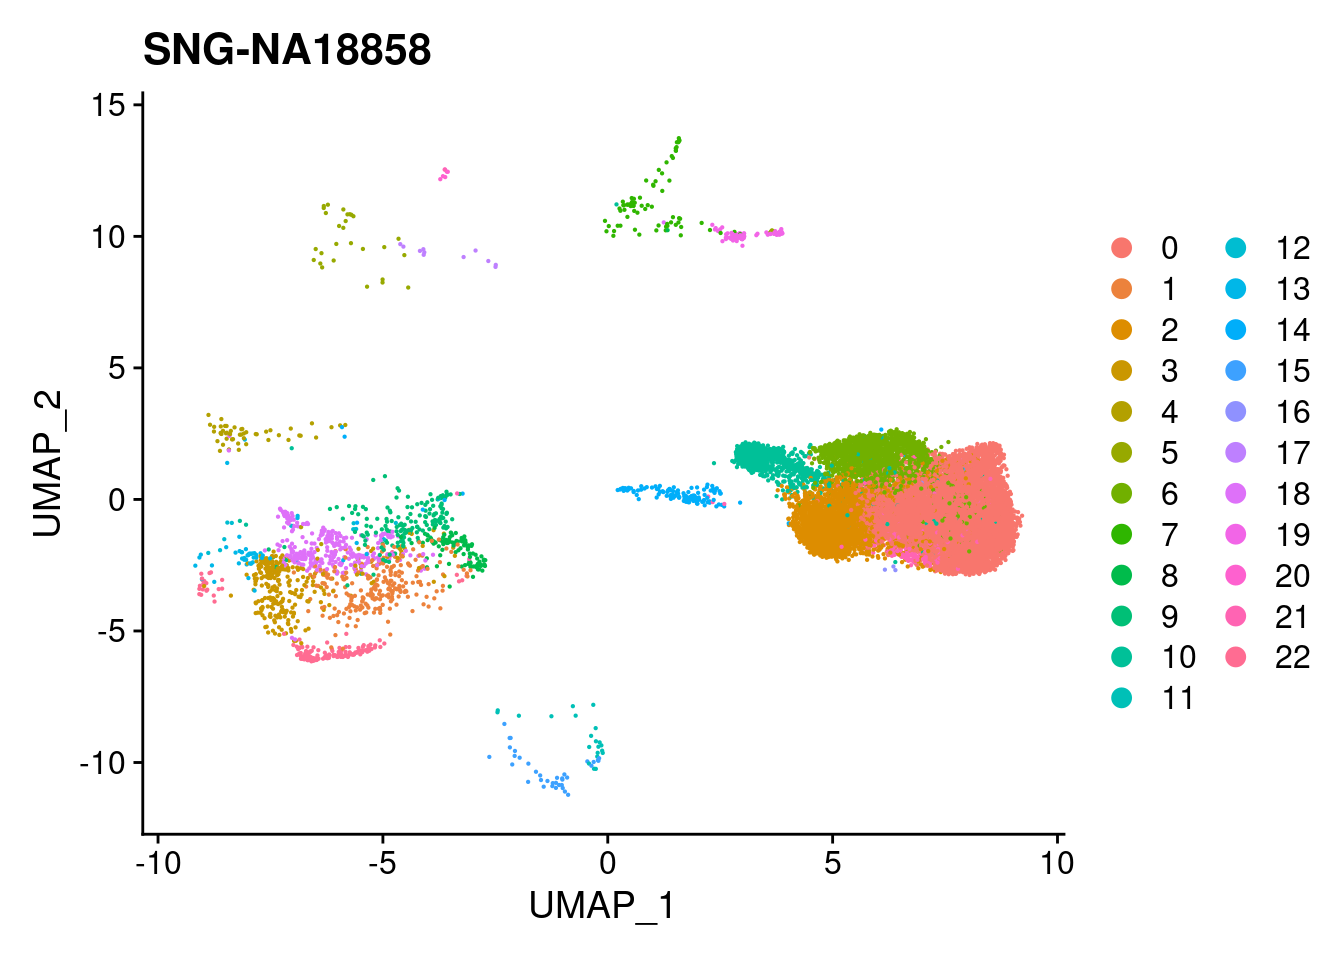
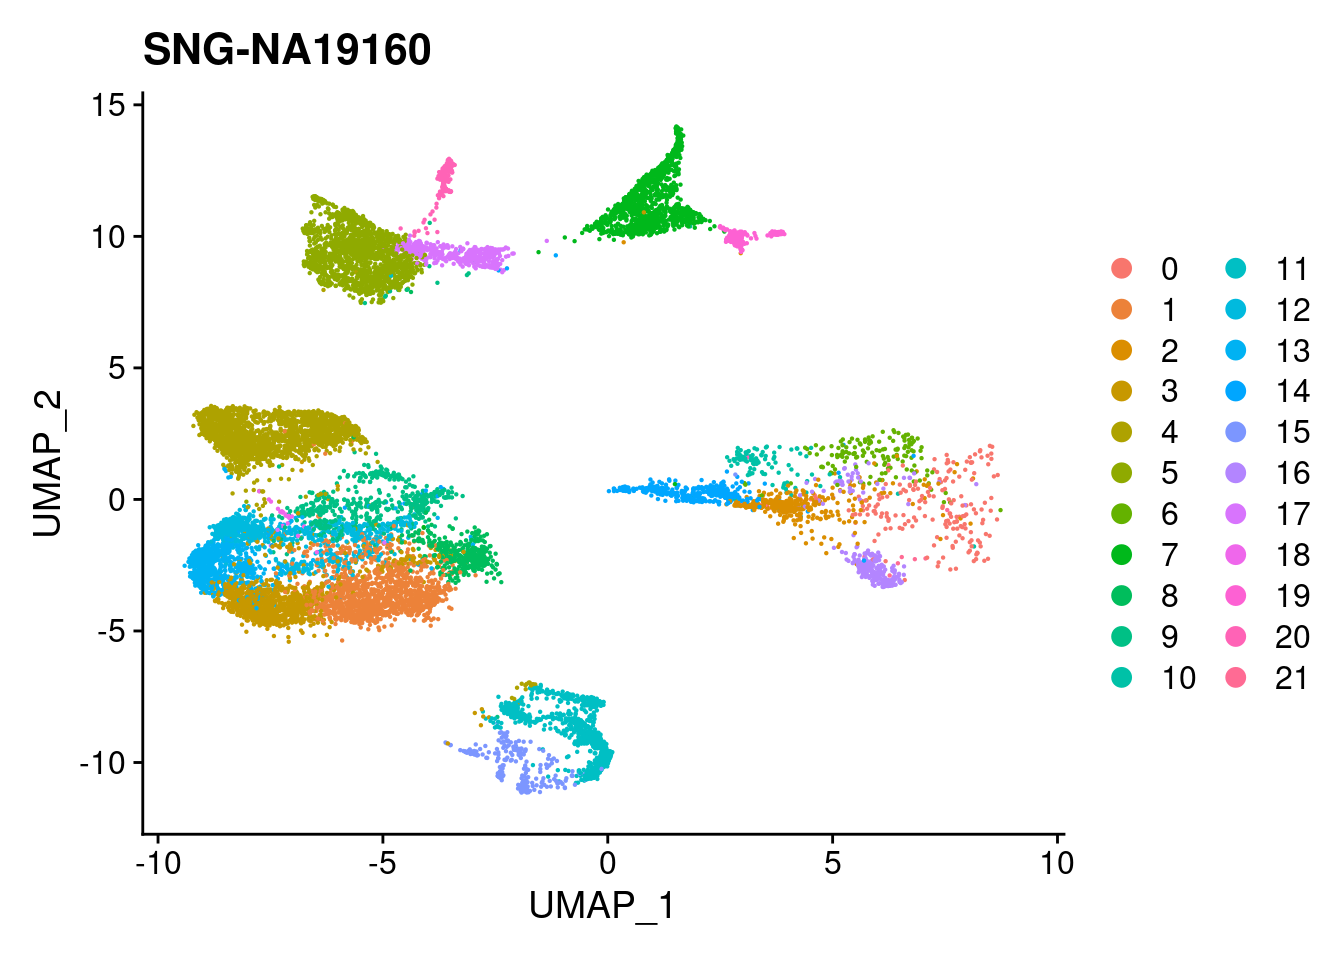
xlim <- c(min(merged@reductions$umap@cell.embeddings[,'UMAP_1']),
max(merged@reductions$umap@cell.embeddings[,'UMAP_1']))
ylim <- c(min(merged@reductions$umap@cell.embeddings[,'UMAP_2']),
max(merged@reductions$umap@cell.embeddings[,'UMAP_2']))
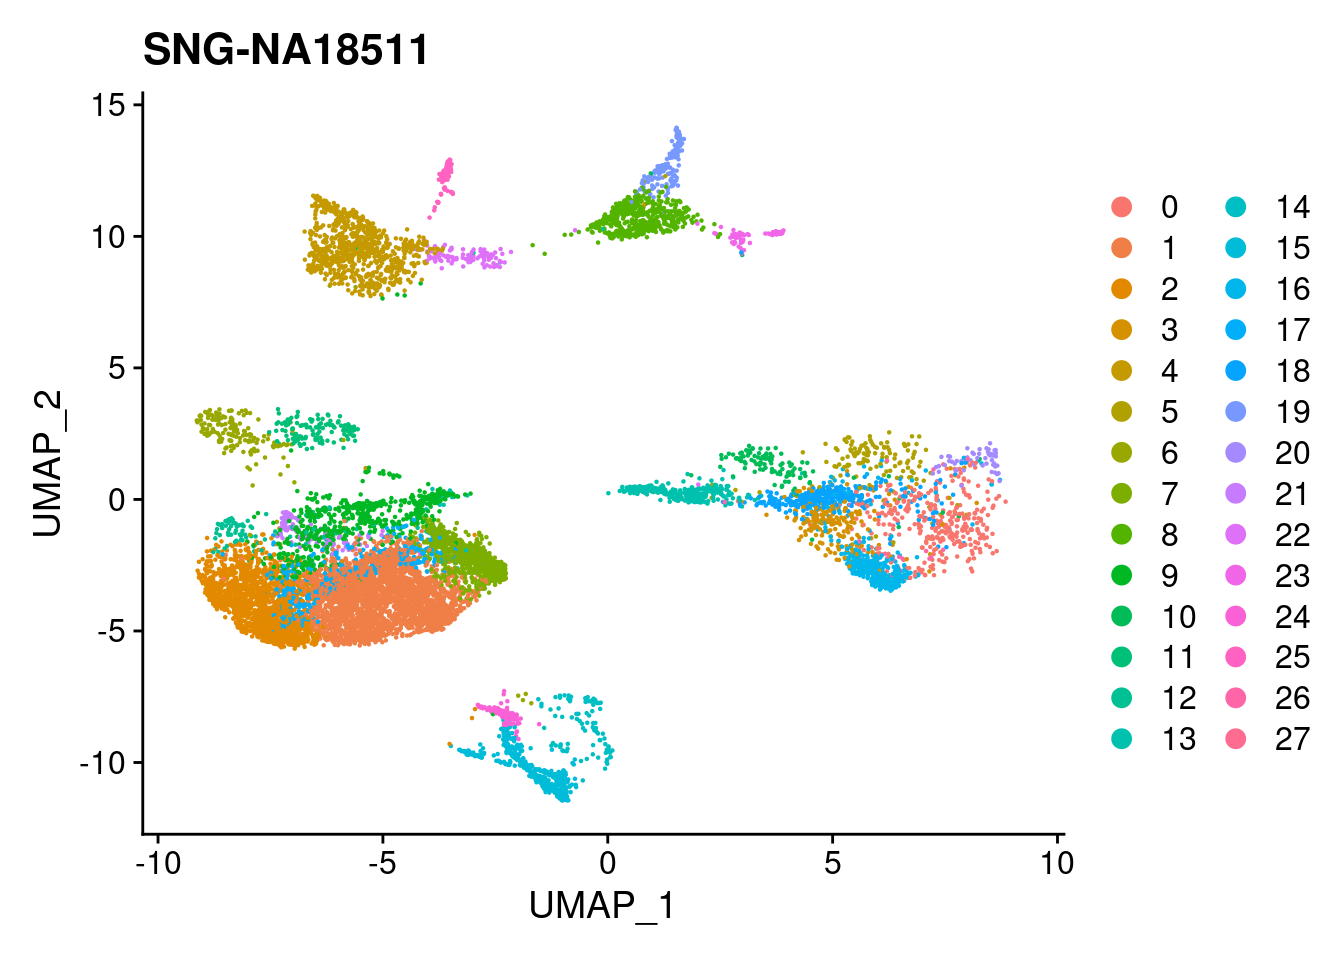
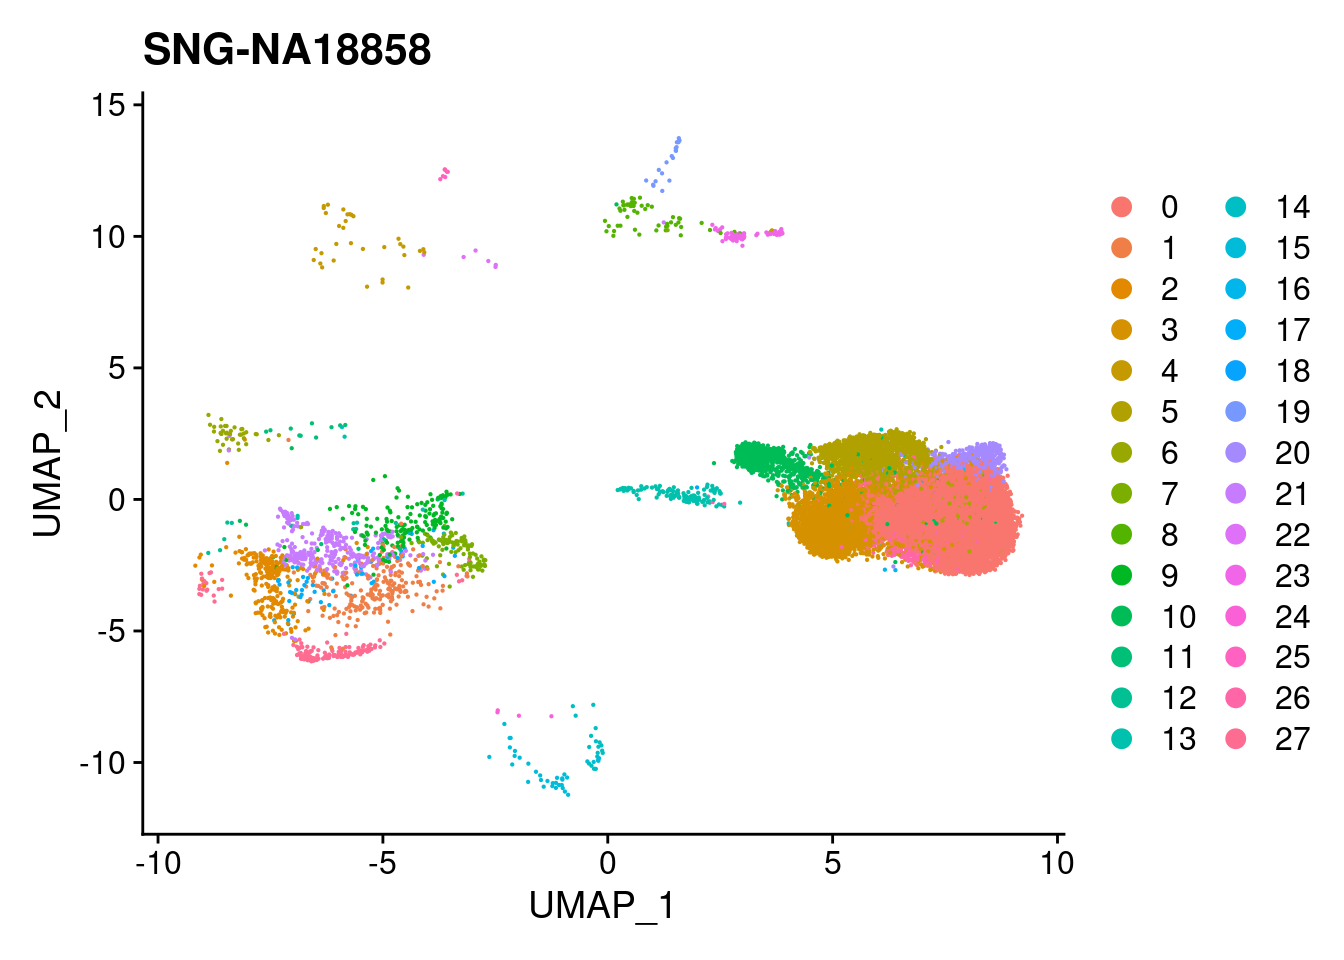
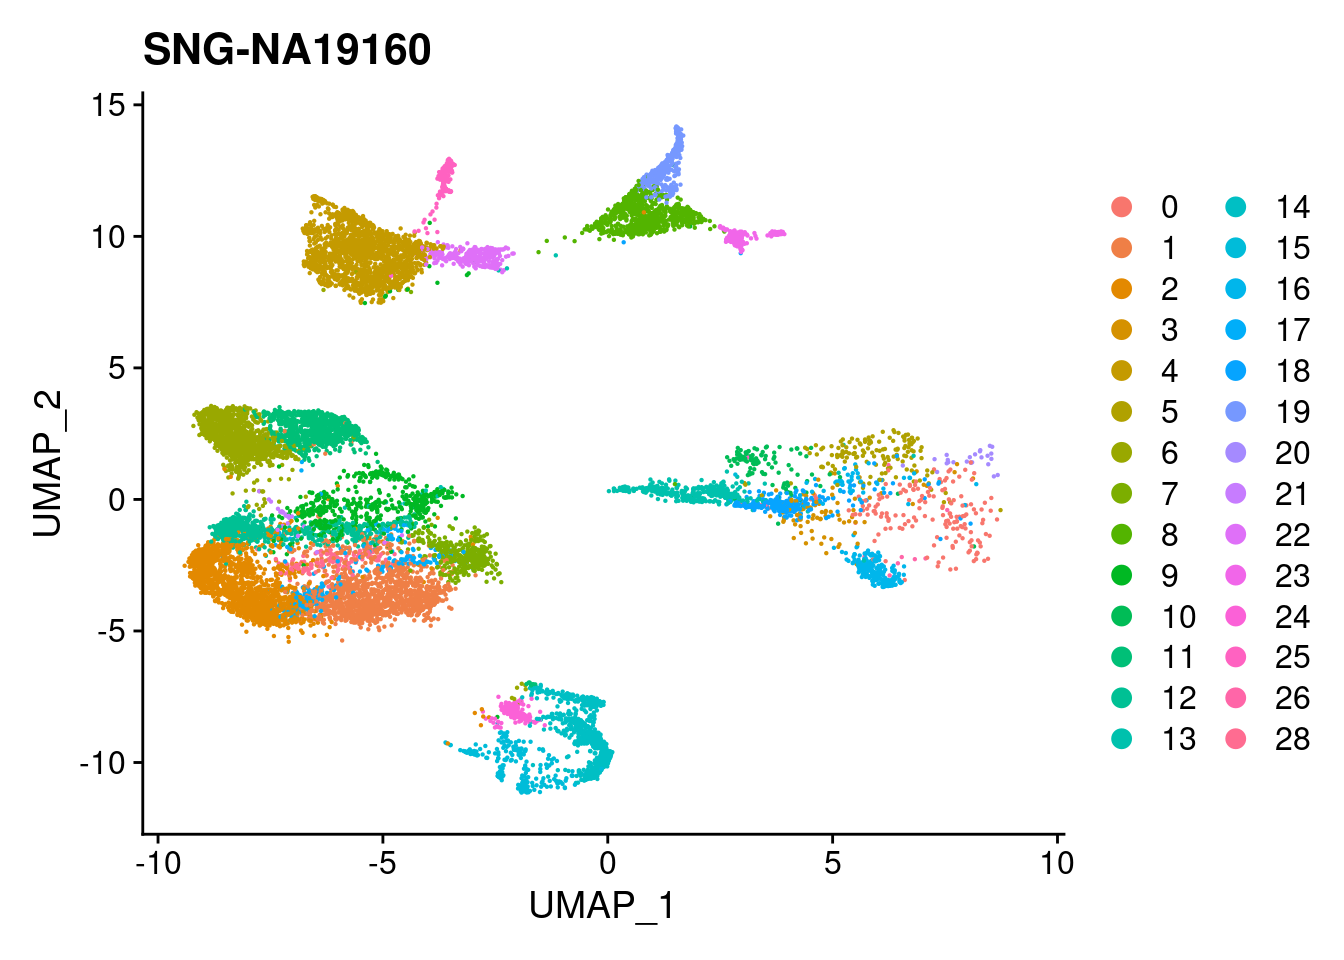
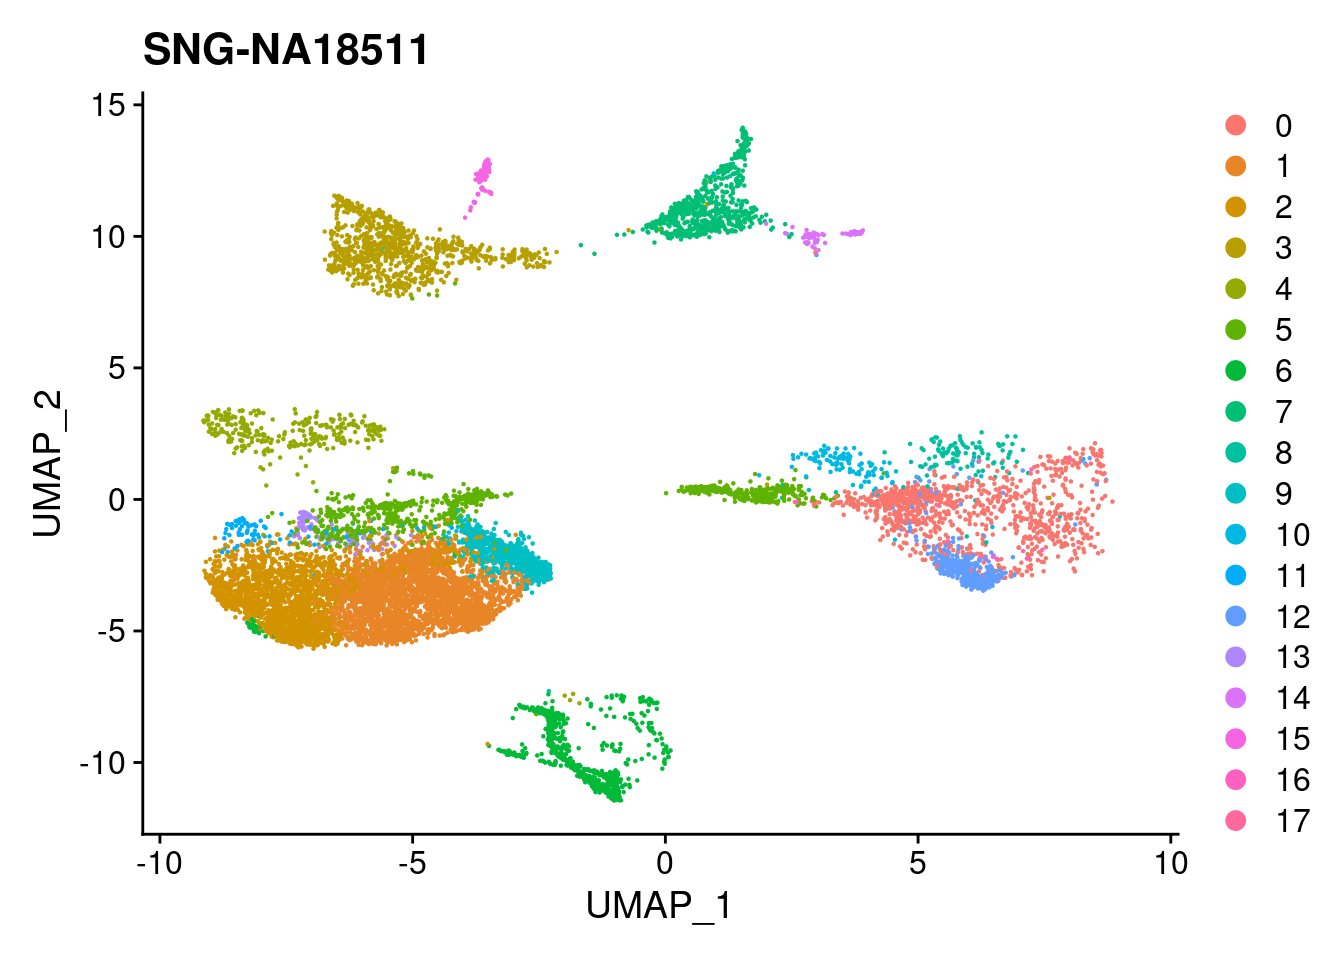
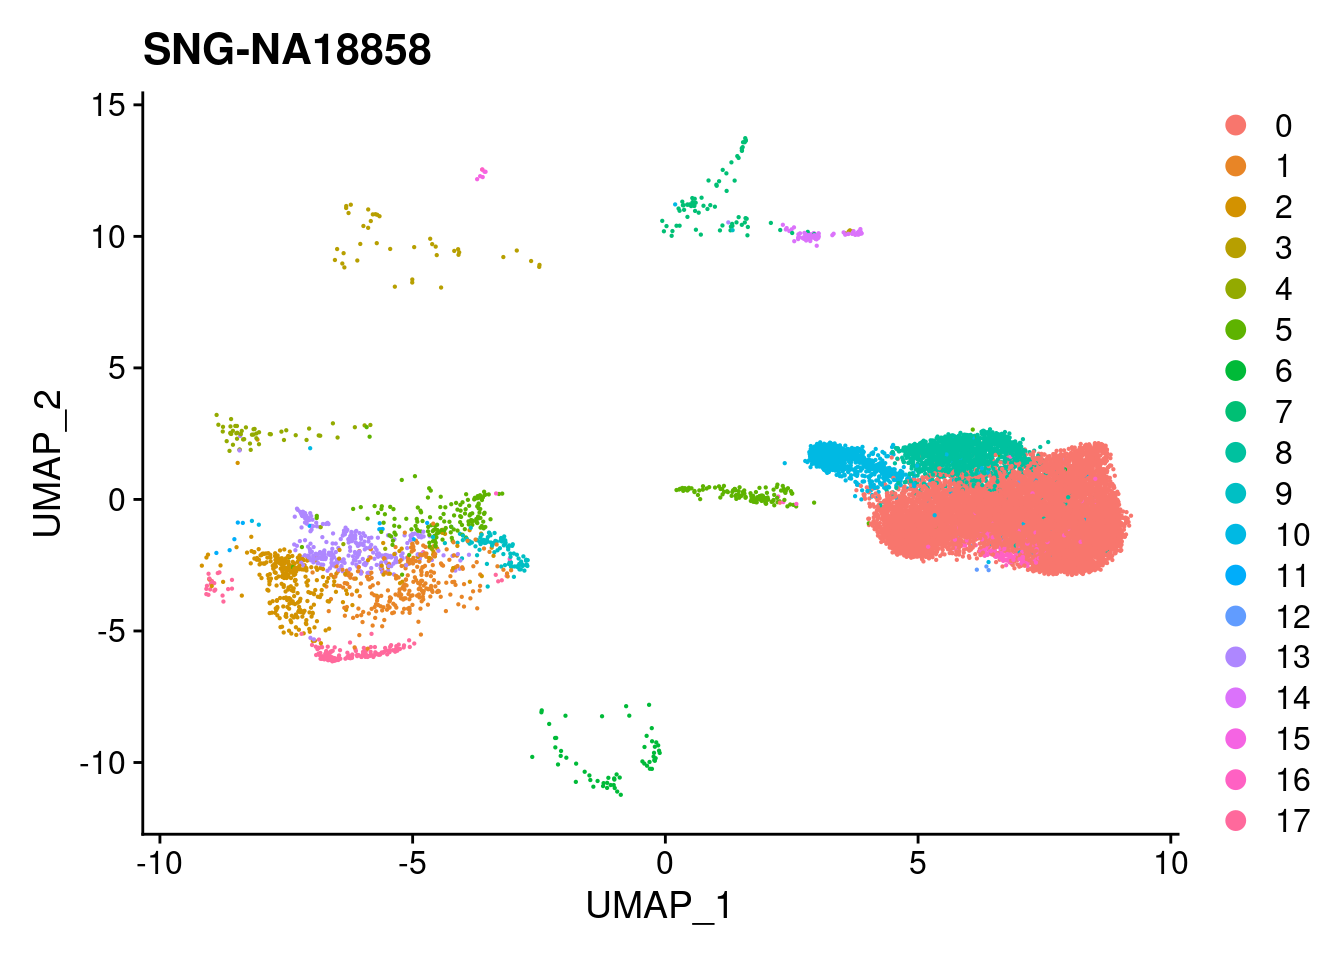
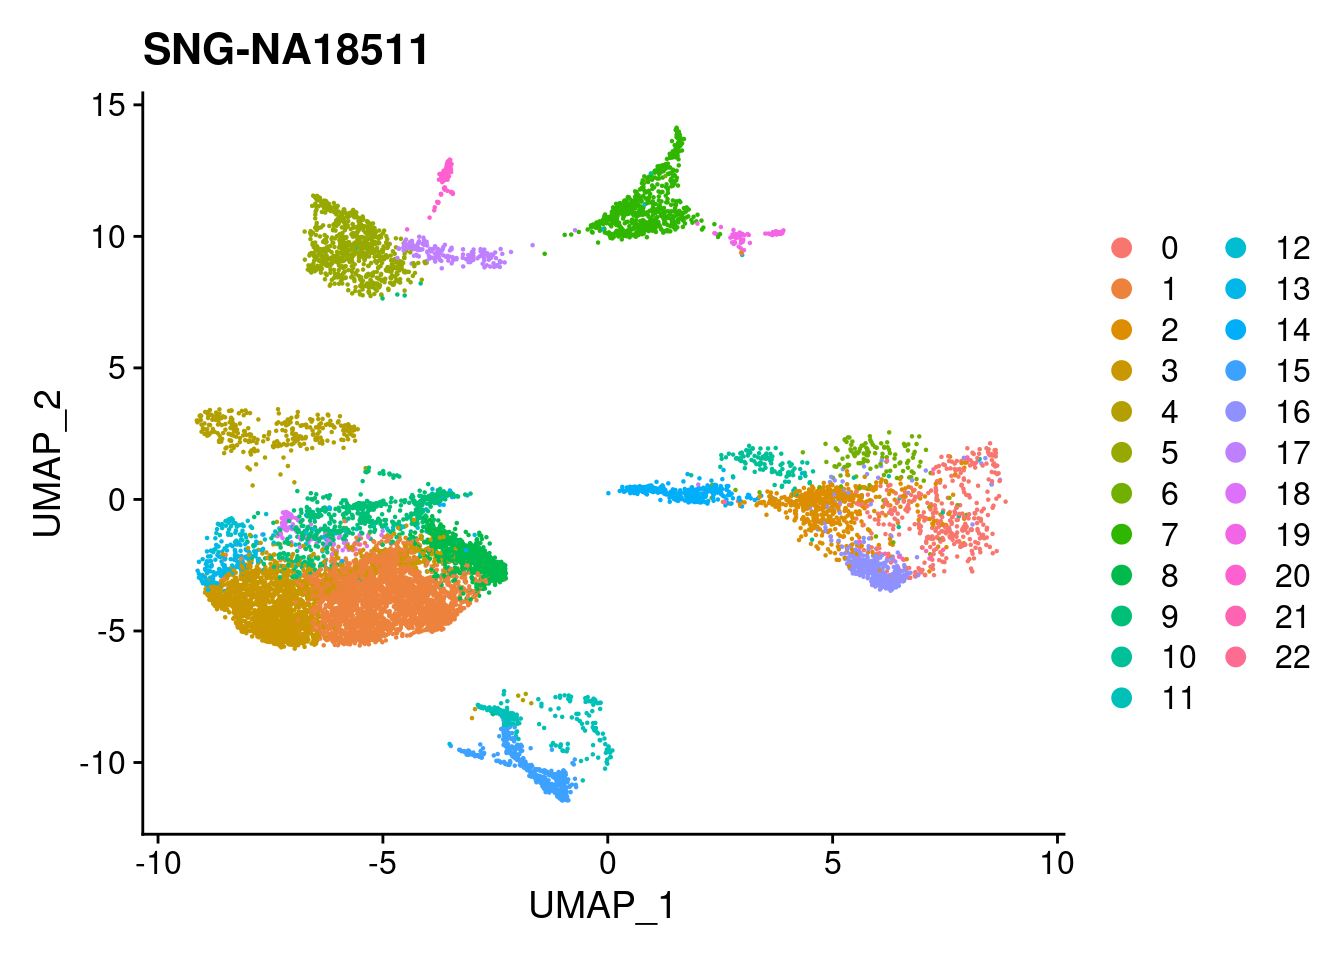
for (i in individuals)
{
print(DimPlot(merged, reduction = "umap",
cells = WhichCells(merged, expression = individual == i)) +
xlim(xlim) + ylim(ylim) + ggtitle(i))
}
| Version | Author | Date |
|---|---|---|
| 421a225 | KLRhodes | 2020-08-10 |
| Version | Author | Date |
|---|---|---|
| 421a225 | KLRhodes | 2020-08-10 |
| Version | Author | Date |
|---|---|---|
| 421a225 | KLRhodes | 2020-08-10 |
plots2<- DimPlot(merged, group.by = "individual", split.by = "Batch")
plots2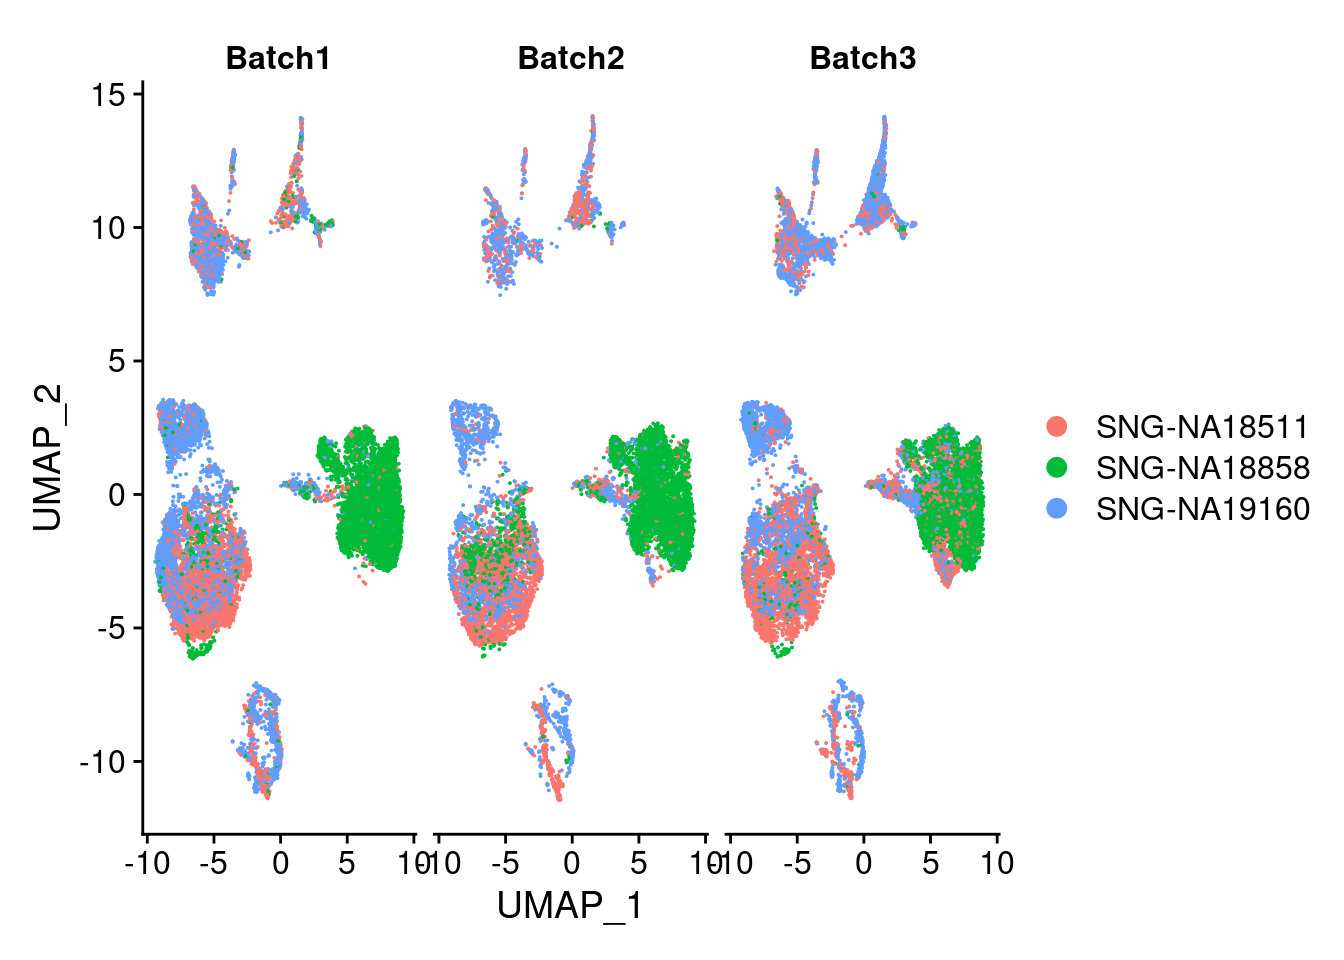
| Version | Author | Date |
|---|---|---|
| 421a225 | KLRhodes | 2020-08-10 |
DimPlot(merged, group.by = "Batch", split.by = c("individual"))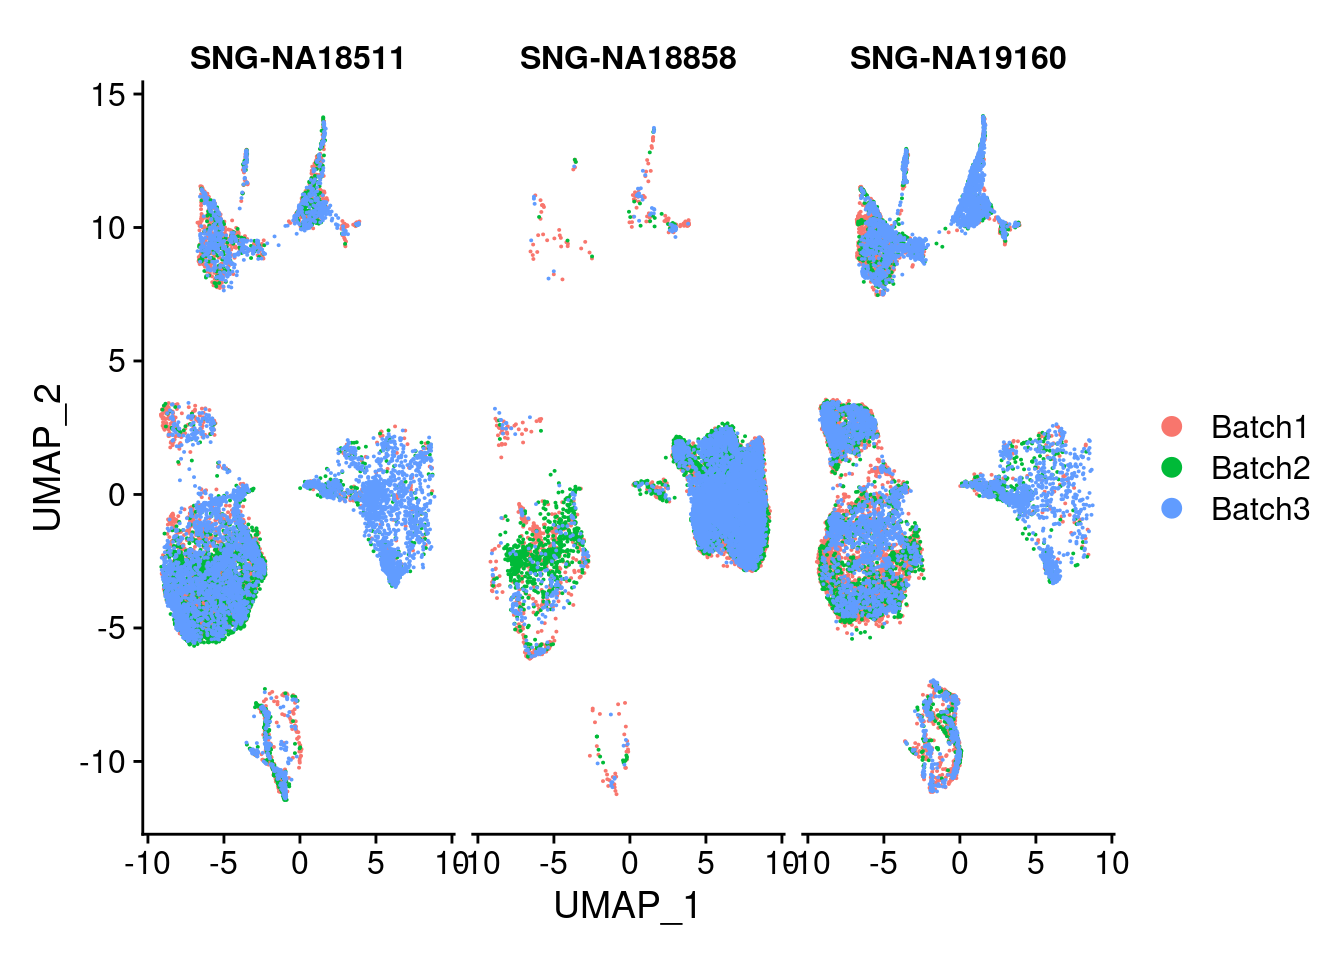
| Version | Author | Date |
|---|---|---|
| 421a225 | KLRhodes | 2020-08-10 |
DimPlot(merged, group.by = "SCT_snn_res.1", split.by = c("Batch"), label=T)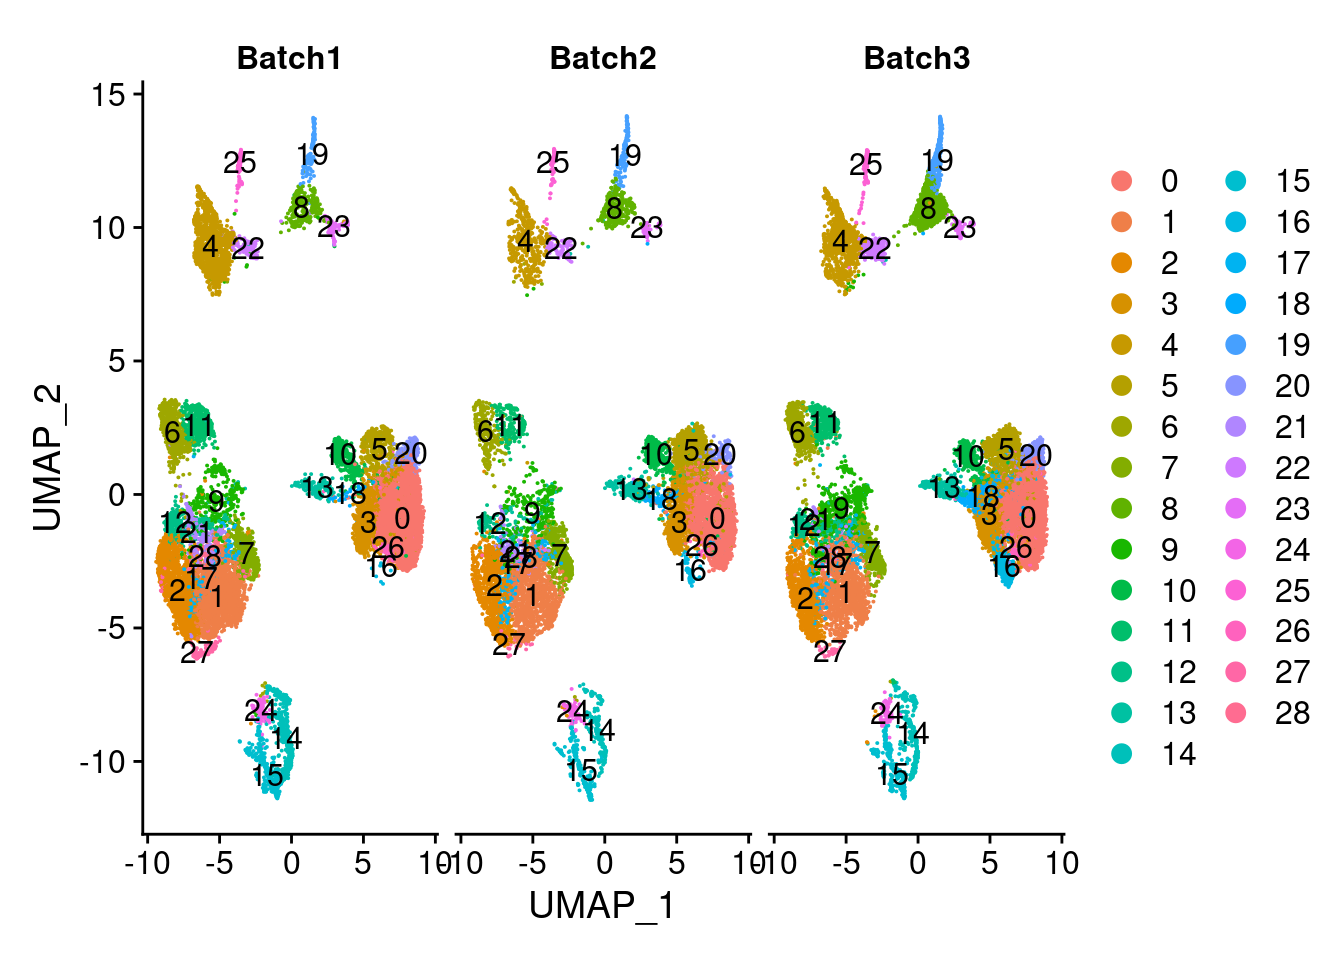
| Version | Author | Date |
|---|---|---|
| 421a225 | KLRhodes | 2020-08-10 |
DimPlot(merged, reduction = "harmony", group.by = "SCT_snn_res.1", split.by = "Batch", combine = F)[[1]]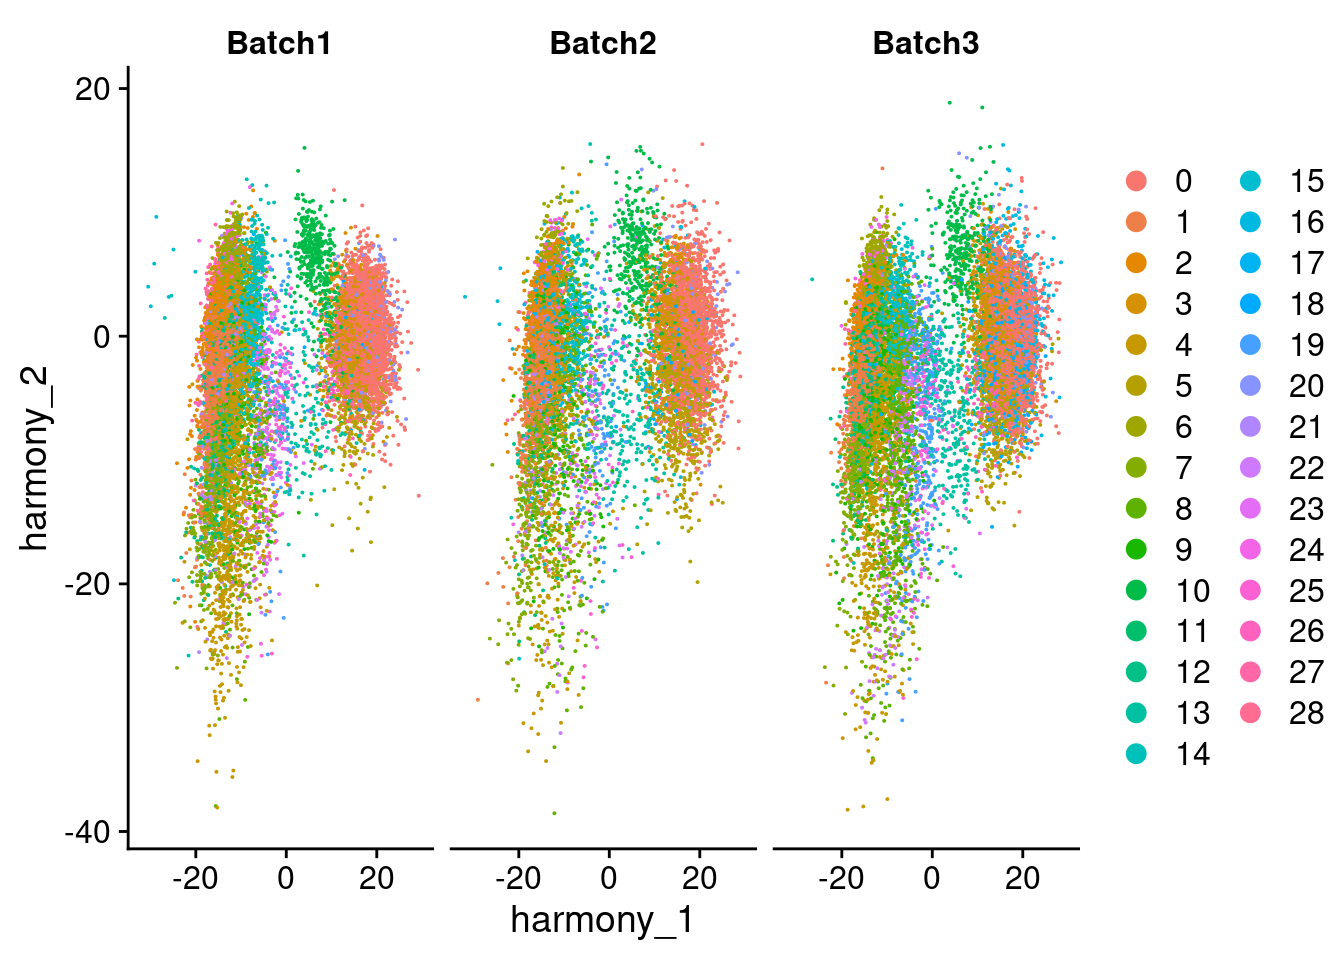
| Version | Author | Date |
|---|---|---|
| 421a225 | KLRhodes | 2020-08-10 |
VlnPlot(merged, features = c("POU5F1", "PAX6", "TNNT2", "SOX17", "HAND1", "LUM"), ncol=2)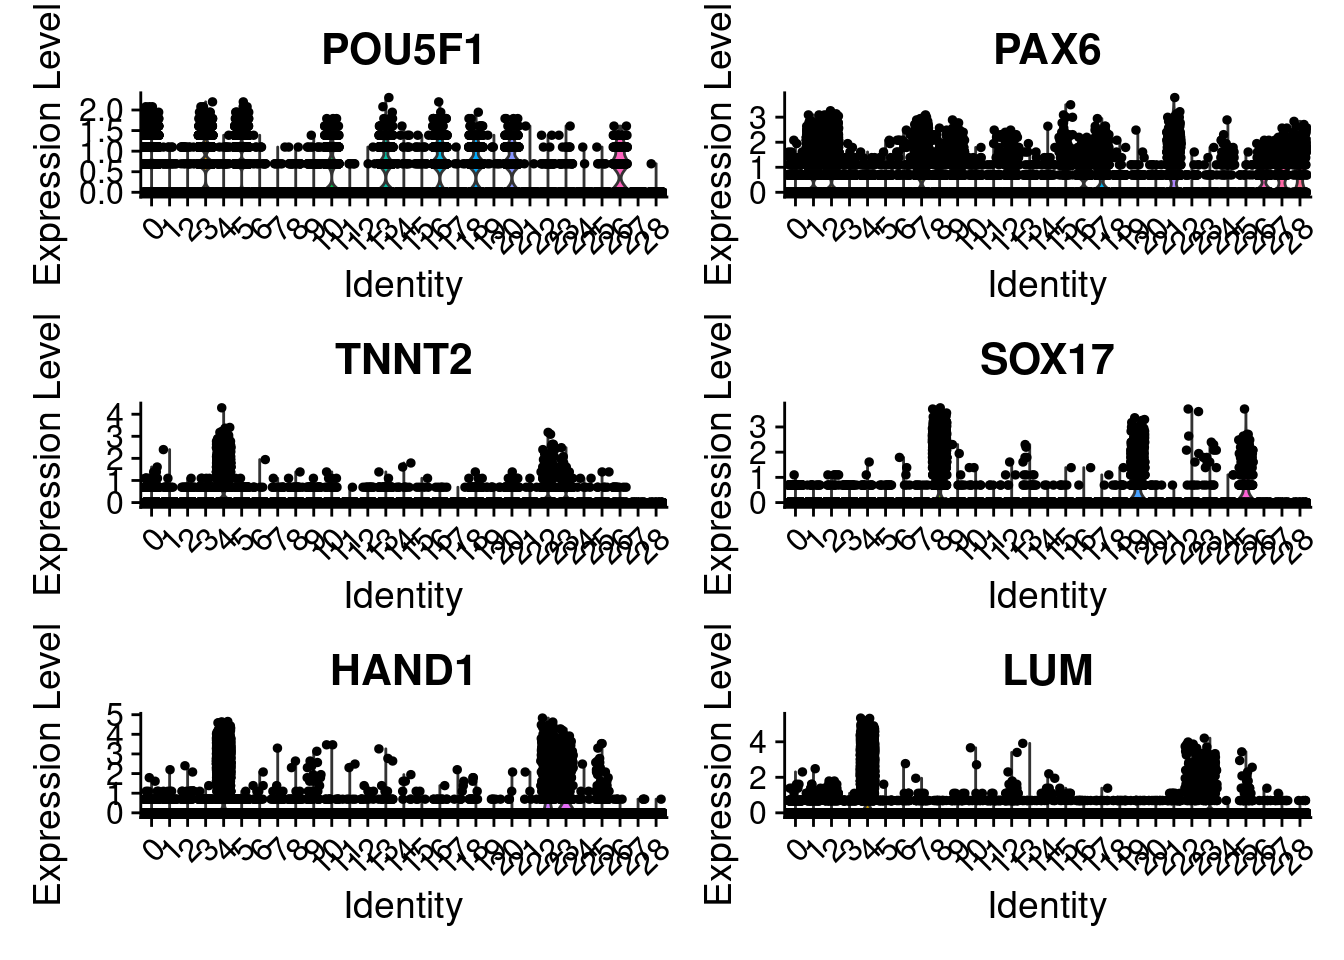
| Version | Author | Date |
|---|---|---|
| 421a225 | KLRhodes | 2020-08-10 |
#pluripotent markers
FeaturePlot(merged, features = c("POU5F1", "SOX2", "NANOG"), pt.size = 0.2, ncol=3)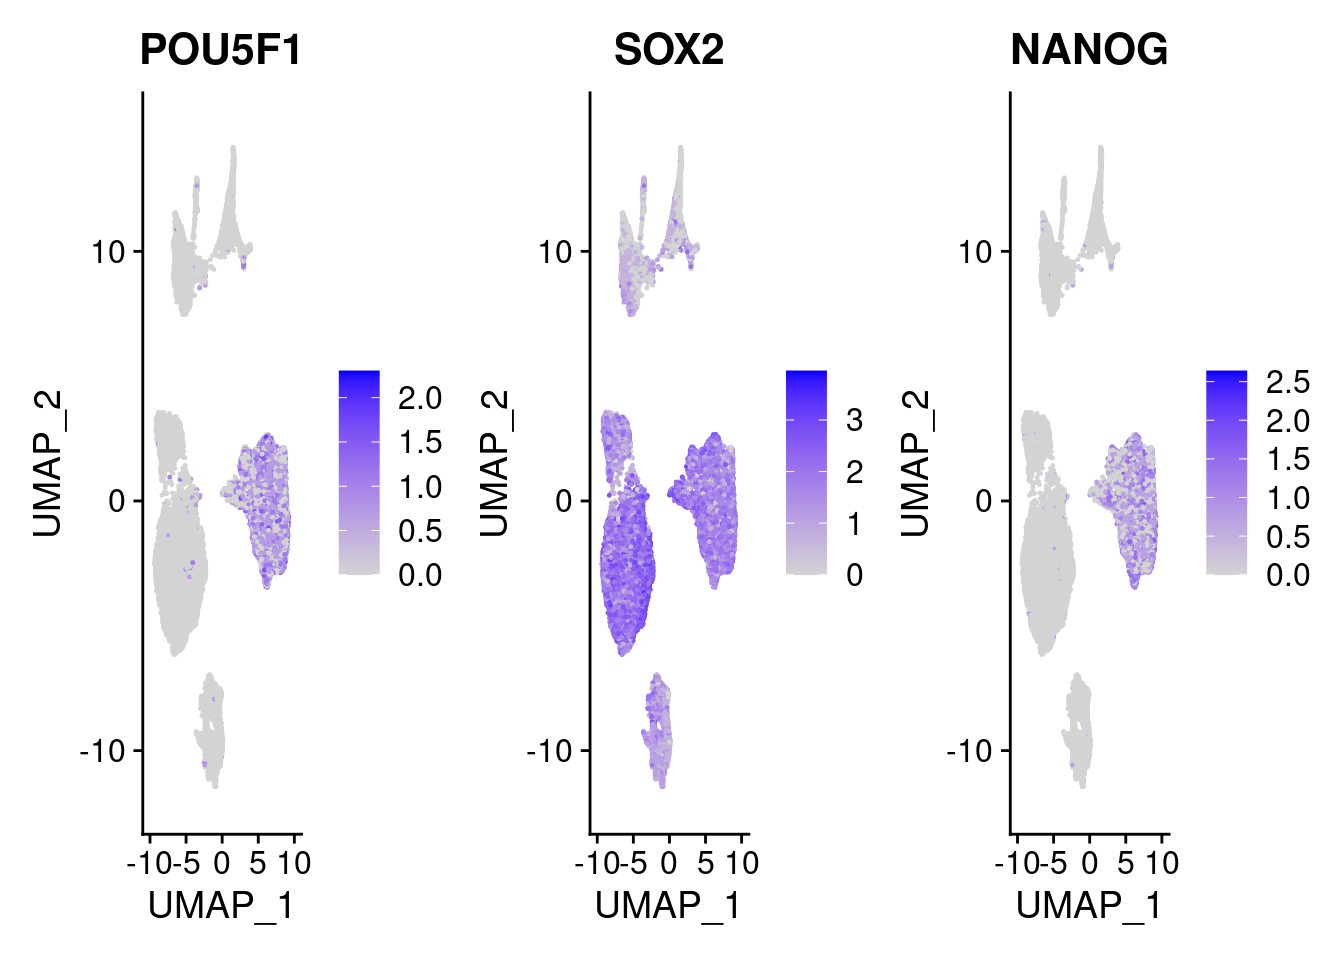
| Version | Author | Date |
|---|---|---|
| 421a225 | KLRhodes | 2020-08-10 |
#Endoderm markers (first 3 definitive endo, 4-6 liver markers, )
FeaturePlot(merged, features = c("SOX17","CLDN6","FOXA2", "TTR", "AFP", "FGB"), pt.size = 0.2, combine = F)
[[1]]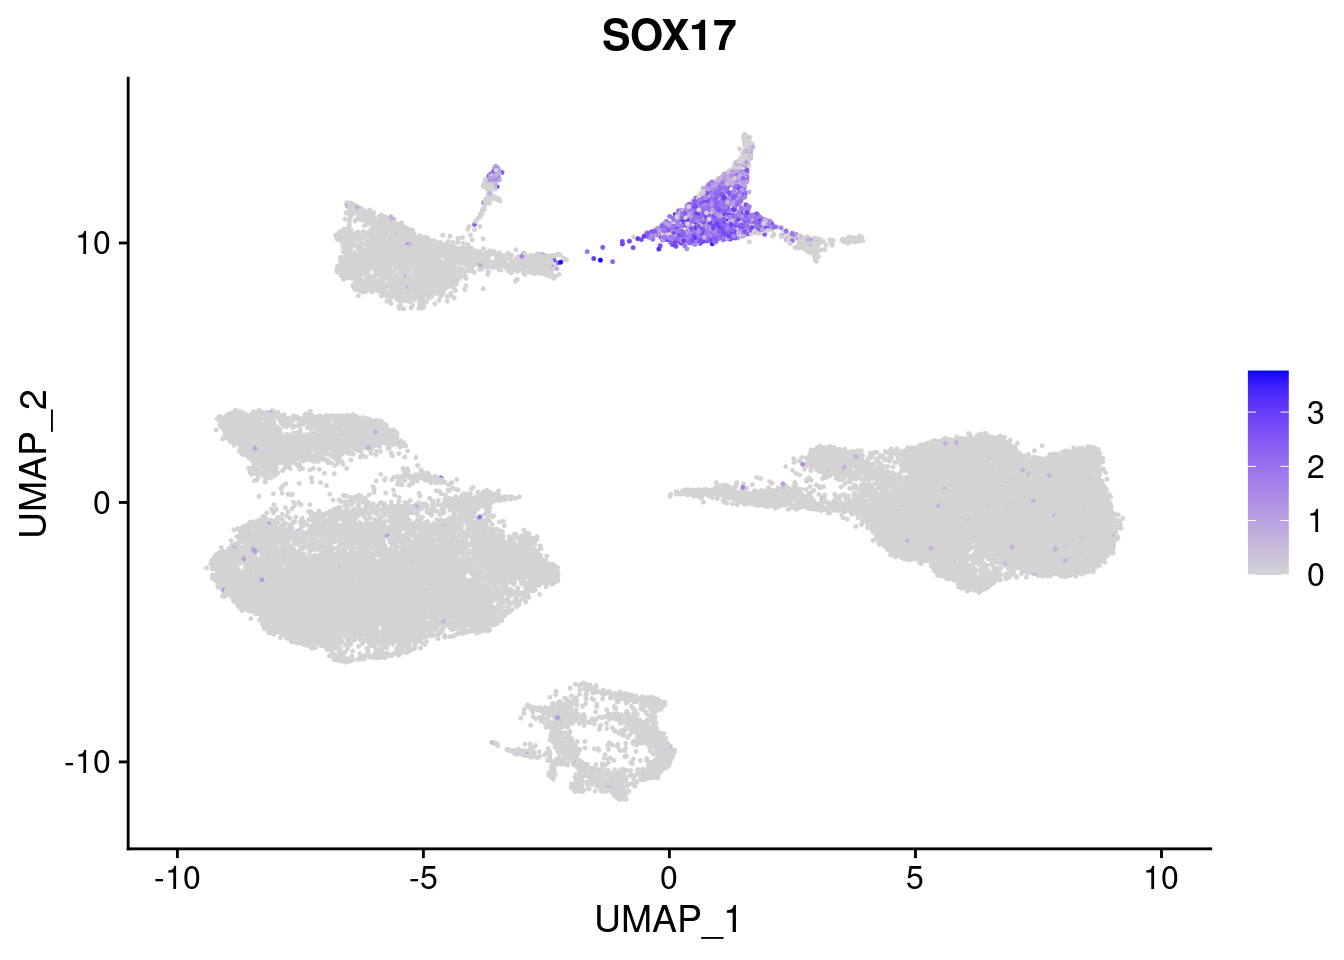
| Version | Author | Date |
|---|---|---|
| 421a225 | KLRhodes | 2020-08-10 |
[[2]]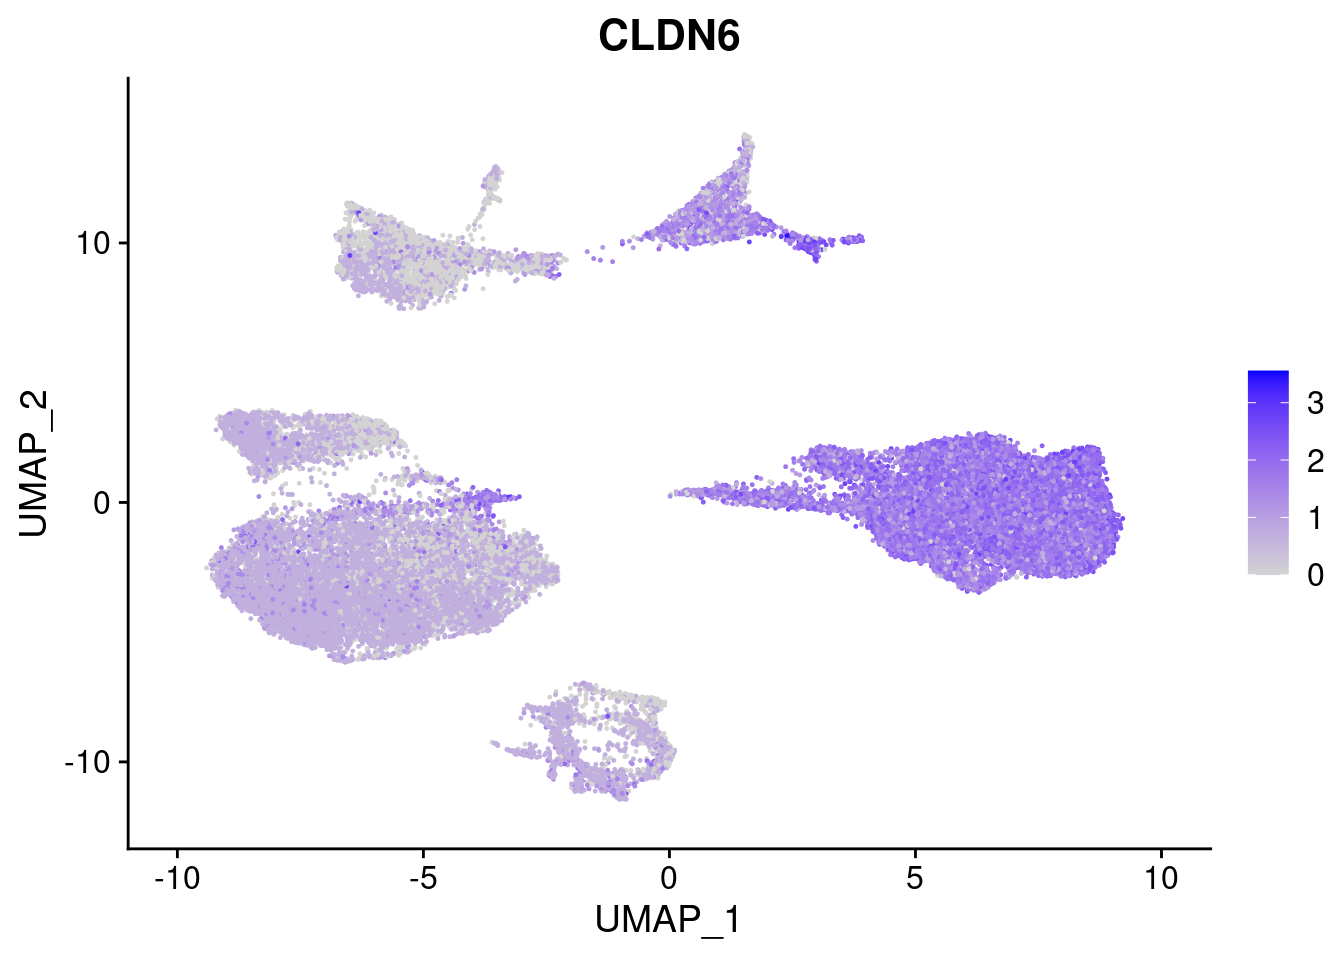
| Version | Author | Date |
|---|---|---|
| 421a225 | KLRhodes | 2020-08-10 |
[[3]]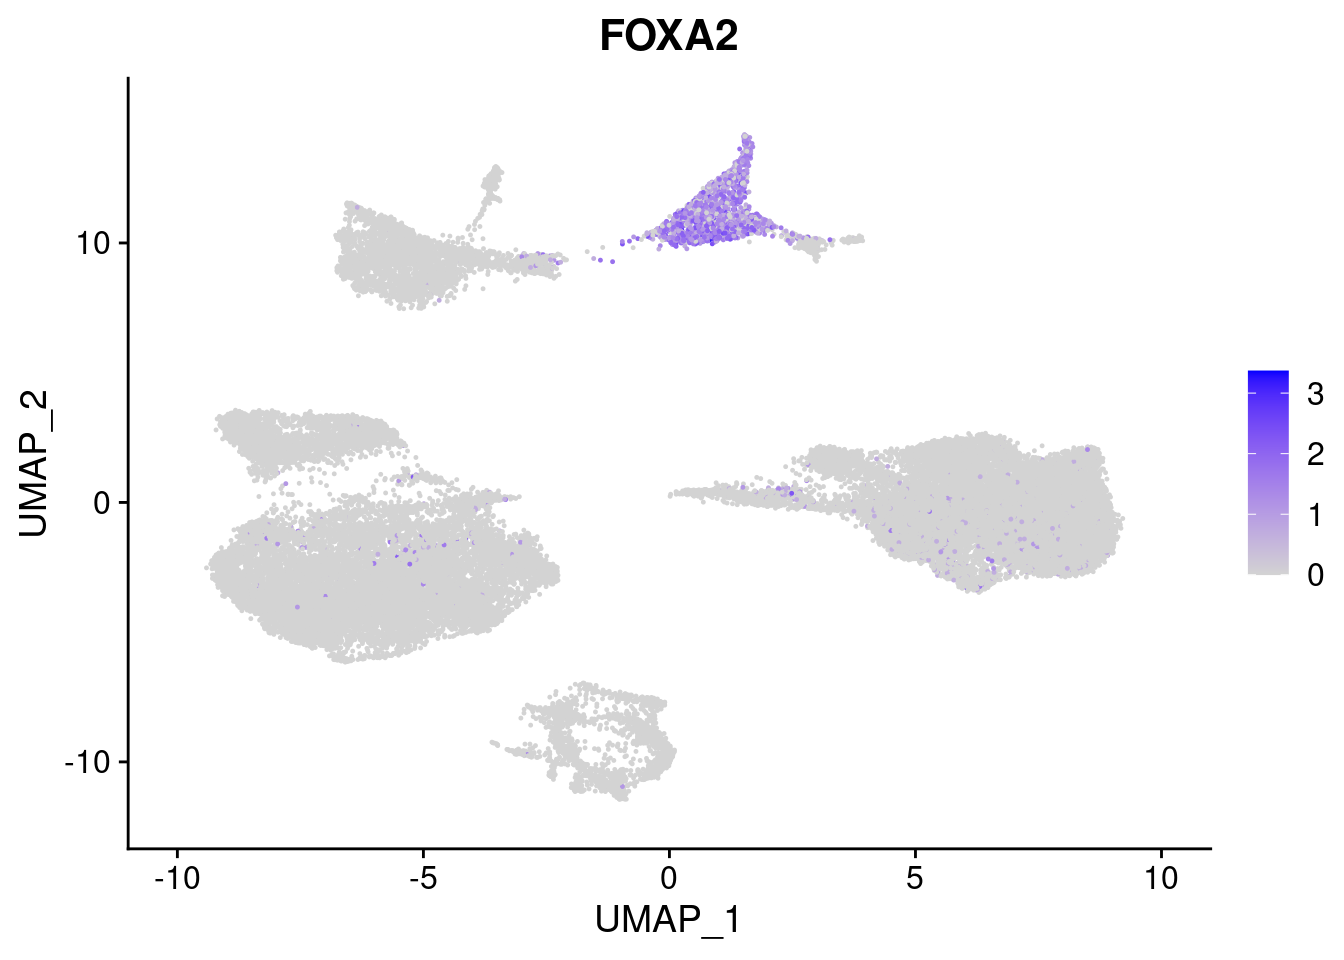
| Version | Author | Date |
|---|---|---|
| 421a225 | KLRhodes | 2020-08-10 |
[[4]]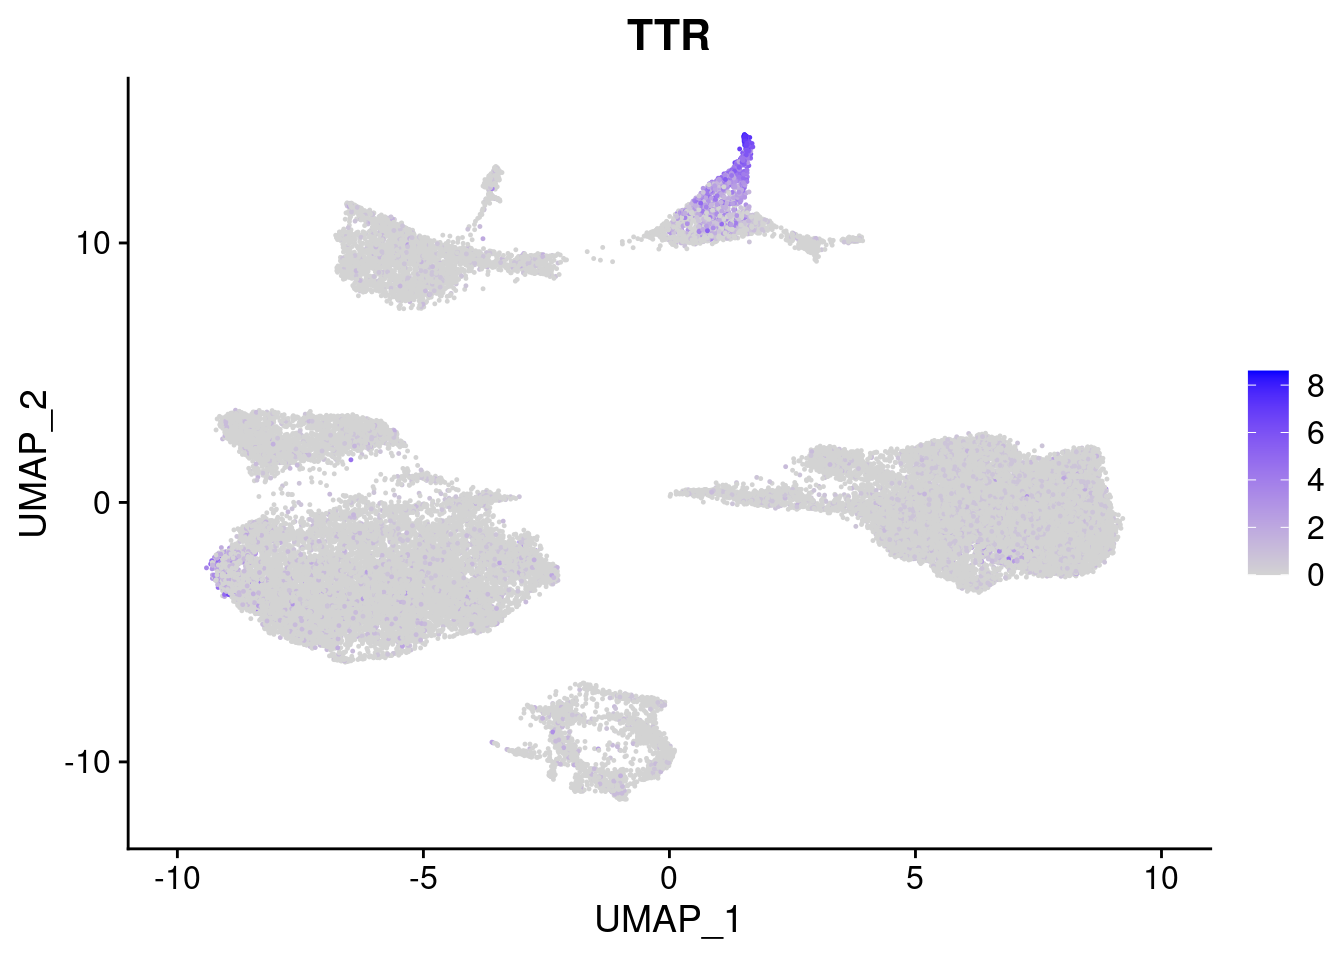
| Version | Author | Date |
|---|---|---|
| 421a225 | KLRhodes | 2020-08-10 |
[[5]]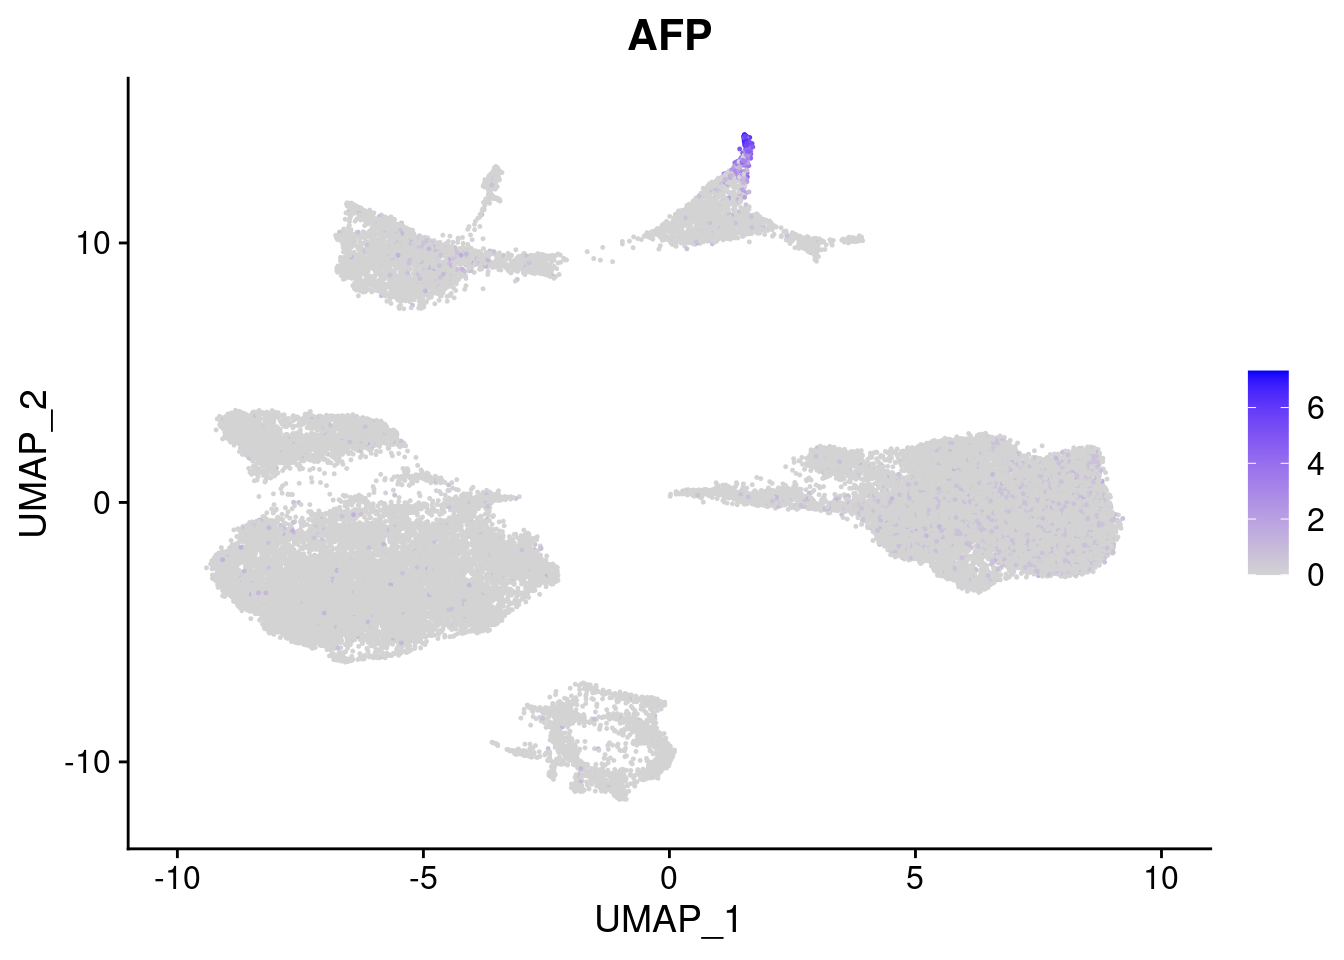
| Version | Author | Date |
|---|---|---|
| 421a225 | KLRhodes | 2020-08-10 |
[[6]]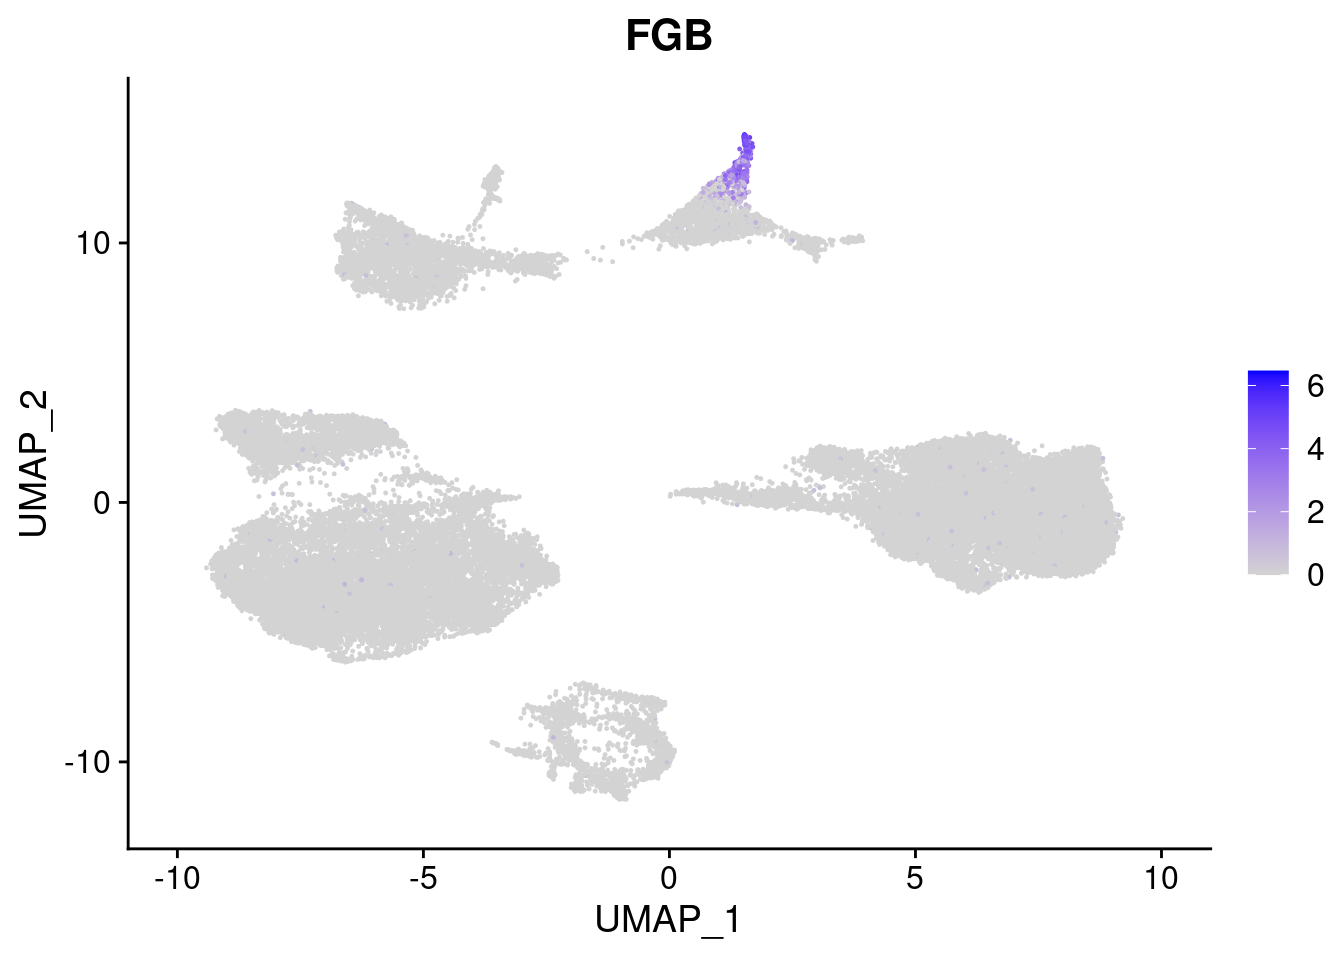
| Version | Author | Date |
|---|---|---|
| 421a225 | KLRhodes | 2020-08-10 |
#Mesoderm Markers (first 3 early meso markers, 4-6 heart markers, 7-9 endothelial markers (which comes from mesoderm), then some other general muscle markers)
FeaturePlot(merged, features = c("HAND1", "BMP4", "TNNT2","KDR", "GNG11", "ECSCR", "COL3A1", "ACTC1"), pt.size = 0.2, combine=F)
[[1]]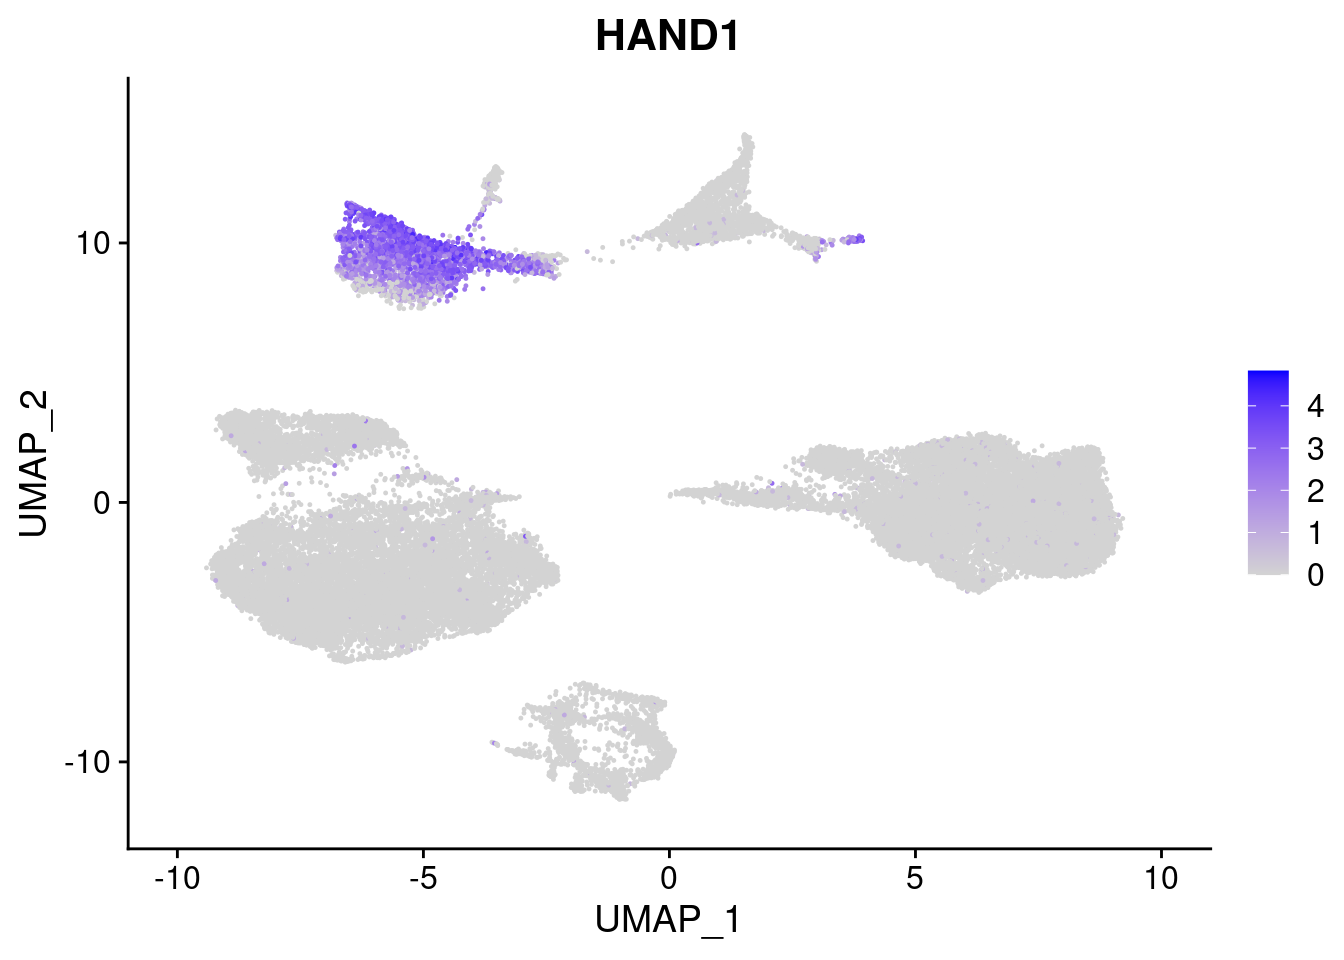
| Version | Author | Date |
|---|---|---|
| 421a225 | KLRhodes | 2020-08-10 |
[[2]]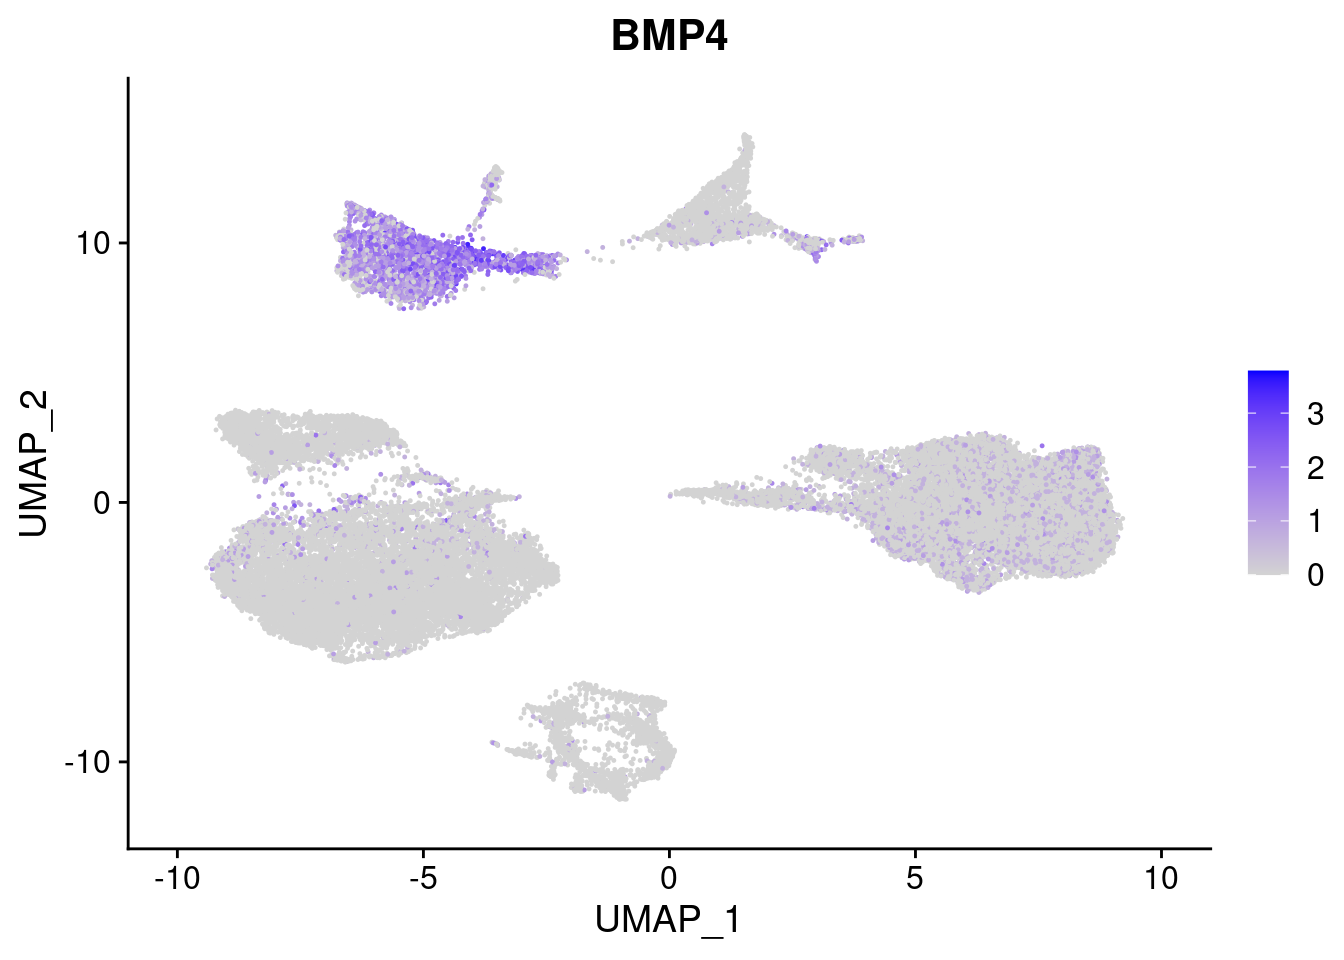
| Version | Author | Date |
|---|---|---|
| 421a225 | KLRhodes | 2020-08-10 |
[[3]]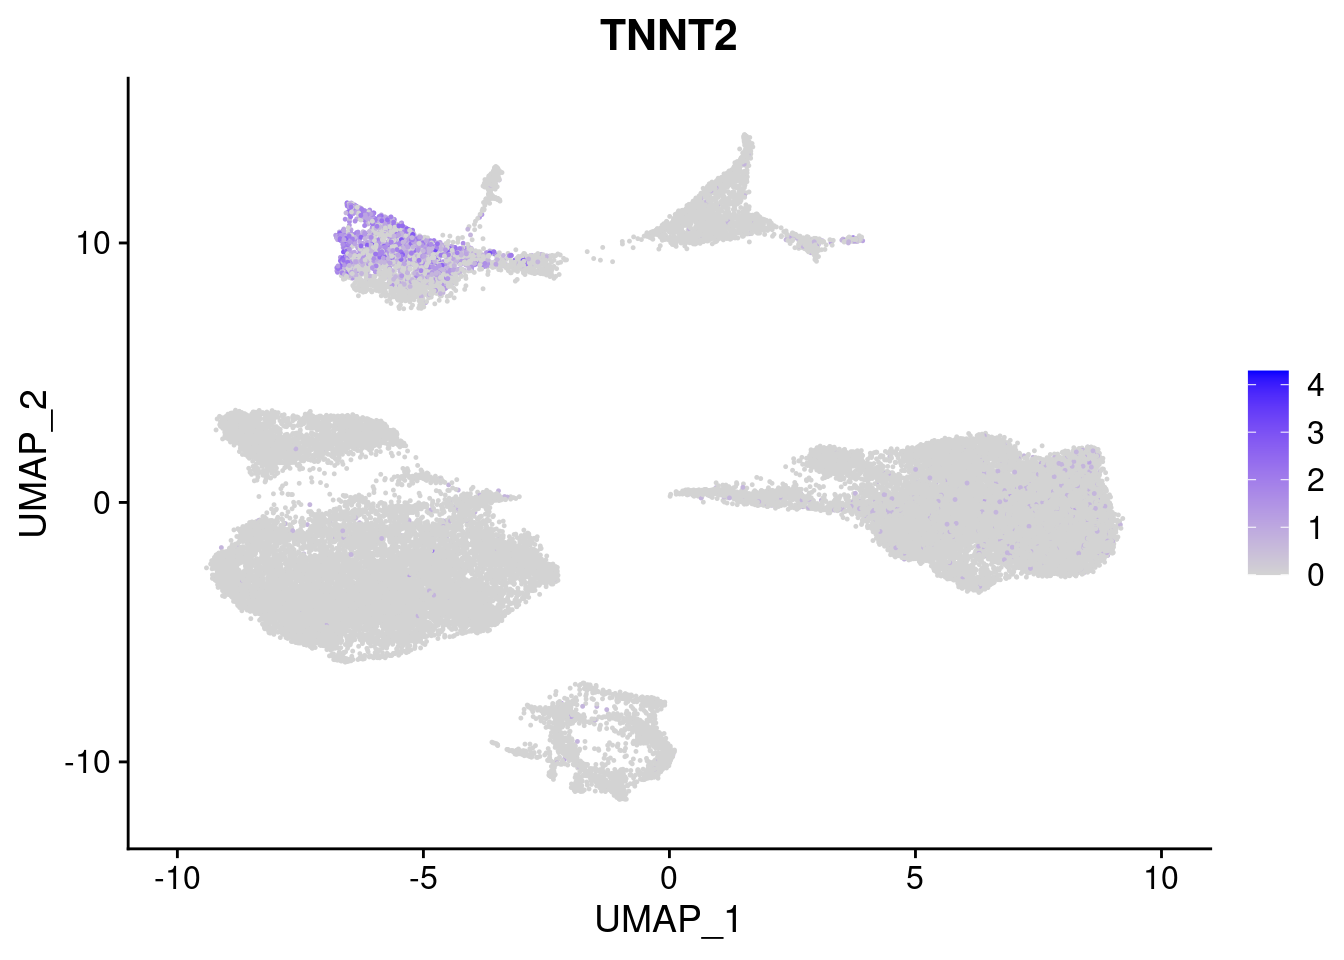
| Version | Author | Date |
|---|---|---|
| 421a225 | KLRhodes | 2020-08-10 |
[[4]]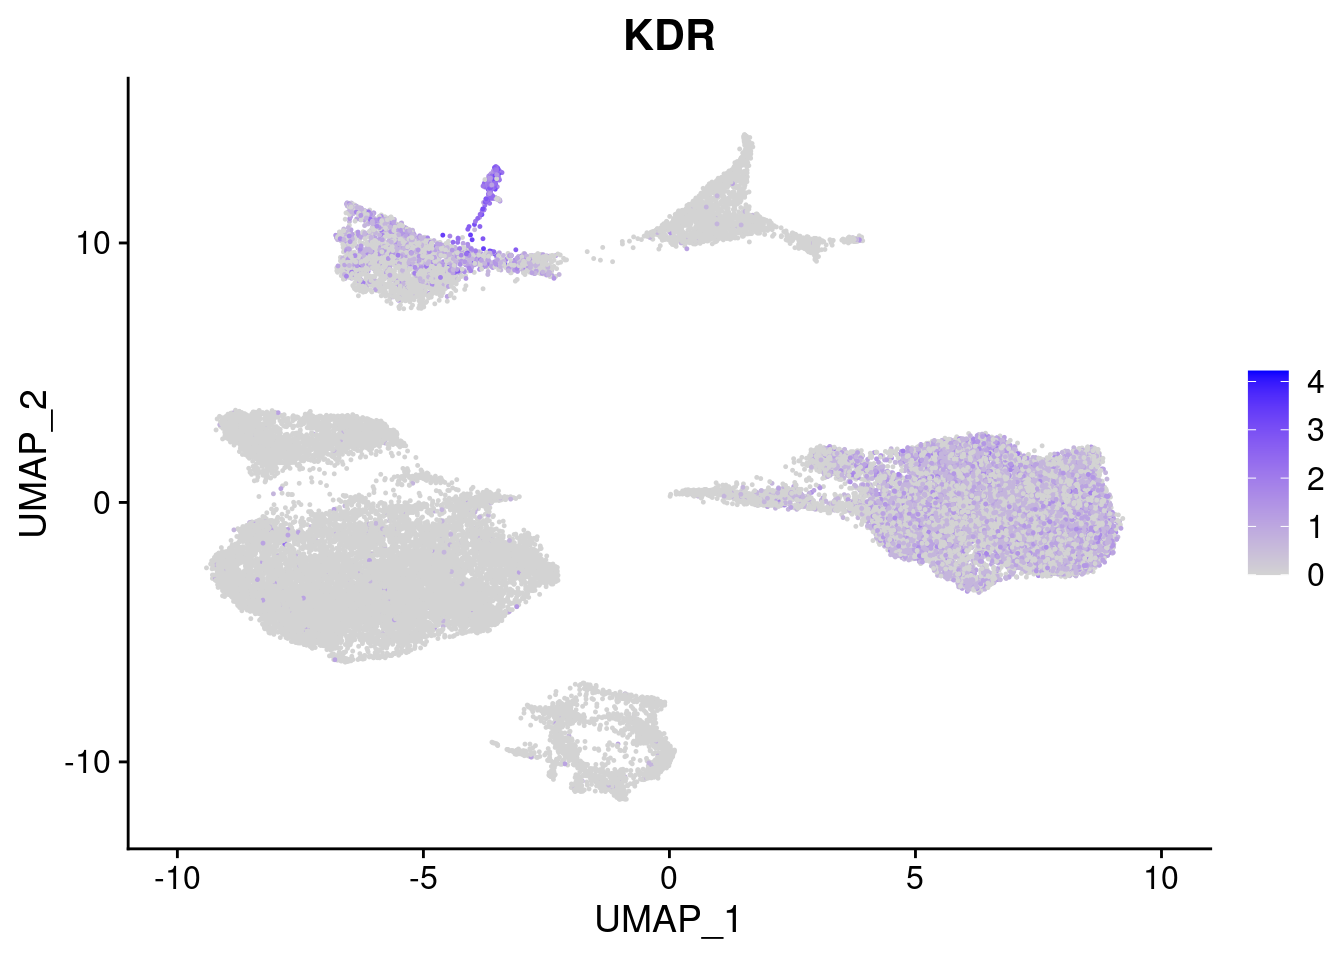
| Version | Author | Date |
|---|---|---|
| 421a225 | KLRhodes | 2020-08-10 |
[[5]]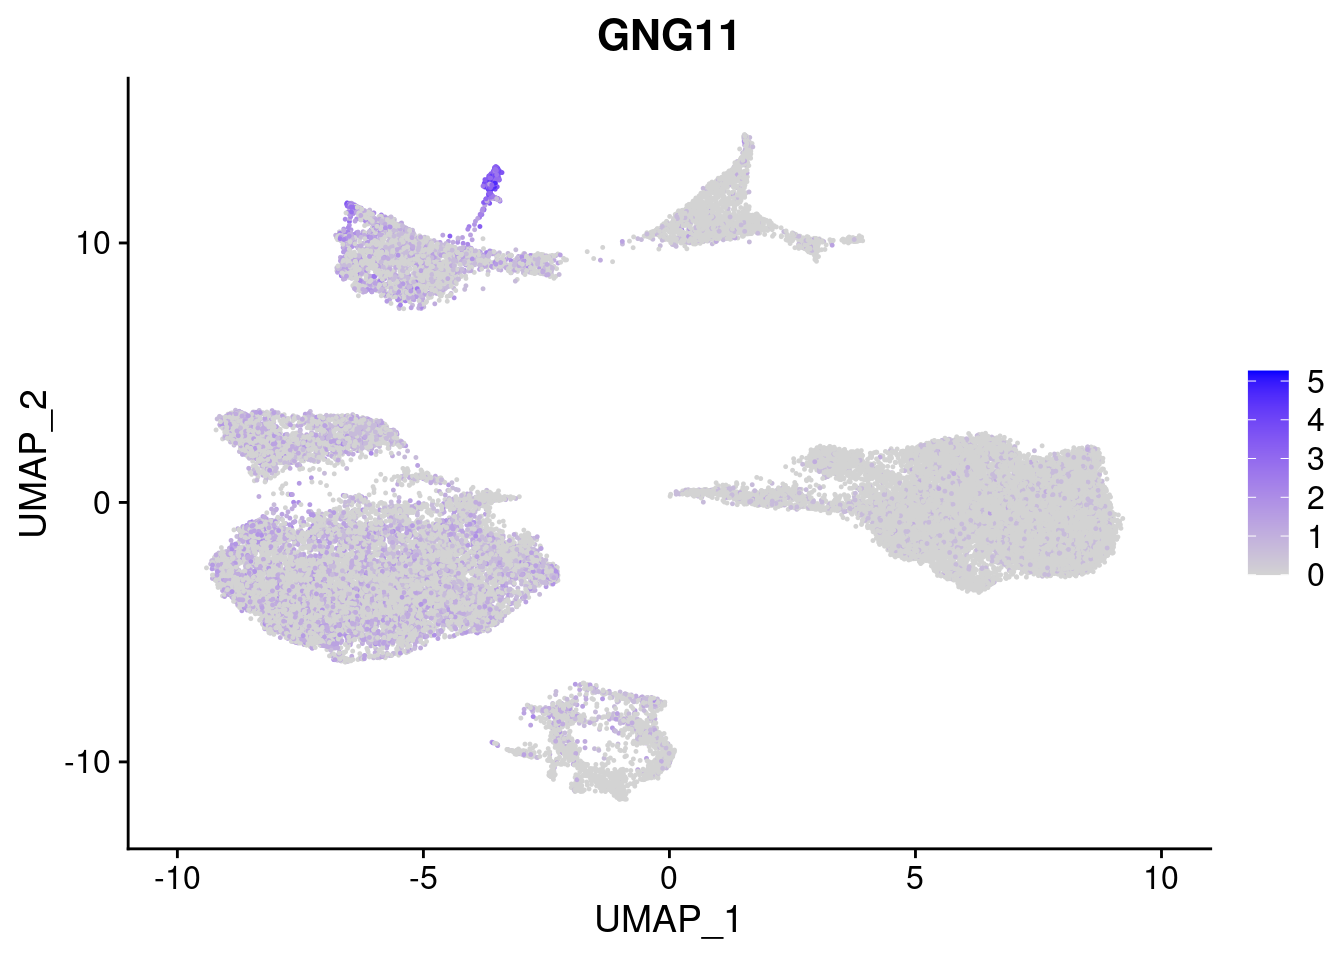
| Version | Author | Date |
|---|---|---|
| 421a225 | KLRhodes | 2020-08-10 |
[[6]]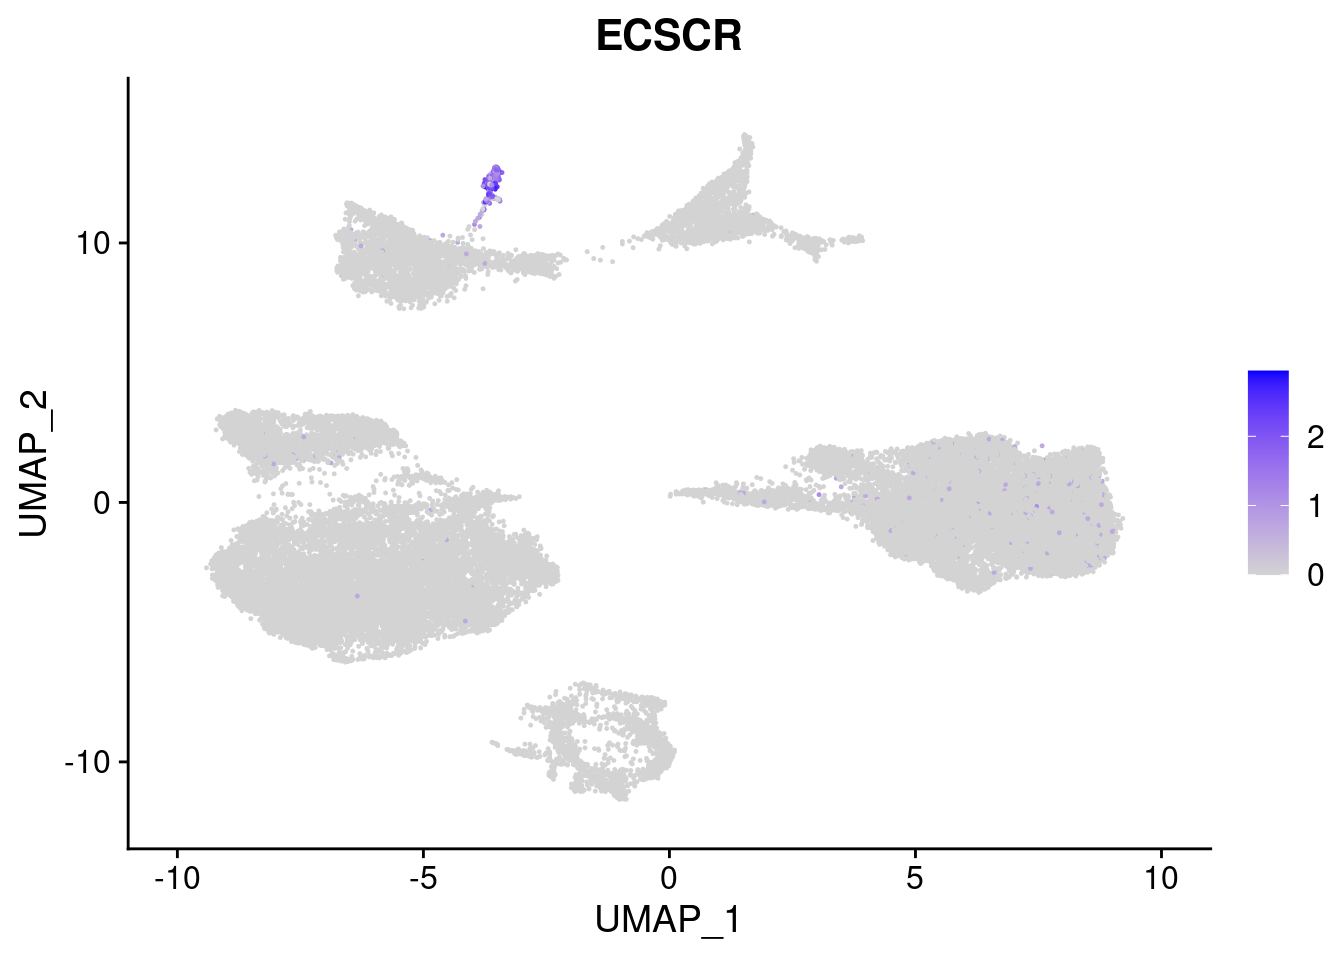
| Version | Author | Date |
|---|---|---|
| 421a225 | KLRhodes | 2020-08-10 |
[[7]]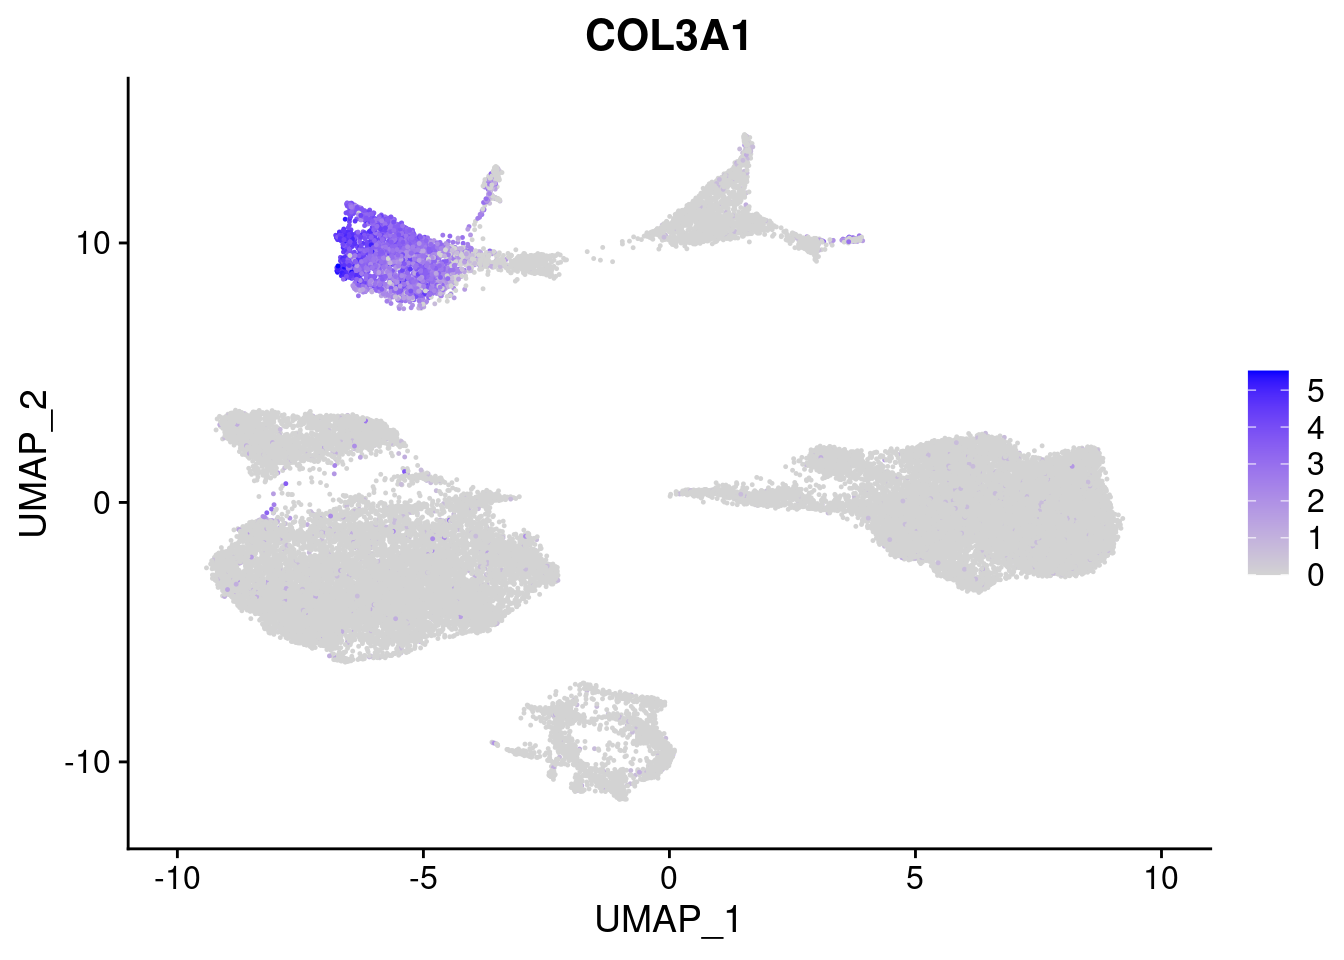
| Version | Author | Date |
|---|---|---|
| 421a225 | KLRhodes | 2020-08-10 |
[[8]]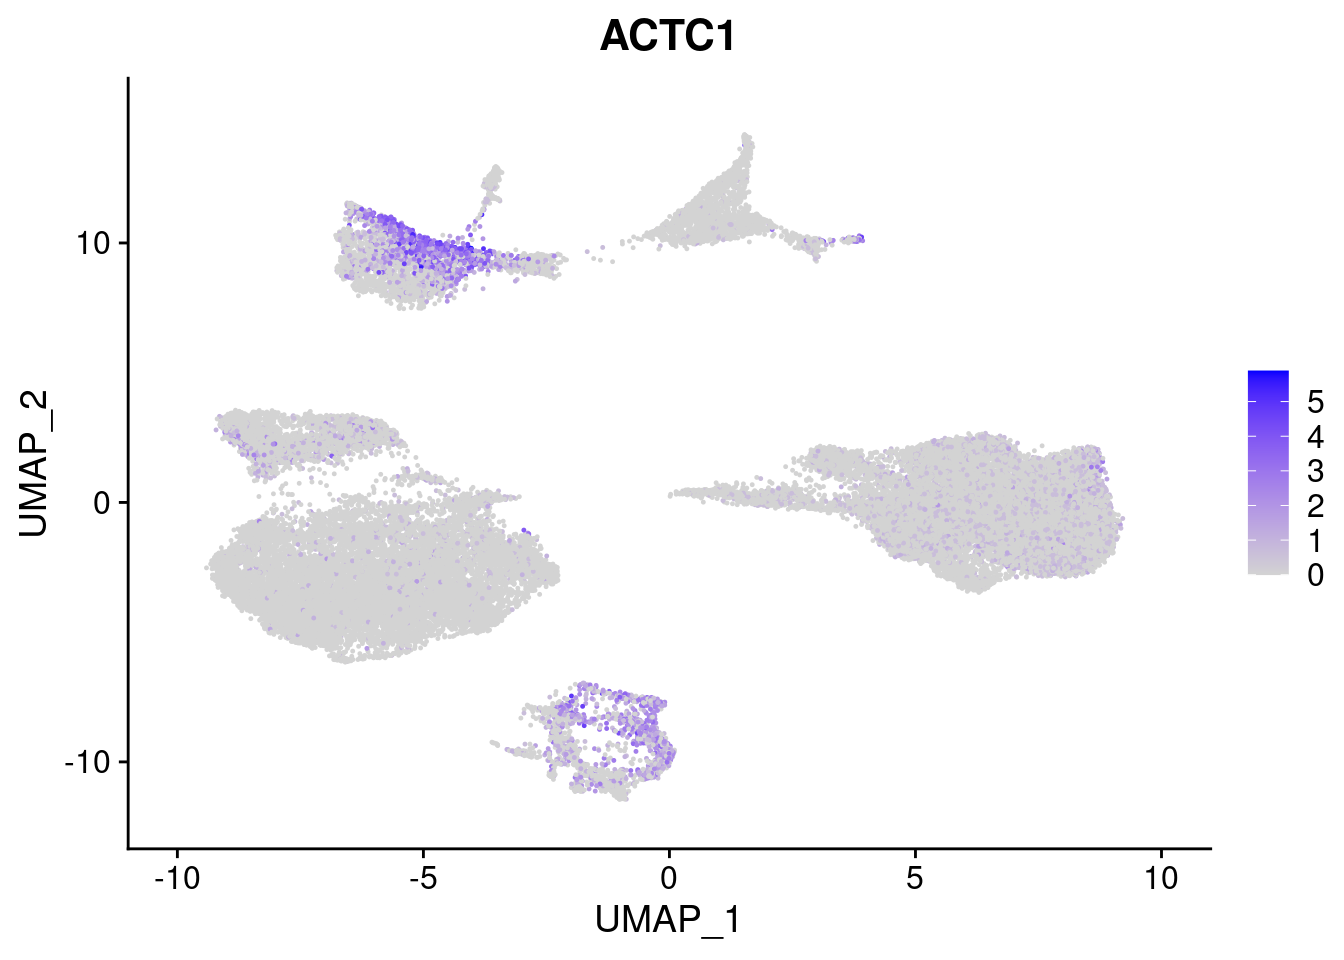
| Version | Author | Date |
|---|---|---|
| 421a225 | KLRhodes | 2020-08-10 |
#Ectoderm Markers (3-1 early ectoderm markers, 4-6schwann cell (myelinating, non myelinating, or precursor), 7-8 oligodendrocytes, 9-10 radial glia)
FeaturePlot(merged, features = c("PAX6", "GBX2",  "NES", "MPZ", "SOX10","GAP43", "OLIG1", "OLIG2", "VIM", "HES5"), pt.size = 0.2, ncol=3, combine=F)
[[1]]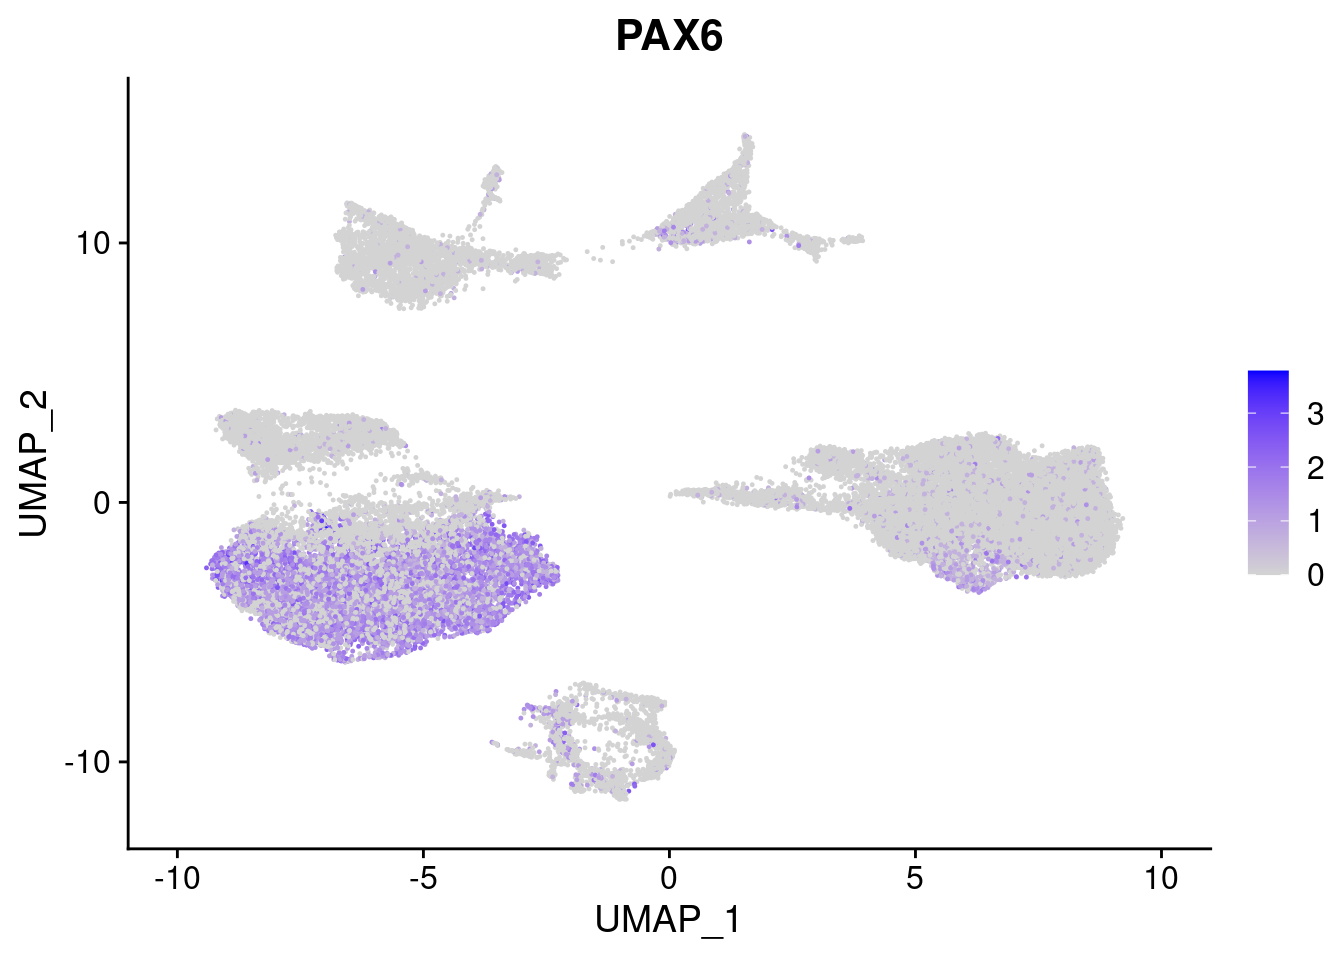
| Version | Author | Date |
|---|---|---|
| 421a225 | KLRhodes | 2020-08-10 |
[[2]]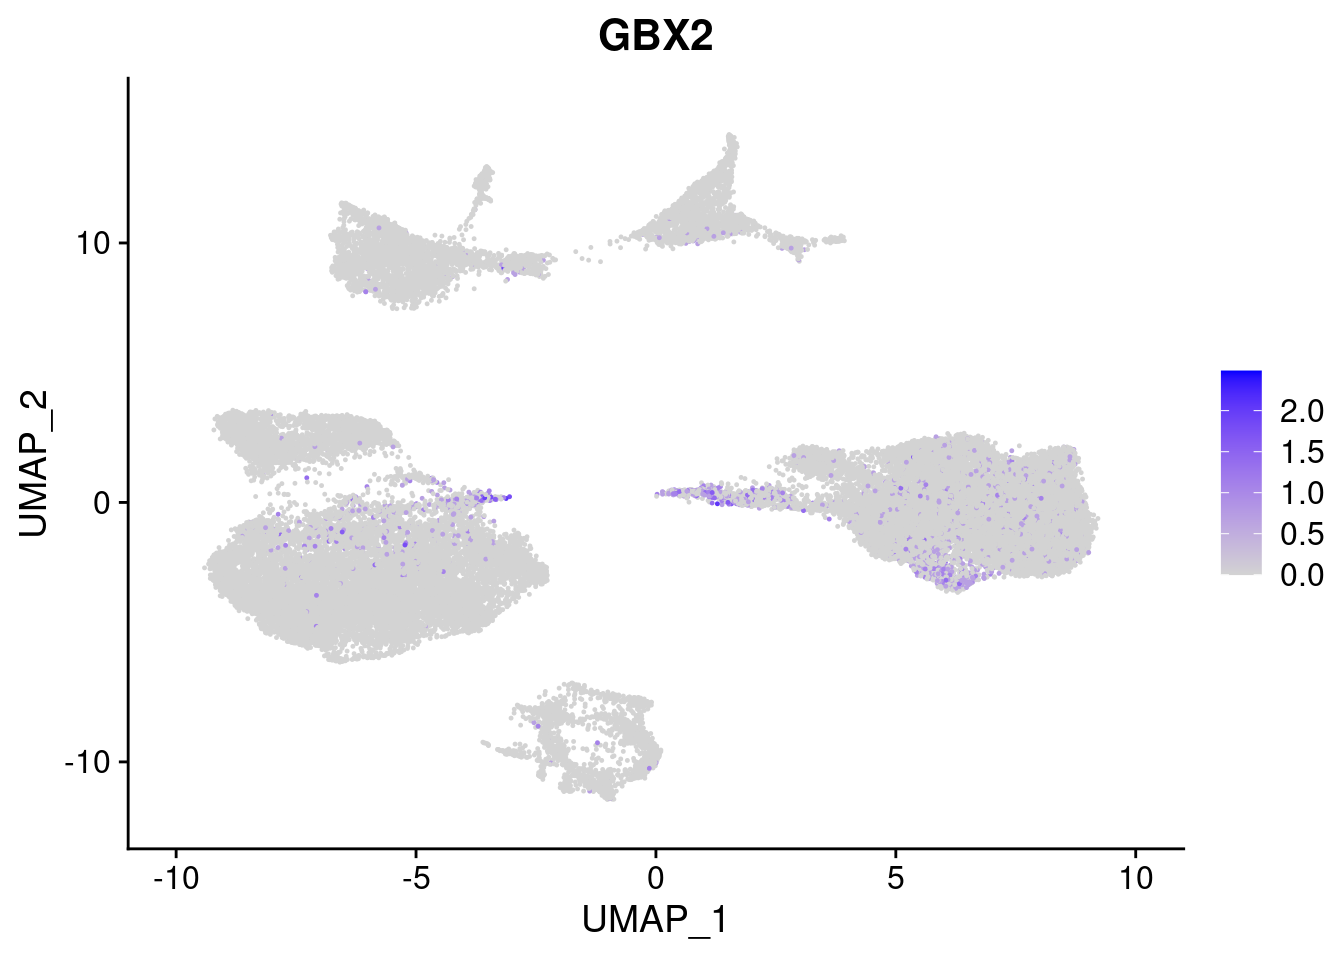
| Version | Author | Date |
|---|---|---|
| 421a225 | KLRhodes | 2020-08-10 |
[[3]]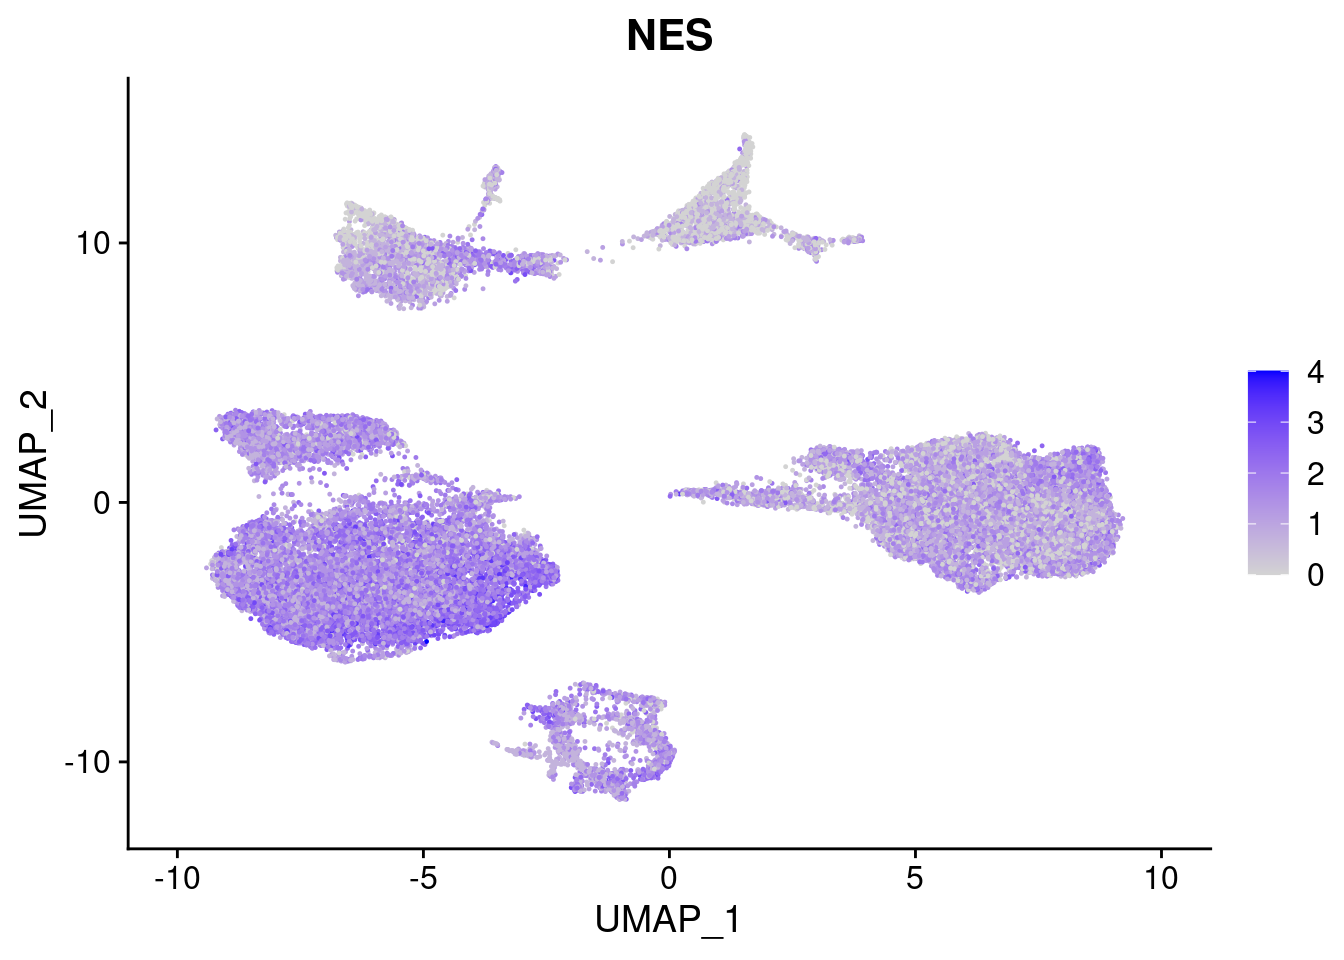
| Version | Author | Date |
|---|---|---|
| 421a225 | KLRhodes | 2020-08-10 |
[[4]]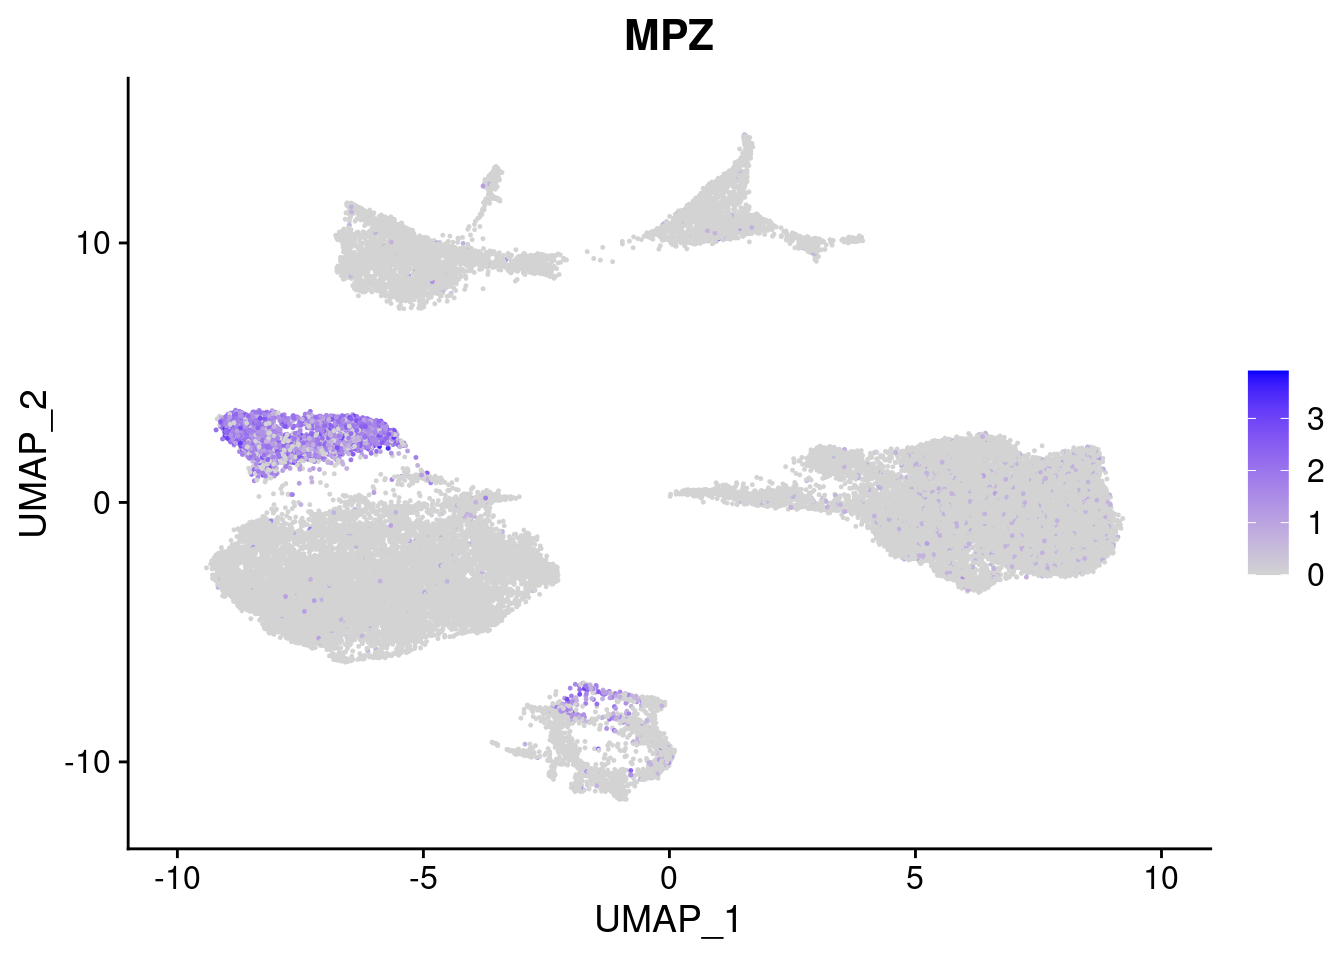
| Version | Author | Date |
|---|---|---|
| 421a225 | KLRhodes | 2020-08-10 |
[[5]]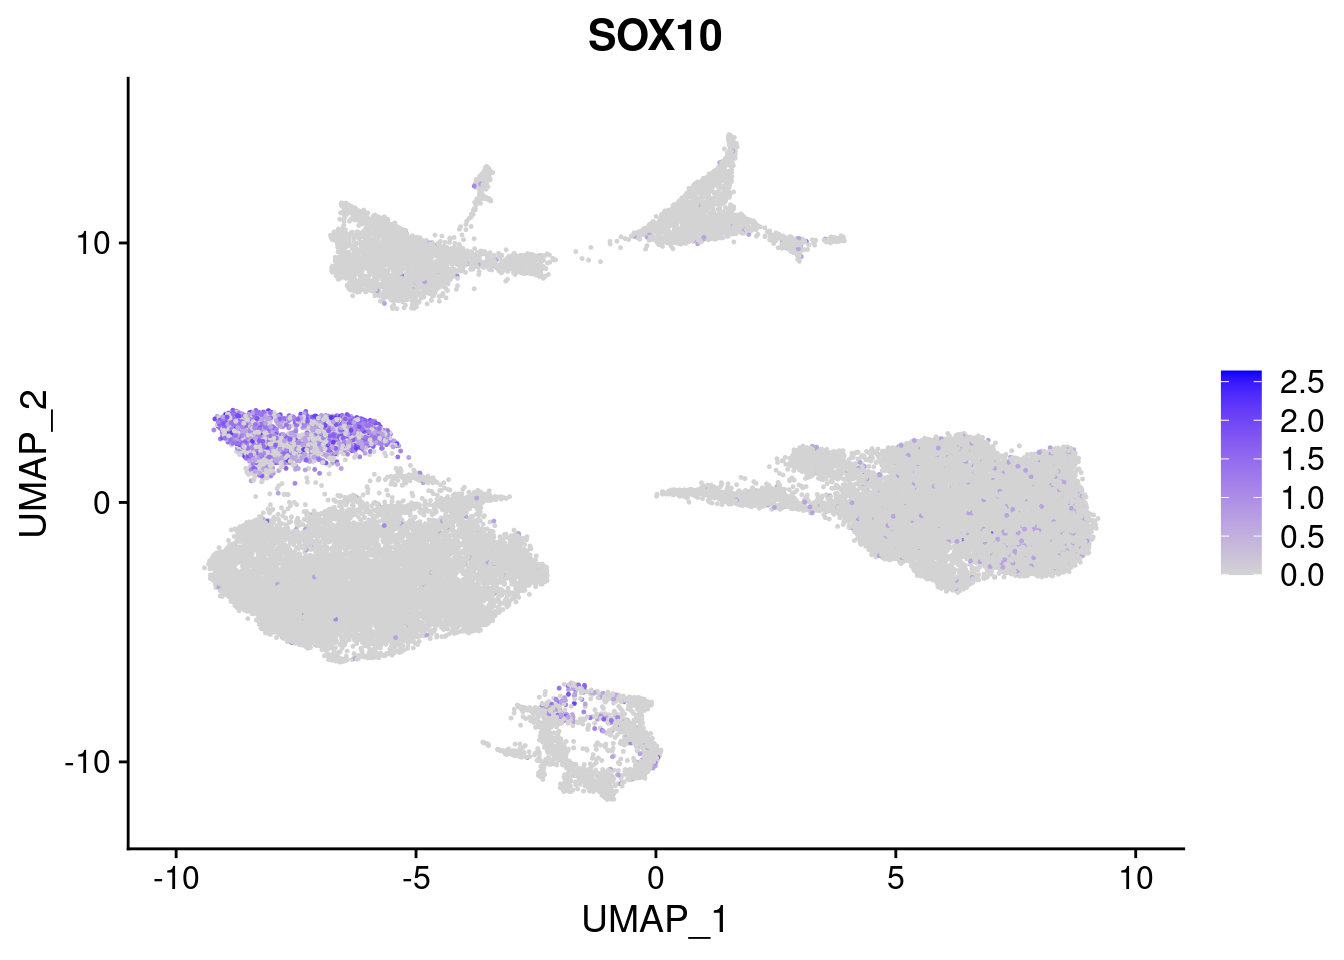
| Version | Author | Date |
|---|---|---|
| 421a225 | KLRhodes | 2020-08-10 |
[[6]]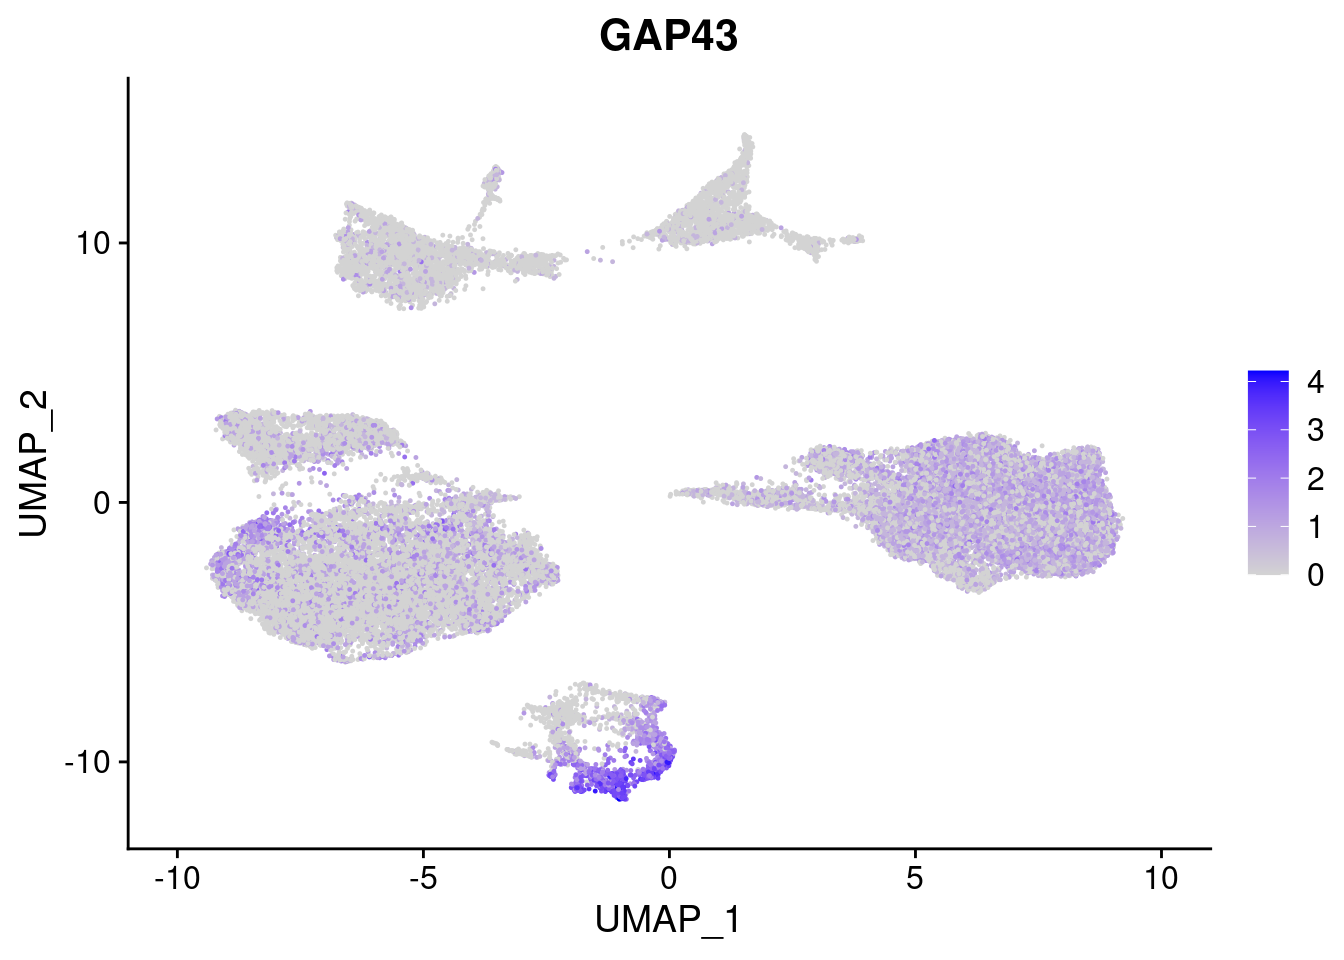
| Version | Author | Date |
|---|---|---|
| 421a225 | KLRhodes | 2020-08-10 |
[[7]]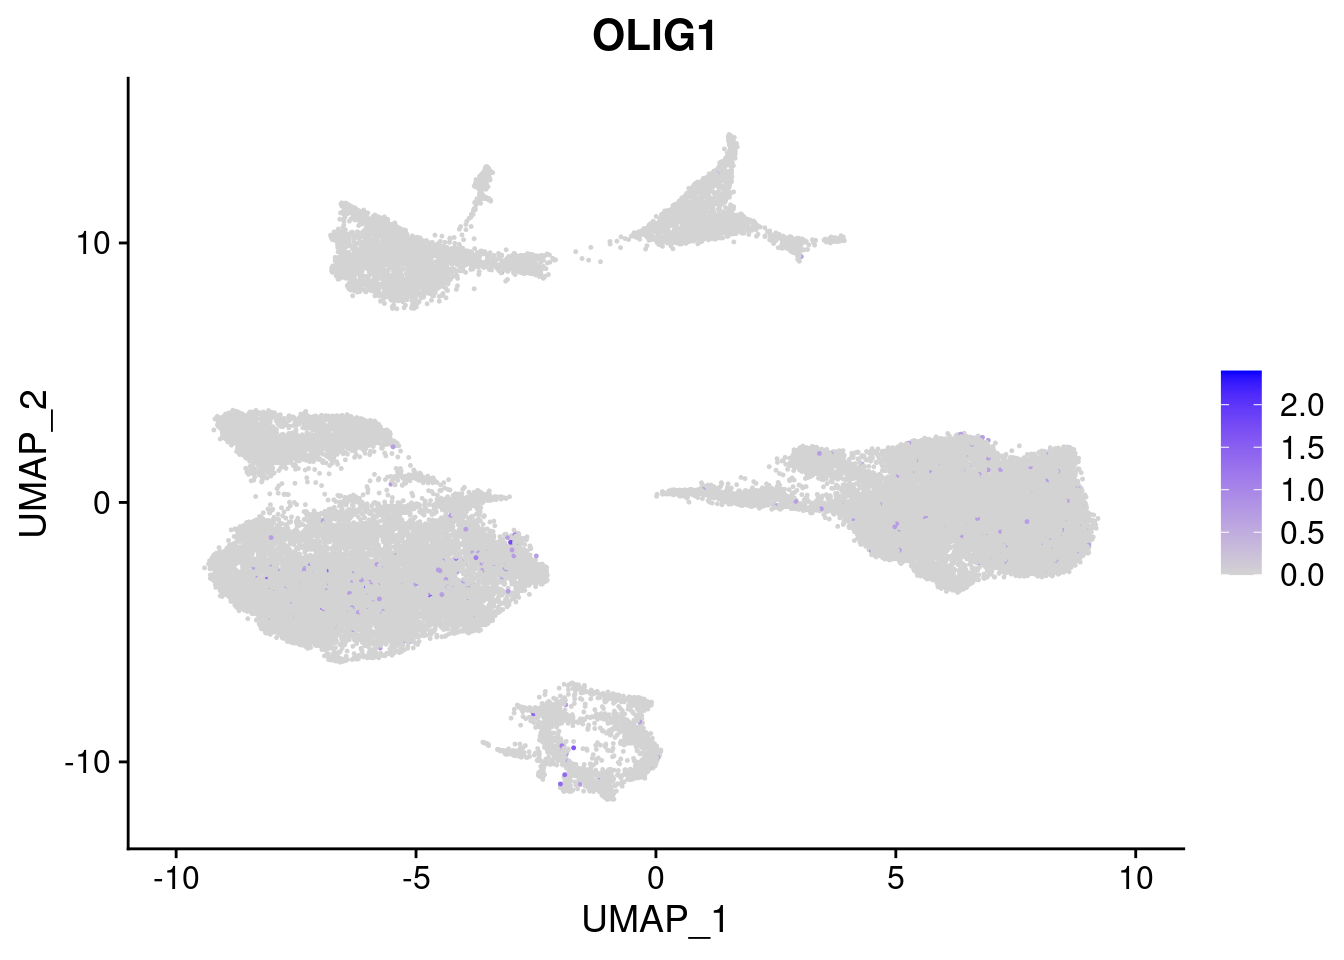
| Version | Author | Date |
|---|---|---|
| 421a225 | KLRhodes | 2020-08-10 |
[[8]]
| Version | Author | Date |
|---|---|---|
| 421a225 | KLRhodes | 2020-08-10 |
[[9]]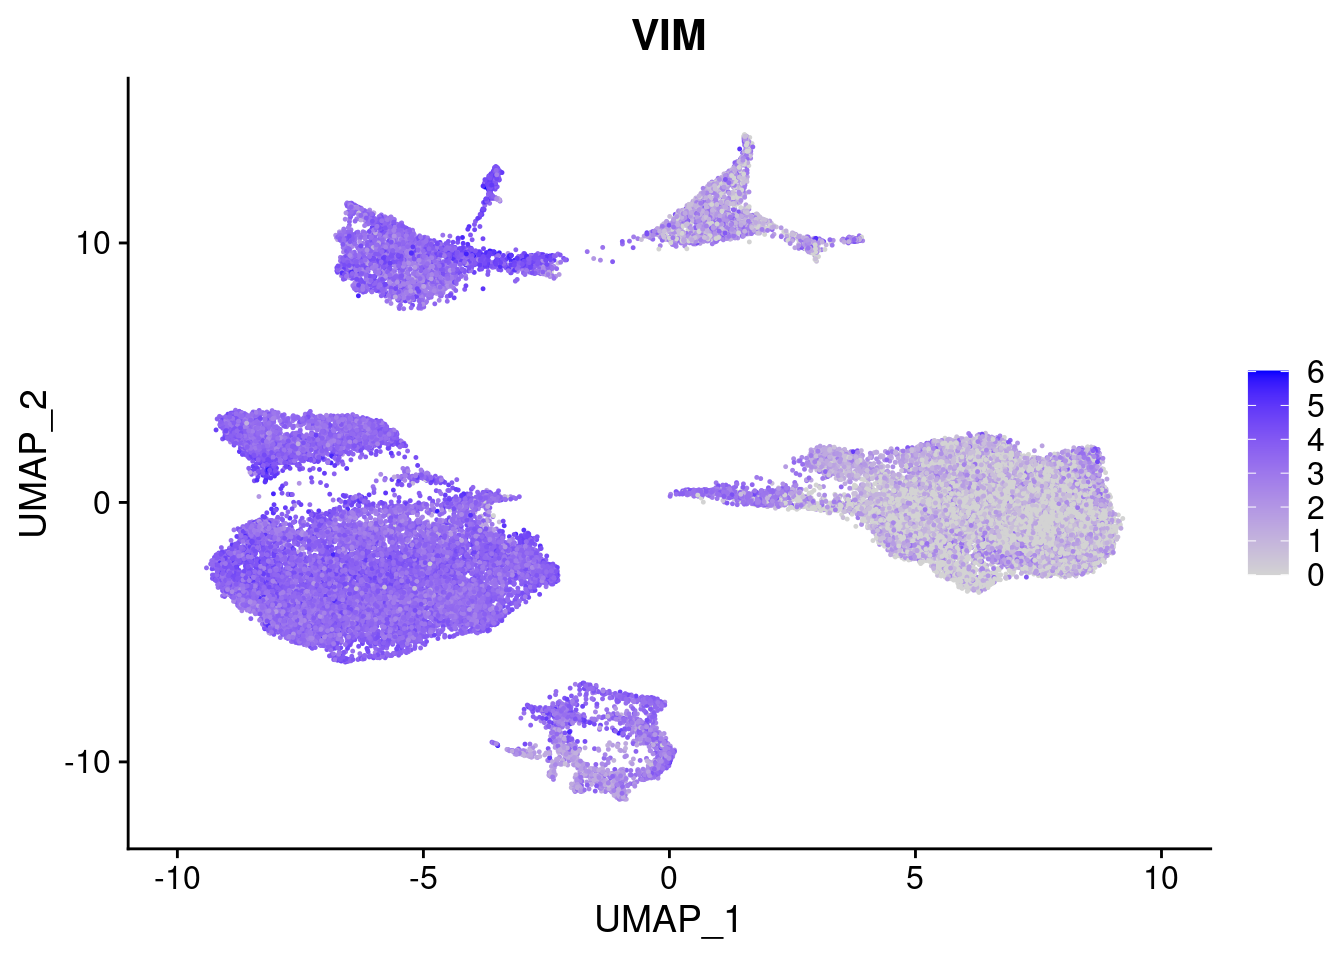
| Version | Author | Date |
|---|---|---|
| 421a225 | KLRhodes | 2020-08-10 |
[[10]]
| Version | Author | Date |
|---|---|---|
| 421a225 | KLRhodes | 2020-08-10 |
#More ectoderm, specifically neurons
#immature neurons: NEUROD1
#Mature Neurons: MAP2, SYP
#dopaminergic: TH, FOXA2,
FeaturePlot(merged, features = c("MAP2", "SYP","NEUROD1", "TH" ), pt.size = 0.2, ncol=3)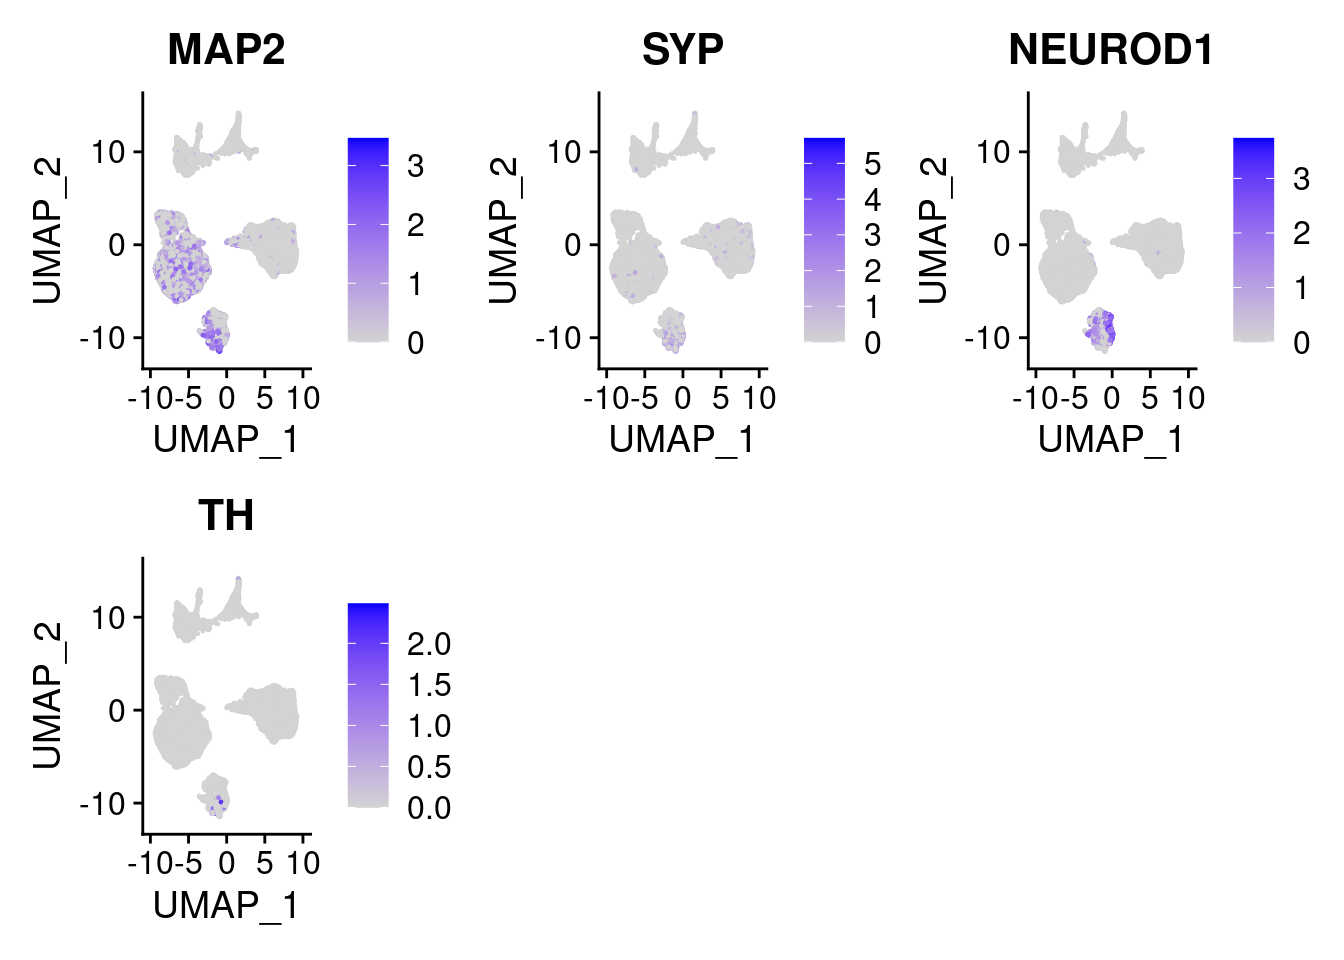
| Version | Author | Date |
|---|---|---|
| 421a225 | KLRhodes | 2020-08-10 |
Identify cluster markers
#how many cells per cluster?
t1<-table(merged@meta.data$SCT_snn_res.1, merged@meta.data$Batch)
t1
     Batch1 Batch2 Batch3
  0    3608   1884   2989
  1    2213   1263   1191
  2    1964    872    907
  3    1243    849   1510
  4    1359    427    870
  5     443    854    776
  6     794    239    549
  7     560    469    421
  8     255    276    835
  9     353    288    681
  10    457    427    360
  11    436    178    386
  12    357    116    427
  13    186    266    428
  14    471    156    247
  15    344    193    301
  16     13     56    693
  17    273    242    219
  18     32     83    551
  19    115    125    376
  20    270    117    220
  21    294    140     36
  22     82     77    245
  23    218     60    106
  24    135     71     98
  25    102     60    135
  26     92     37    100
  27    118     23     33
  28     86     17     60
#percent of cells in each cluster per batch
t1colsum<- colSums(t1)
percT1<-t1/t1colsum
percT1
          Batch1      Batch2      Batch3
  0  0.213832751 0.119619048 0.302990370
  1  0.224328434 0.074853316 0.075619048
  2  0.124698413 0.088393310 0.053754519
  3  0.073667990 0.053904762 0.153066396
  4  0.137759757 0.025306703 0.055238095
  5  0.028126984 0.086568677 0.045990636
  6  0.047057429 0.015174603 0.055651292
  7  0.056766346 0.027795887 0.026730159
  8  0.016190476 0.027977699 0.049487347
  9  0.020920998 0.018285714 0.069031931
  10 0.046325393 0.025306703 0.022857143
  11 0.027682540 0.018043588 0.022876785
  12 0.021158063 0.007365079 0.043284339
  13 0.018854536 0.015764831 0.027174603
  14 0.029904762 0.015813482 0.014638772
  15 0.020387601 0.012253968 0.030511911
  16 0.001317790 0.003318912 0.044000000
  17 0.017333333 0.024531171 0.012979316
  18 0.001896521 0.005269841 0.055854029
  19 0.011657375 0.007408285 0.023873016
  20 0.017142857 0.011860112 0.013038582
  21 0.017424287 0.008888889 0.003649265
  22 0.008312215 0.004563504 0.015555556
  23 0.013841270 0.006082108 0.006282226
  24 0.008000948 0.004507937 0.009934110
  25 0.010339584 0.003555977 0.008571429
  26 0.005841270 0.003750634 0.005926628
  27 0.006993421 0.001460317 0.003345160
  28 0.008717689 0.001007527 0.003809524
heatmap(t(percT1))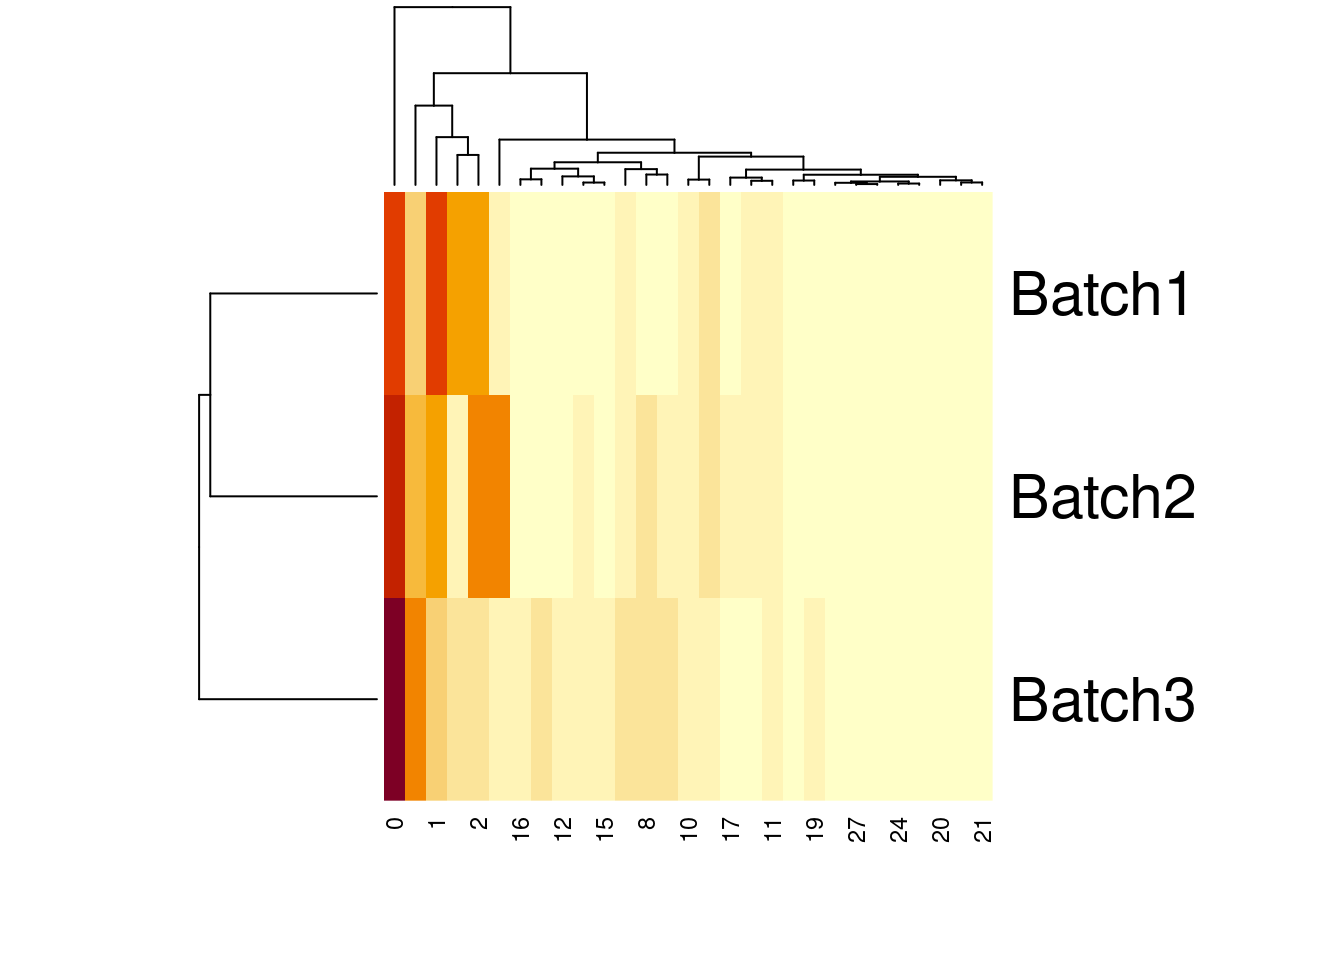
| Version | Author | Date |
|---|---|---|
| 421a225 | KLRhodes | 2020-08-10 |
#how many cells per cluster from each individual?
t2<-table(merged@meta.data$SCT_snn_res.1, merged@meta.data$individual)
t2
     SNG-NA18511 SNG-NA18858 SNG-NA19160
  0          322        7991         168
  1         3094         237        1336
  2         1758         271        1714
  3          223        3294          85
  4          824          38        1794
  5          125        1803         145
  6          167          41        1374
  7          937         107         406
  8          512          55         799
  9          627         162         533
  10         112        1026         106
  11         121          13         866
  12          84          12         804
  13         349         140         391
  14          88          18         768
  15         543          39         256
  16         487           6         269
  17         416          61         257
  18         399           3         264
  19         163          20         433
  20          55         528          24
  21         137         310          23
  22         111           6         287
  23          86         105         193
  24         101           4         199
  25          89           6         202
  26          18         201          10
  27           1         173           0
  28           0           0         163
t2colsums<-colSums(t2)
percT2<- t2/t2colsums
percT2
      SNG-NA18511  SNG-NA18858  SNG-NA19160
  0  2.694786e-02 5.761771e-01 1.007798e-02
  1  1.856029e-01 1.983430e-02 9.632994e-02
  2  1.267575e-01 1.625675e-02 1.434430e-01
  3  1.866265e-02 2.375081e-01 5.098980e-03
  4  4.943011e-02 3.180182e-03 1.293532e-01
  5  9.012906e-03 1.081584e-01 1.213491e-02
  6  1.397606e-02 2.956233e-03 8.242352e-02
  7  5.620876e-02 8.954724e-03 2.927392e-02
  8  3.691686e-02 3.299340e-03 6.686752e-02
  9  5.247301e-02 1.168073e-02 3.197361e-02
  10 6.718656e-03 8.586493e-02 7.642945e-03
  11 8.724493e-03 7.798440e-04 7.247468e-02
  12 7.029877e-03 8.652390e-04 4.823035e-02
  13 2.093581e-02 1.171646e-02 2.819237e-02
  14 6.345086e-03 1.079784e-03 6.427316e-02
  15 4.544313e-02 2.812027e-03 1.535693e-02
  16 2.921416e-02 5.021341e-04 1.939577e-02
  17 2.999495e-02 3.659268e-03 2.150808e-02
  18 3.339192e-02 2.163098e-04 1.583683e-02
  19 9.778044e-03 1.673780e-03 3.122071e-02
  20 3.965679e-03 3.167367e-02 2.008536e-03
  21 1.146539e-02 2.235201e-02 1.379724e-03
  22 6.658668e-03 5.021341e-04 2.069363e-02
  23 6.200880e-03 6.298740e-03 1.615198e-02
  24 8.452590e-03 2.884130e-04 1.193761e-02
  25 5.338932e-03 5.021341e-04 1.456486e-02
  26 1.297859e-03 1.205759e-02 8.368901e-04
  27 8.368901e-05 1.247386e-02 0.000000e+00
  28 0.000000e+00 0.000000e+00 1.175283e-02
heatmap(t(percT2))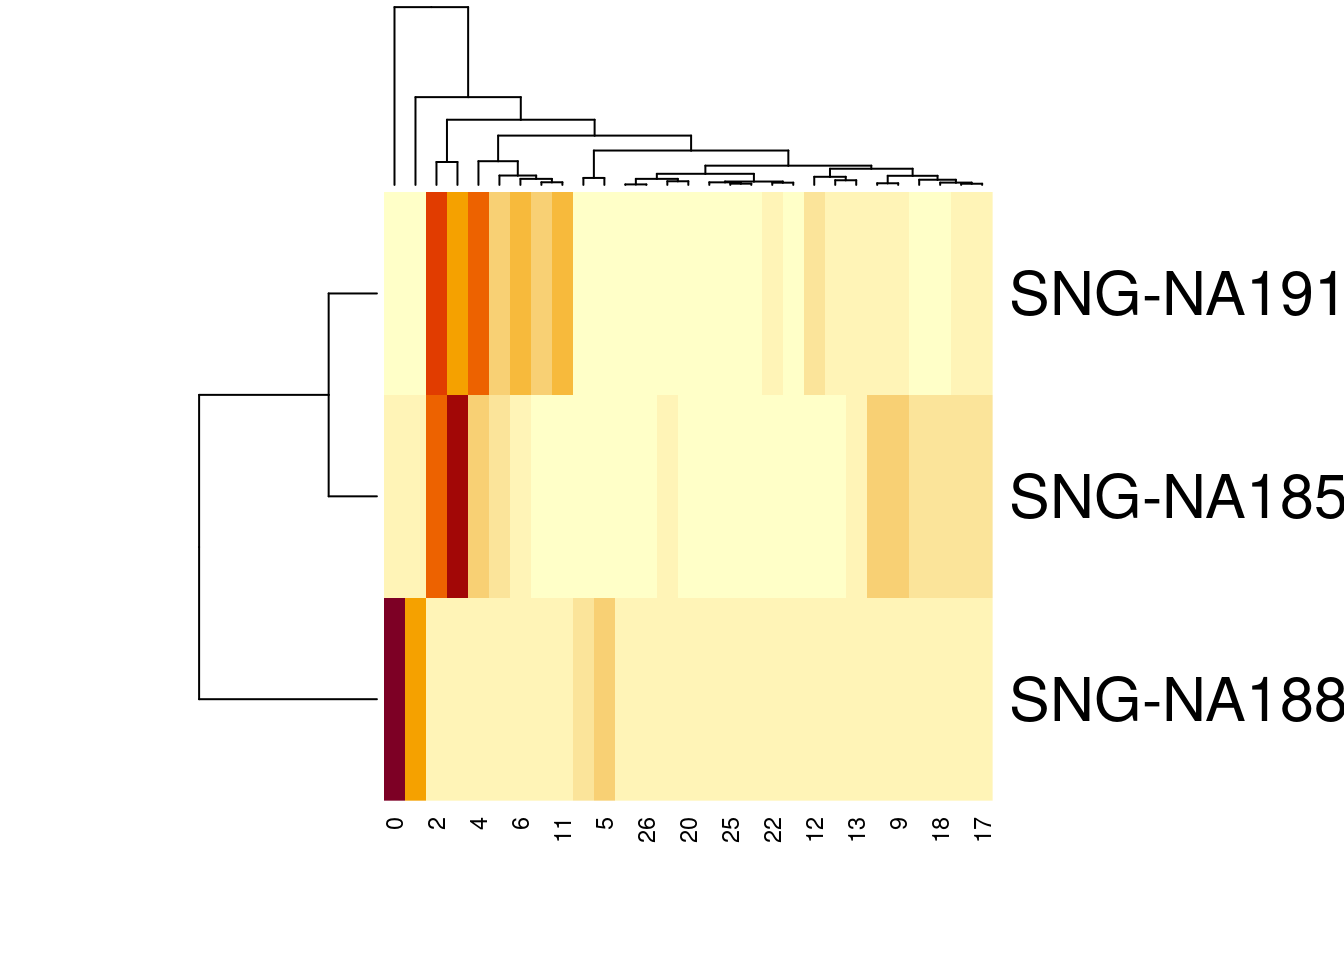
| Version | Author | Date |
|---|---|---|
| 421a225 | KLRhodes | 2020-08-10 |
cormat<-round(cor(percT2),2)
library(reshape2)
melted_cormat<-melt(cormat)
ugly<-ggplot(data= melted_cormat, aes(x=Var1, y=Var2, fill=value)) +
  geom_tile() +
  ggtitle("Pairwise Pearson Correlation of the percent of cells from \neach cell line assigned to each Seurat Cluster")

get_lower_tri<- function(cormat){
  cormat[upper.tri(cormat)]<-NA
  return(cormat)
}

lower_tri<- get_lower_tri(cormat)
melted_tri<- melt(lower_tri)
pretty<-ggplot(data= melted_tri, aes(x=Var1, y=Var2, fill=value)) +
  geom_tile(color="white") +
  scale_fill_gradient2(low="blue", high="red", mid="white", midpoint = 0, limit= c(-1,1), space= "Lab", name="Pearson\nCorrelation") +
  theme_minimal() +
  ggtitle("Pairwise Pearson Correlation of the percent of cells from \neach cell line assigned to each Seurat Cluster")

pretty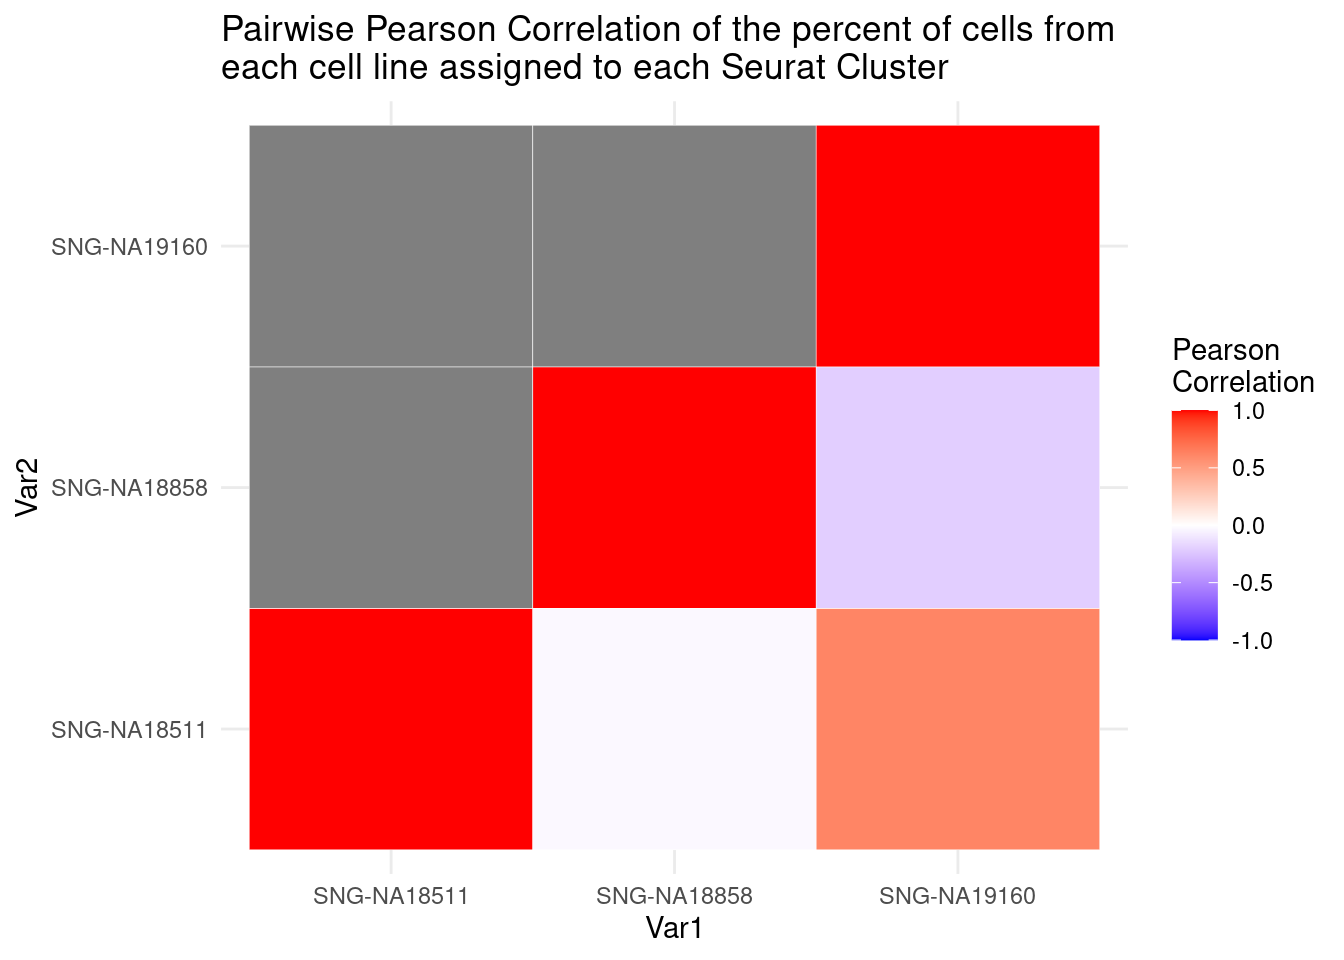
| Version | Author | Date |
|---|---|---|
| 421a225 | KLRhodes | 2020-08-10 |
#exploring similarity in the number of cells per individual between batches
merged.Batch1<- (subset(merged, Batch == "Batch1"))
b1t<- table(merged.Batch1$SCT_snn_res.1, merged.Batch1$individual)
remove("merged.Batch1")
b1tcolsums<- colSums(b1t)
percb1t<- b1t/b1tcolsums

merged.Batch2<- (subset(merged, Batch == "Batch2"))
b2t<- table(merged.Batch2$SCT_snn_res.1, merged.Batch2$individual)
remove("merged.Batch2")
b2tcolsums<- colSums(b2t)
percb2t<- b2t/b2tcolsums

merged.Batch3<- (subset(merged, Batch == "Batch3"))
b3t<- table(merged.Batch3$SCT_snn_res.1, merged.Batch3$individual)
remove("merged.Batch3")
b3tcolsums<- colSums(b3t)
percb3t<- b3t/b3tcolsums
cols1<- c("Batch1_18511","Batch1_18858","Batch1_19160", "Batch2_18511", "Batch2_18858","Batch2_19160",
"Batch3_18511","Batch3_18858", "Batch3_19160")
cols2<- c("Batch1_18511", "Batch2_18511", "Batch3_18511","Batch1_18858", "Batch2_18858", "Batch3_18858","Batch1_19160", "Batch2_19160", "Batch3_19160")
fullpercs<- as.data.frame(cbind(percb1t[,1:3], percb2t,percb3t))
colnames(fullpercs)<-cols1
fullpercs<- cbind(fullpercs$Batch1_18511, fullpercs$Batch2_18511, fullpercs$Batch3_18511,
fullpercs$Batch1_18858, fullpercs$Batch2_18858, fullpercs$Batch3_18858,
fullpercs$Batch1_19160, fullpercs$Batch2_19160, fullpercs$Batch3_19160)
colnames(fullpercs)<-cols2
fullpercs_cor<- round(cor(fullpercs),2)
fullpercs_melt<- melt(fullpercs_cor)
ggplot(data= fullpercs_melt, aes(x=Var1, y=Var2, fill=value)) +
geom_tile(color="white") +
scale_fill_gradient2(low="blue", high="red", mid="white", midpoint = 0, limit= c(-1,1), space= "Lab", name="Pearson\nCorrelation") +
theme_minimal() +
theme(axis.text.x = element_text(angle = 30, hjust=1))+
ggtitle("Pairwise Pearson Correlation of the percent of cells from \neach cell line assigned to each Seurat Cluster (res 1)")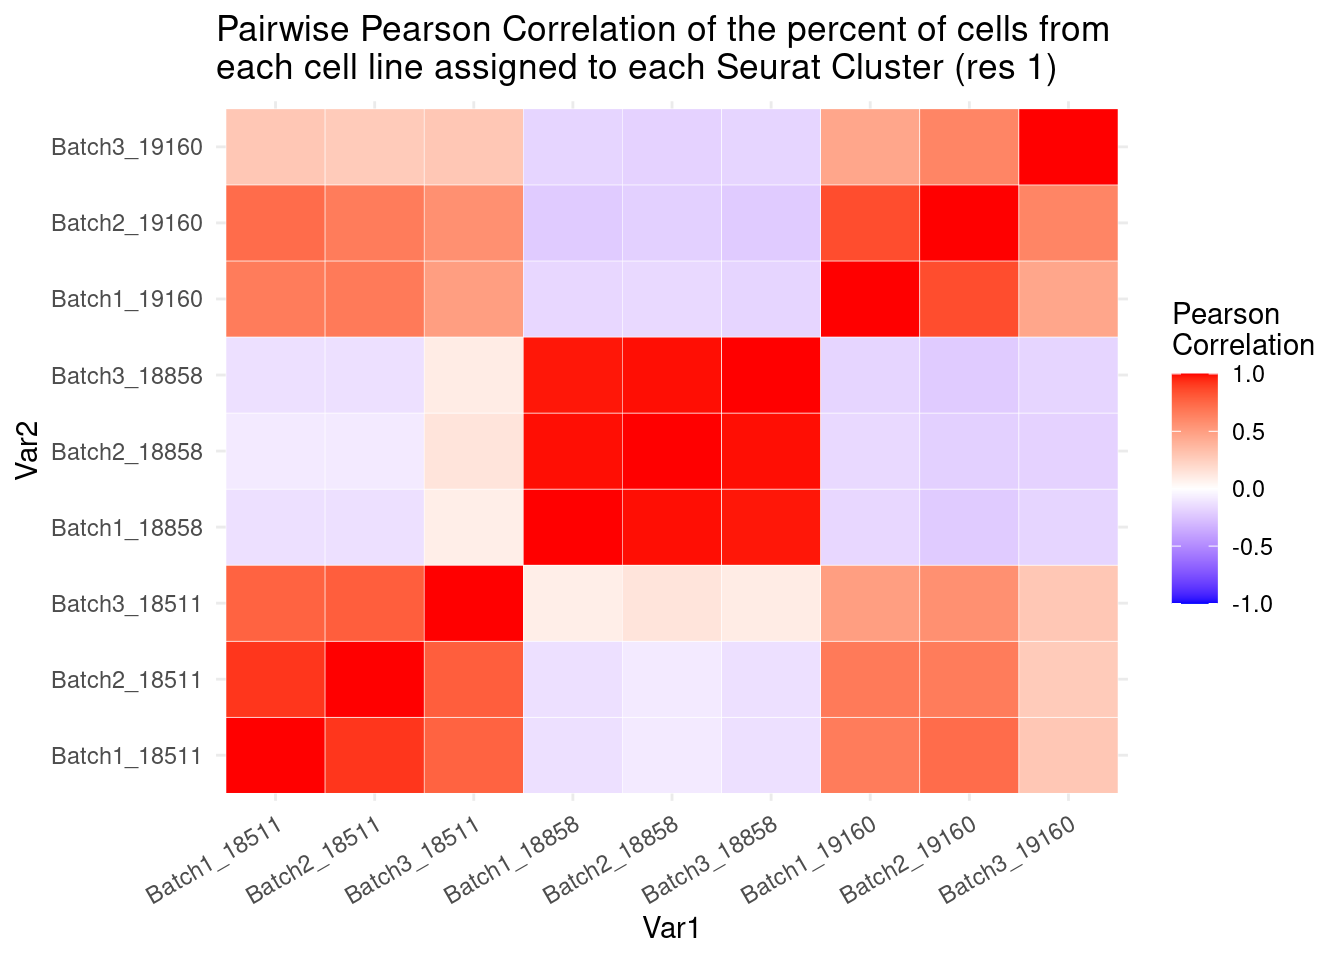
| Version | Author | Date |
|---|---|---|
| 421a225 | KLRhodes | 2020-08-10 |
#now clustering individual_Batch samples with hierarchical clustering/they will get reordered based on similarity

beauty<- colorRampPalette(brewer.pal(9,"Purples"))(200)

rownames(fullpercs)<- c(0:(nrow(fullpercs)-1))

heatmap(as.matrix(fullpercs), scale="none", col=beauty, cexCol = .7, cexRow=.6)
text(1:ncol(fullpercs),labels=names(fullpercs),srt=30)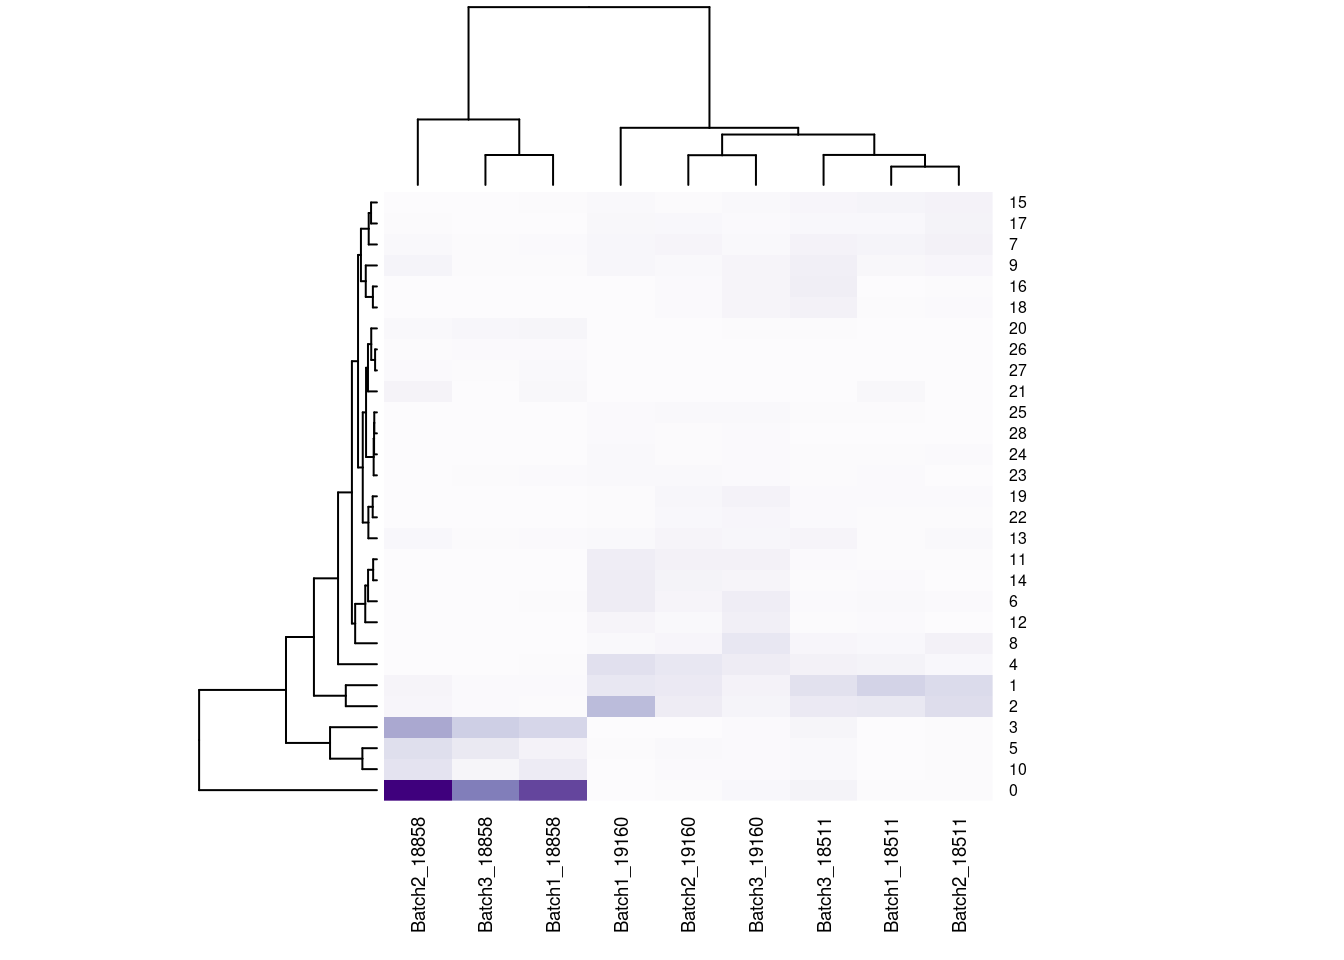
| Version | Author | Date |
|---|---|---|
| 421a225 | KLRhodes | 2020-08-10 |
#generate a heatmap of the proportion of cells from each individual_batch in each seurat cluster. dendrograms based on similarity of the vectors. should be colored by the value(proportion), but some of the cluster/sample values to seem to match with the colorReclustering with less resolution, check if everything is robust
#reassign idents
Idents(merged)<- 'SCT_snn_res.0.5'
DimPlot(merged, reduction = "umap")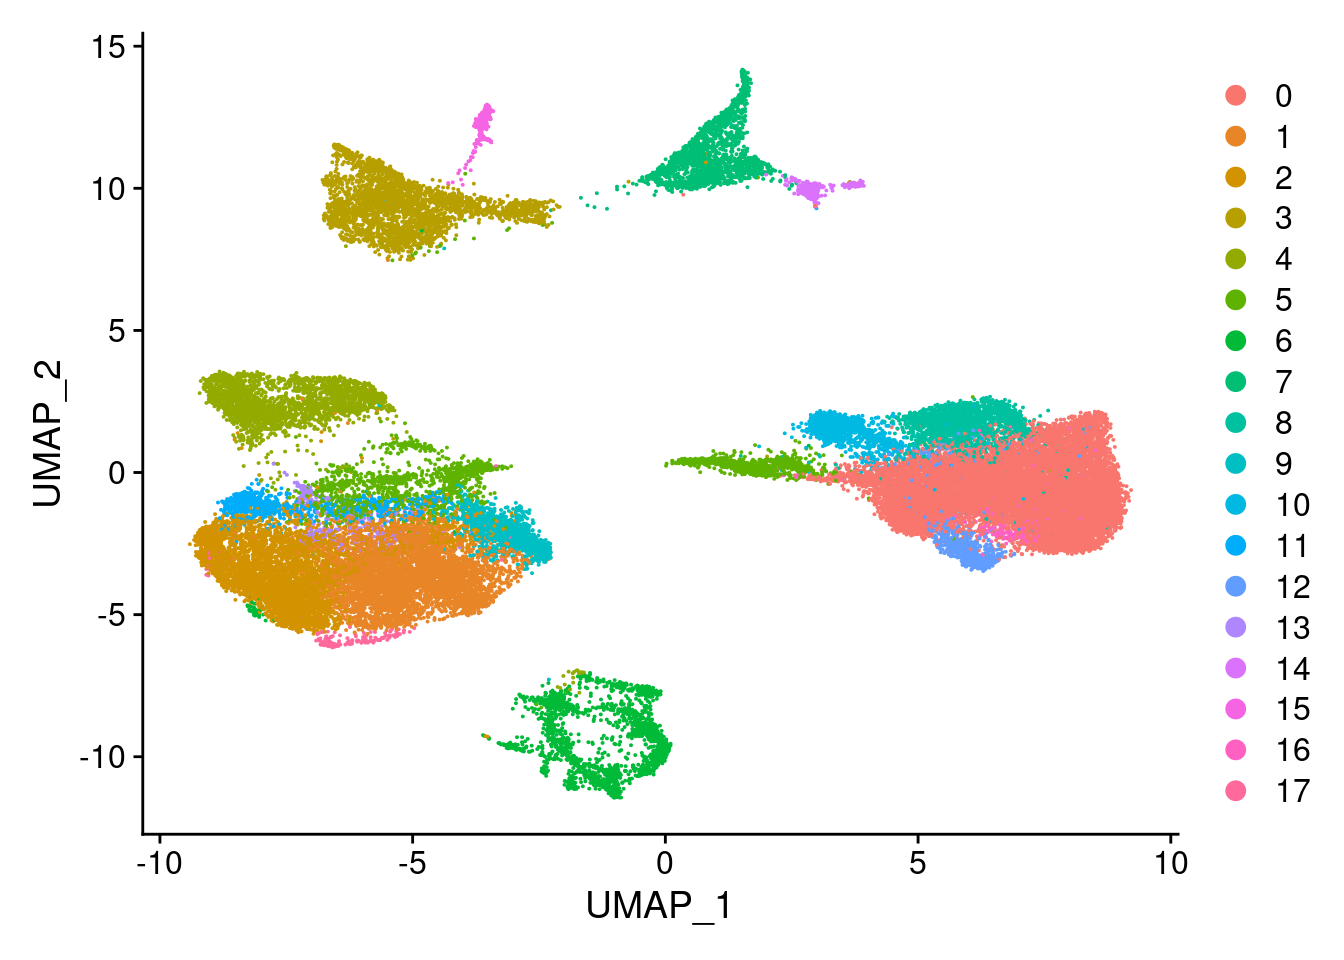
| Version | Author | Date |
|---|---|---|
| 421a225 | KLRhodes | 2020-08-10 |
DimPlot(merged, reduction = "umap", group.by = "Batch")
| Version | Author | Date |
|---|---|---|
| 421a225 | KLRhodes | 2020-08-10 |
DimPlot(merged, reduction = "umap", group.by = "individual")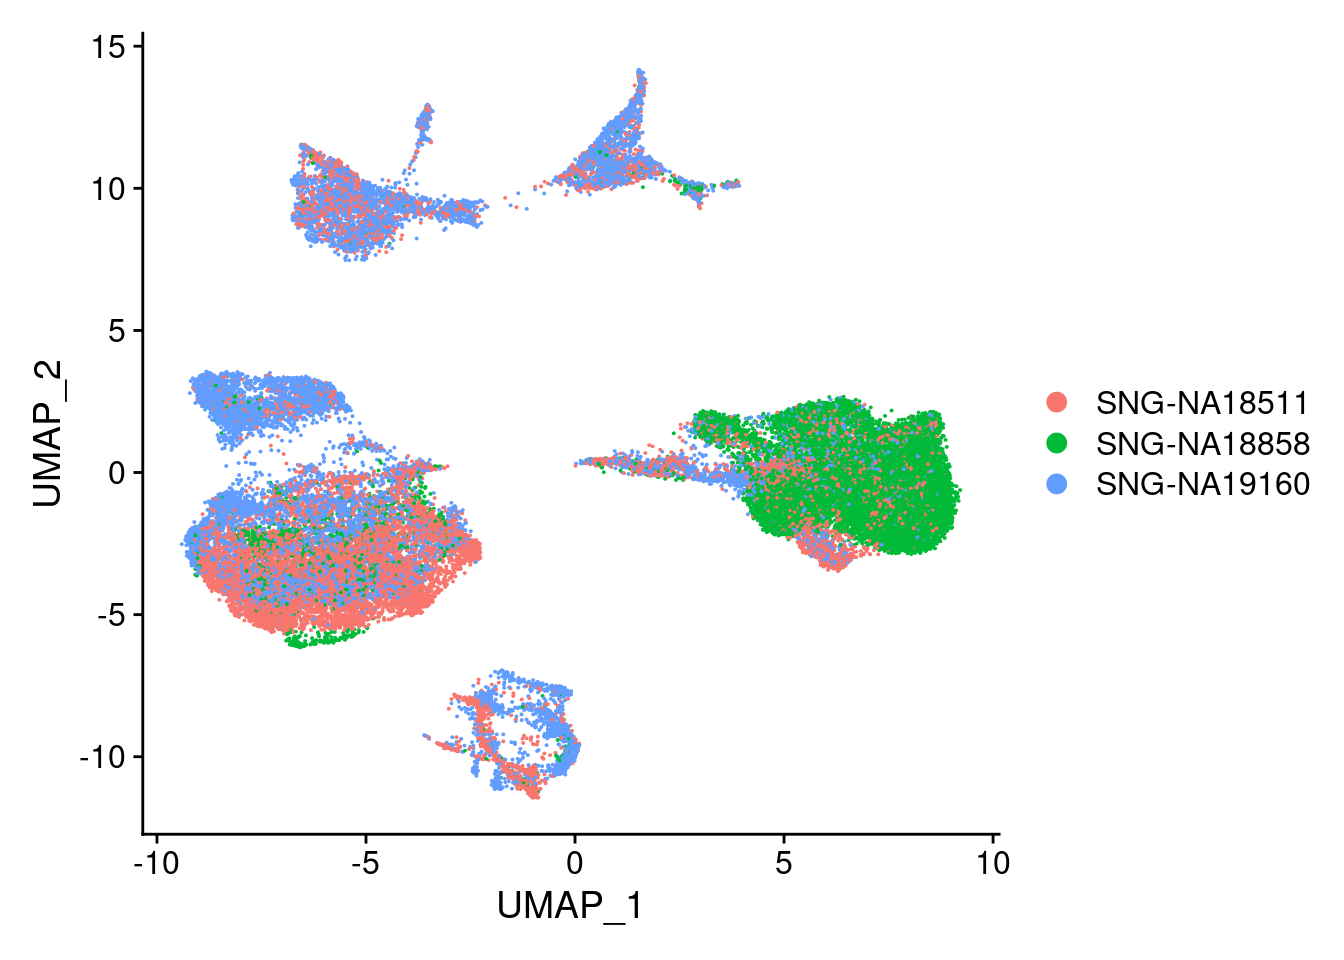
| Version | Author | Date |
|---|---|---|
| 421a225 | KLRhodes | 2020-08-10 |
xlim <- c(min(merged@reductions$umap@cell.embeddings[,'UMAP_1']),
max(merged@reductions$umap@cell.embeddings[,'UMAP_1']))
ylim <- c(min(merged@reductions$umap@cell.embeddings[,'UMAP_2']),
max(merged@reductions$umap@cell.embeddings[,'UMAP_2']))
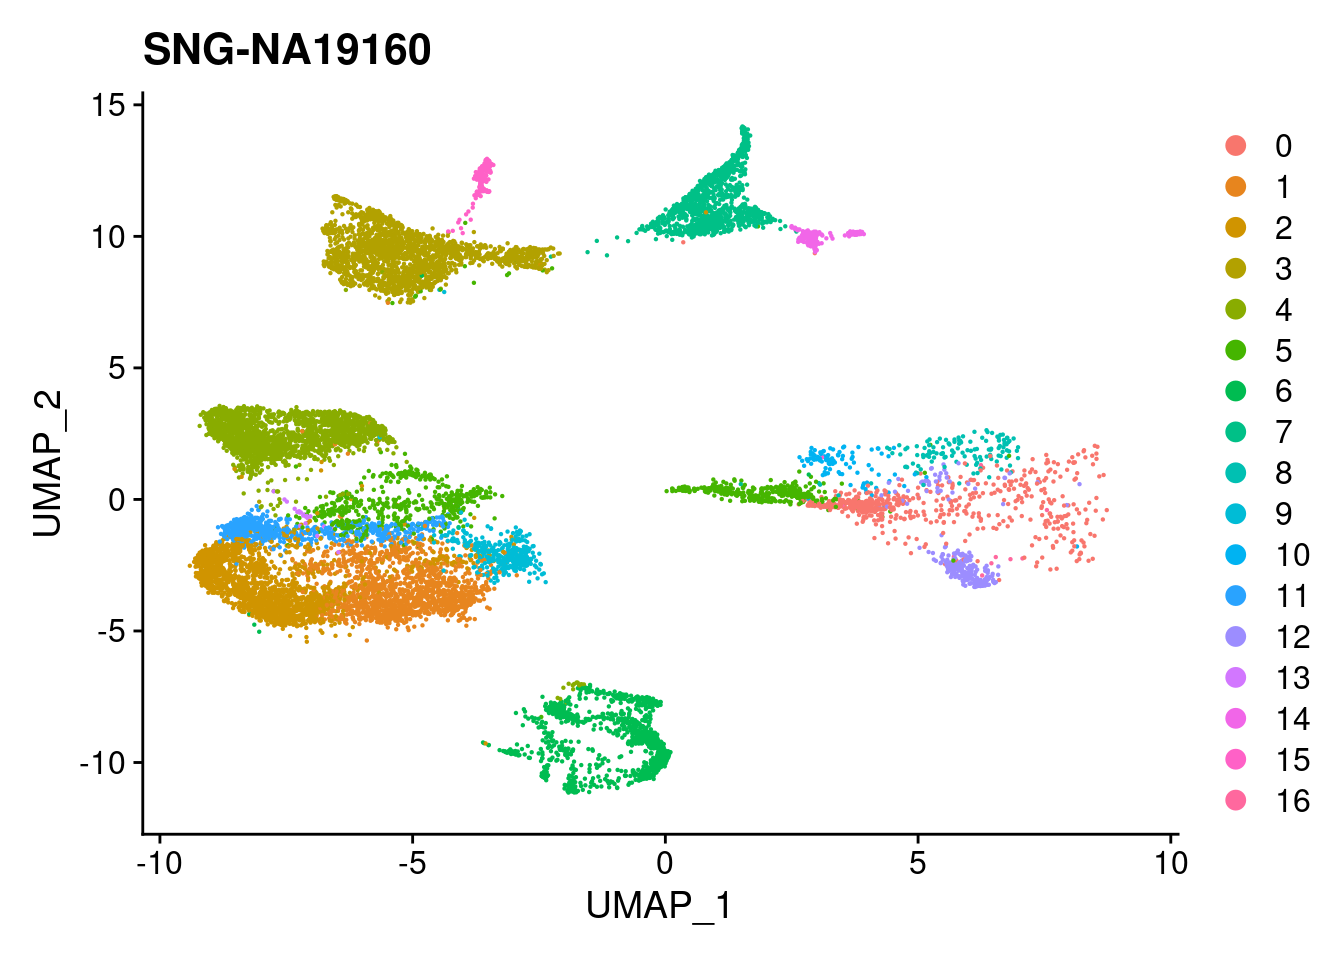
for (i in individuals)
{
print(DimPlot(merged, reduction = "umap",
cells = WhichCells(merged, expression = individual == i)) +
xlim(xlim) + ylim(ylim) + ggtitle(i))
}
| Version | Author | Date |
|---|---|---|
| 421a225 | KLRhodes | 2020-08-10 |
| Version | Author | Date |
|---|---|---|
| 421a225 | KLRhodes | 2020-08-10 |
| Version | Author | Date |
|---|---|---|
| 421a225 | KLRhodes | 2020-08-10 |
#exploring similarity in the number of cells per individual between batches
merged.Batch1<- (subset(merged, Batch == "Batch1"))
b1t<- table(merged.Batch1$SCT_snn_res.0.5, merged.Batch1$individual)
remove("merged.Batch1")
b1tcolsums<- colSums(b1t)
percb1t<- b1t/b1tcolsums

merged.Batch2<- (subset(merged, Batch == "Batch2"))
b2t<- table(merged.Batch2$SCT_snn_res.0.5, merged.Batch2$individual)
remove("merged.Batch2")
b2tcolsums<- colSums(b2t)
percb2t<- b2t/b2tcolsums

merged.Batch3<- (subset(merged, Batch == "Batch3"))
b3t<- table(merged.Batch3$SCT_snn_res.0.5, merged.Batch3$individual)
remove("merged.Batch3")
b3tcolsums<- colSums(b3t)
percb3t<- b3t/b3tcolsums
cols1<- c("Batch1_18511","Batch1_18858","Batch1_19160", "Batch2_18511", "Batch2_18858","Batch2_19160",
"Batch3_18511","Batch3_18858", "Batch3_19160")
cols2<- c("Batch1_18511", "Batch2_18511", "Batch3_18511","Batch1_18858", "Batch2_18858", "Batch3_18858","Batch1_19160", "Batch2_19160", "Batch3_19160")
fullpercs<- as.data.frame(cbind(percb1t[,1:3], percb2t,percb3t))
colnames(fullpercs)<-cols1
fullpercs<- cbind(fullpercs$Batch1_18511, fullpercs$Batch2_18511, fullpercs$Batch3_18511,
fullpercs$Batch1_18858, fullpercs$Batch2_18858, fullpercs$Batch3_18858,
fullpercs$Batch1_19160, fullpercs$Batch2_19160, fullpercs$Batch3_19160)
colnames(fullpercs)<-cols2
fullpercs_cor<- round(cor(fullpercs),2)
fullpercs_melt<- melt(fullpercs_cor)
ggplot(data= fullpercs_melt, aes(x=Var1, y=Var2, fill=value)) +
geom_tile(color="white") +
scale_fill_gradient2(low="blue", high="red", mid="white", midpoint = 0, limit= c(-1,1), space= "Lab", name="Pearson\nCorrelation") +
theme_minimal() +
theme(axis.text.x = element_text(angle = 30, hjust=1))+
ggtitle("Pairwise Pearson Correlation of the percent of cells from \neach cell line assigned to each Seurat Cluster\ncluster res. 0.5")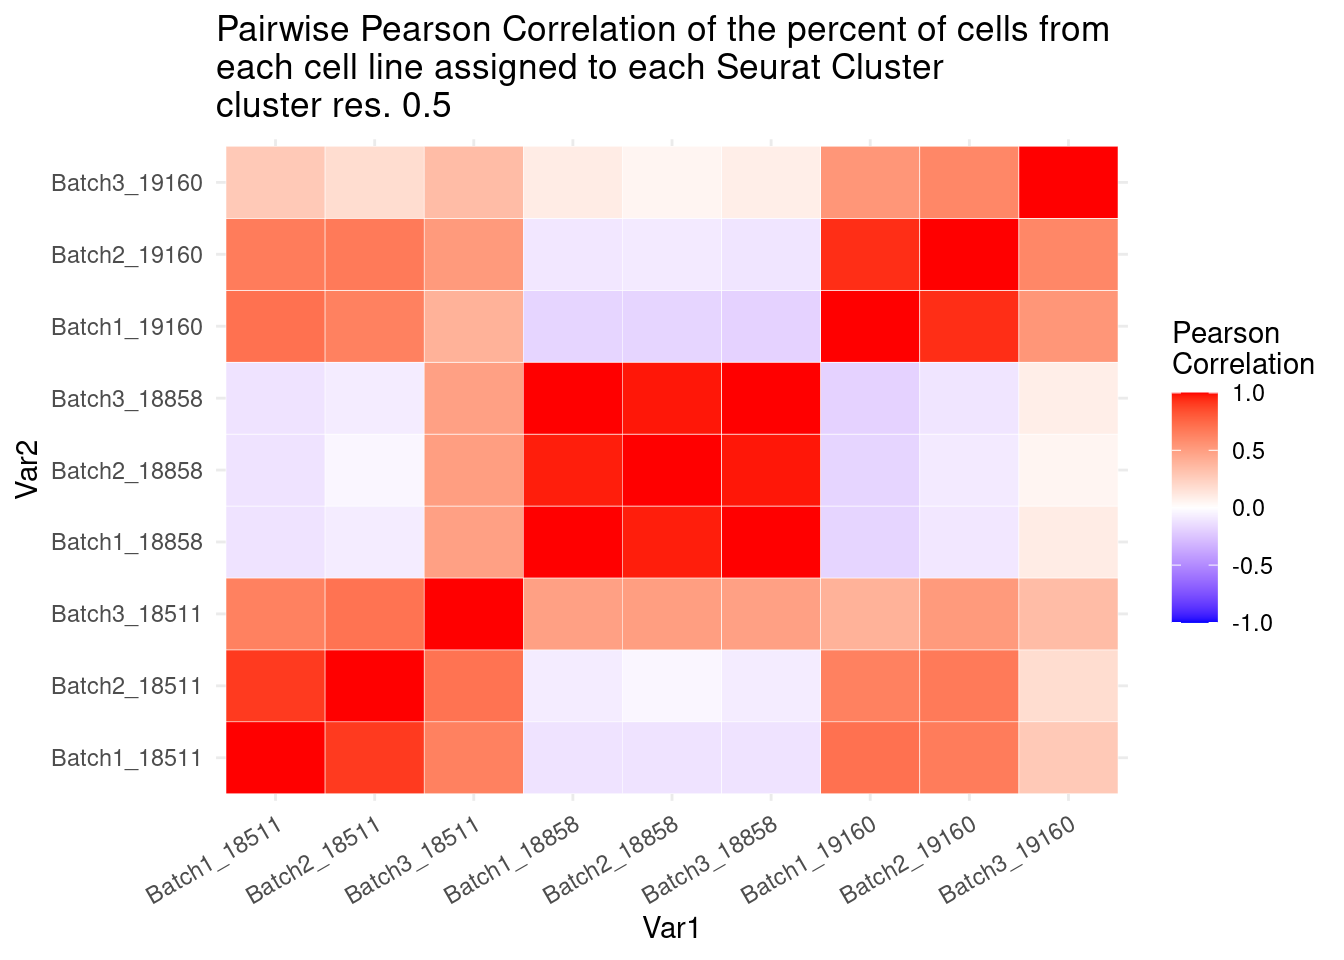
| Version | Author | Date |
|---|---|---|
| 421a225 | KLRhodes | 2020-08-10 |
#now clustering individual_Batch samples with hierarchical clustering/they will get reordered based on similarity

beauty<- colorRampPalette(brewer.pal(9,"Purples"))(200)

rownames(fullpercs)<- c(0:(nrow(fullpercs)-1))

heatmap(as.matrix(fullpercs), scale="none", col=beauty, cexCol = .7, cexRow=.6)
text(1:ncol(fullpercs),labels=names(fullpercs),srt=30)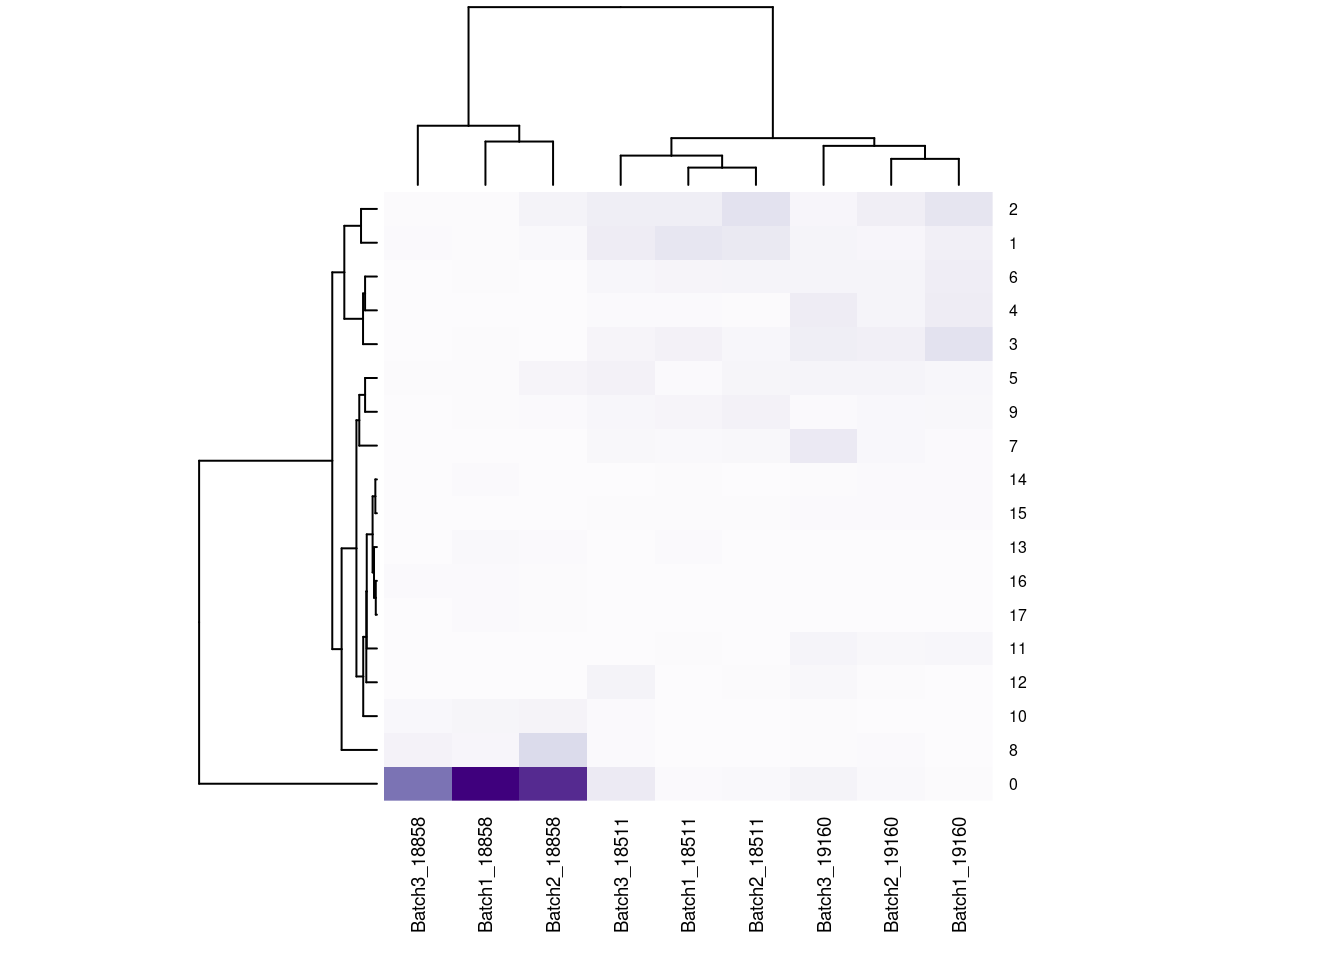
| Version | Author | Date |
|---|---|---|
| 421a225 | KLRhodes | 2020-08-10 |
#generate a heatmap of the raw proportion of cells from each individual_batch in each seurat cluster. dendrograms based on similarity of the vectors. should be colored by the value(proportion), but some of the cluster/sample values to seem to match with the color#reassign idents
Idents(merged)<- 'SCT_snn_res.0.1'DimPlot(merged, reduction = "umap")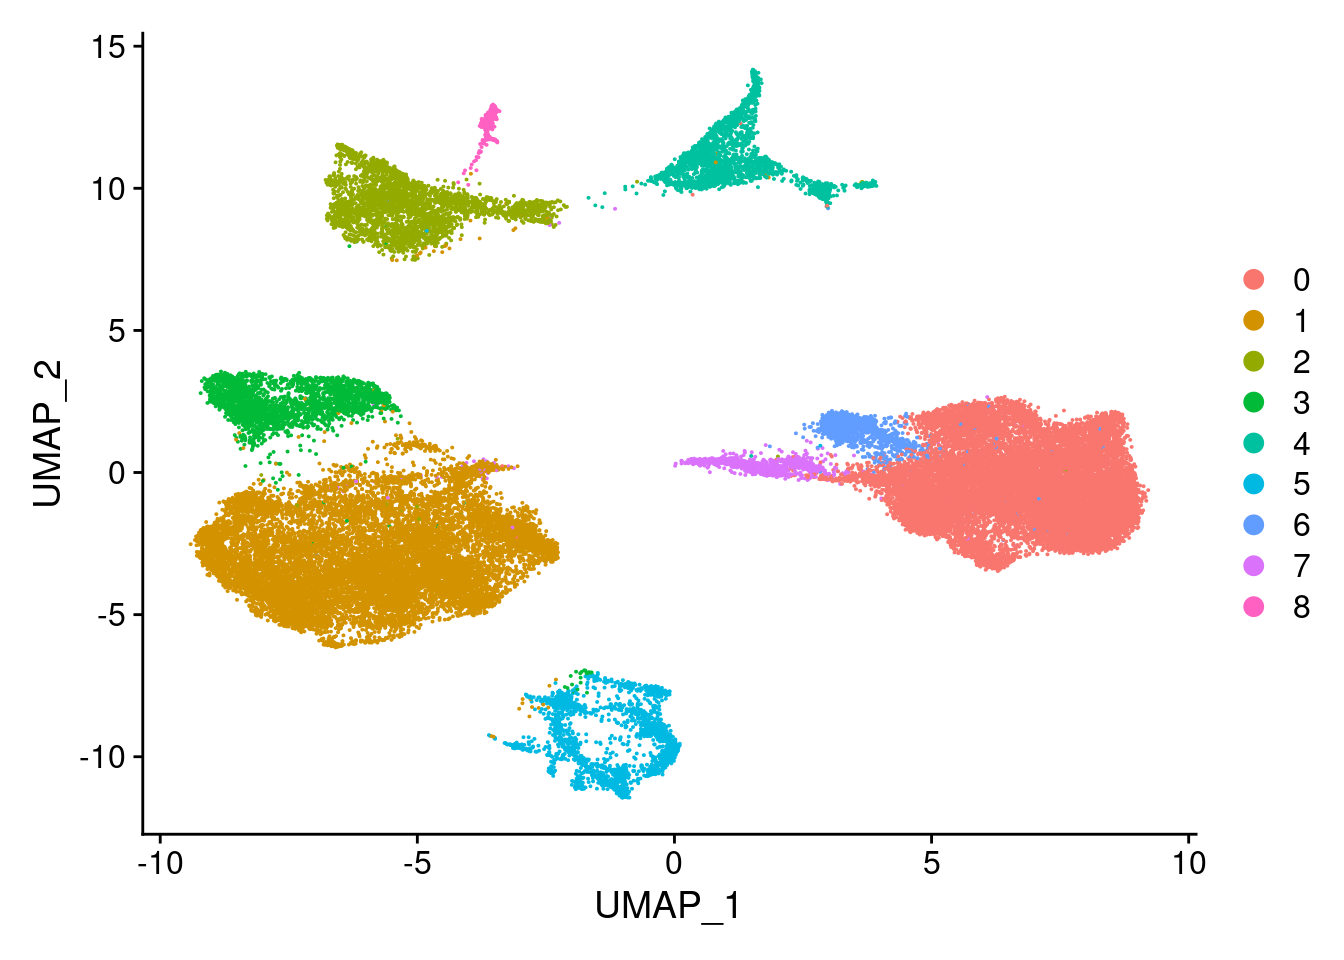
| Version | Author | Date |
|---|---|---|
| 421a225 | KLRhodes | 2020-08-10 |
DimPlot(merged, reduction = "umap", group.by = "Batch")
| Version | Author | Date |
|---|---|---|
| 421a225 | KLRhodes | 2020-08-10 |
DimPlot(merged, reduction = "umap", group.by = "individual")
| Version | Author | Date |
|---|---|---|
| 421a225 | KLRhodes | 2020-08-10 |
xlim <- c(min(merged@reductions$umap@cell.embeddings[,'UMAP_1']),
max(merged@reductions$umap@cell.embeddings[,'UMAP_1']))
ylim <- c(min(merged@reductions$umap@cell.embeddings[,'UMAP_2']),
max(merged@reductions$umap@cell.embeddings[,'UMAP_2']))
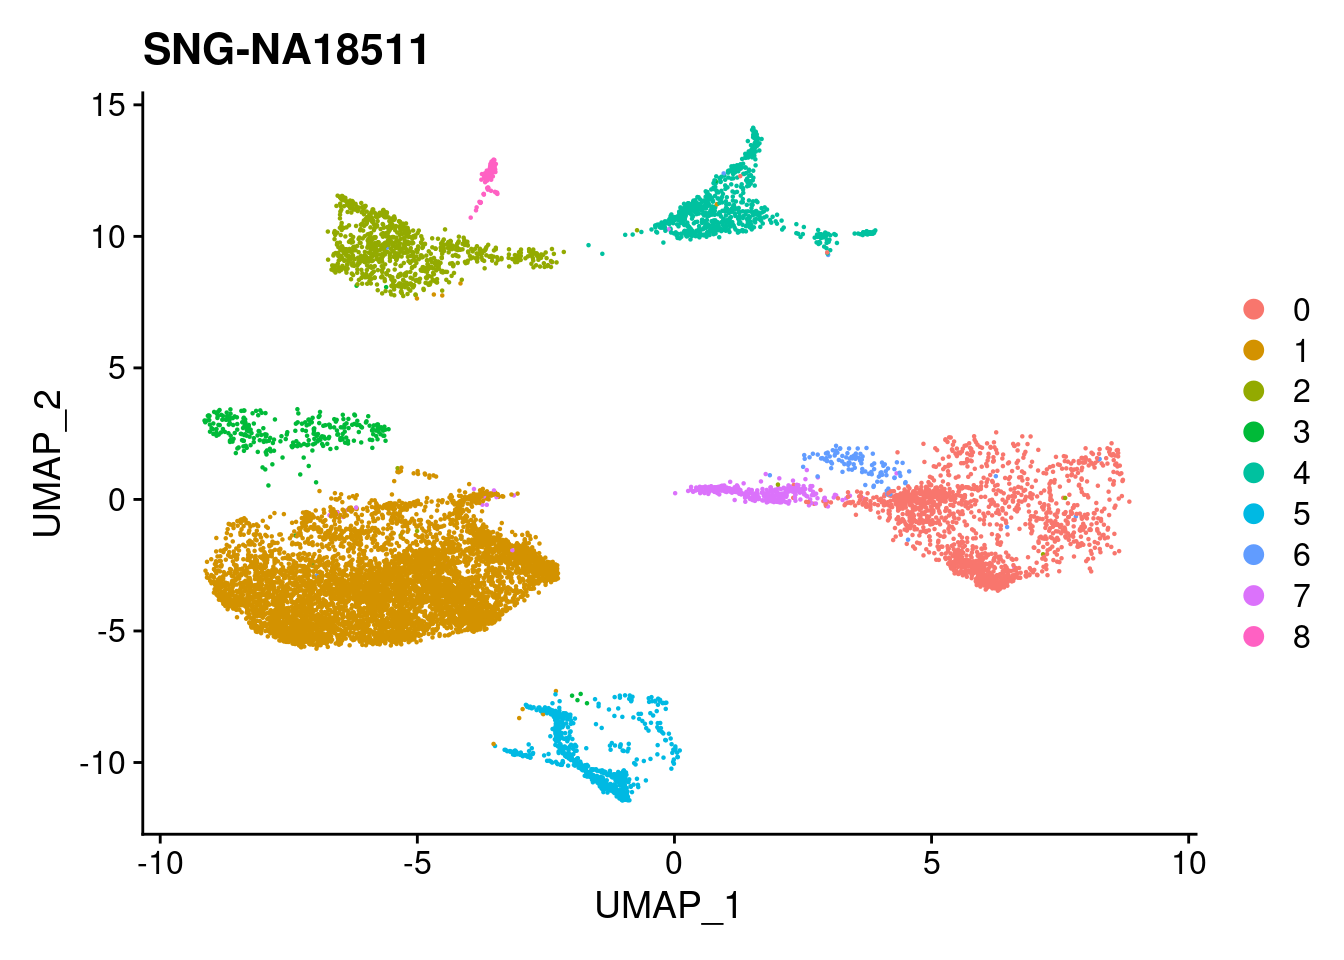
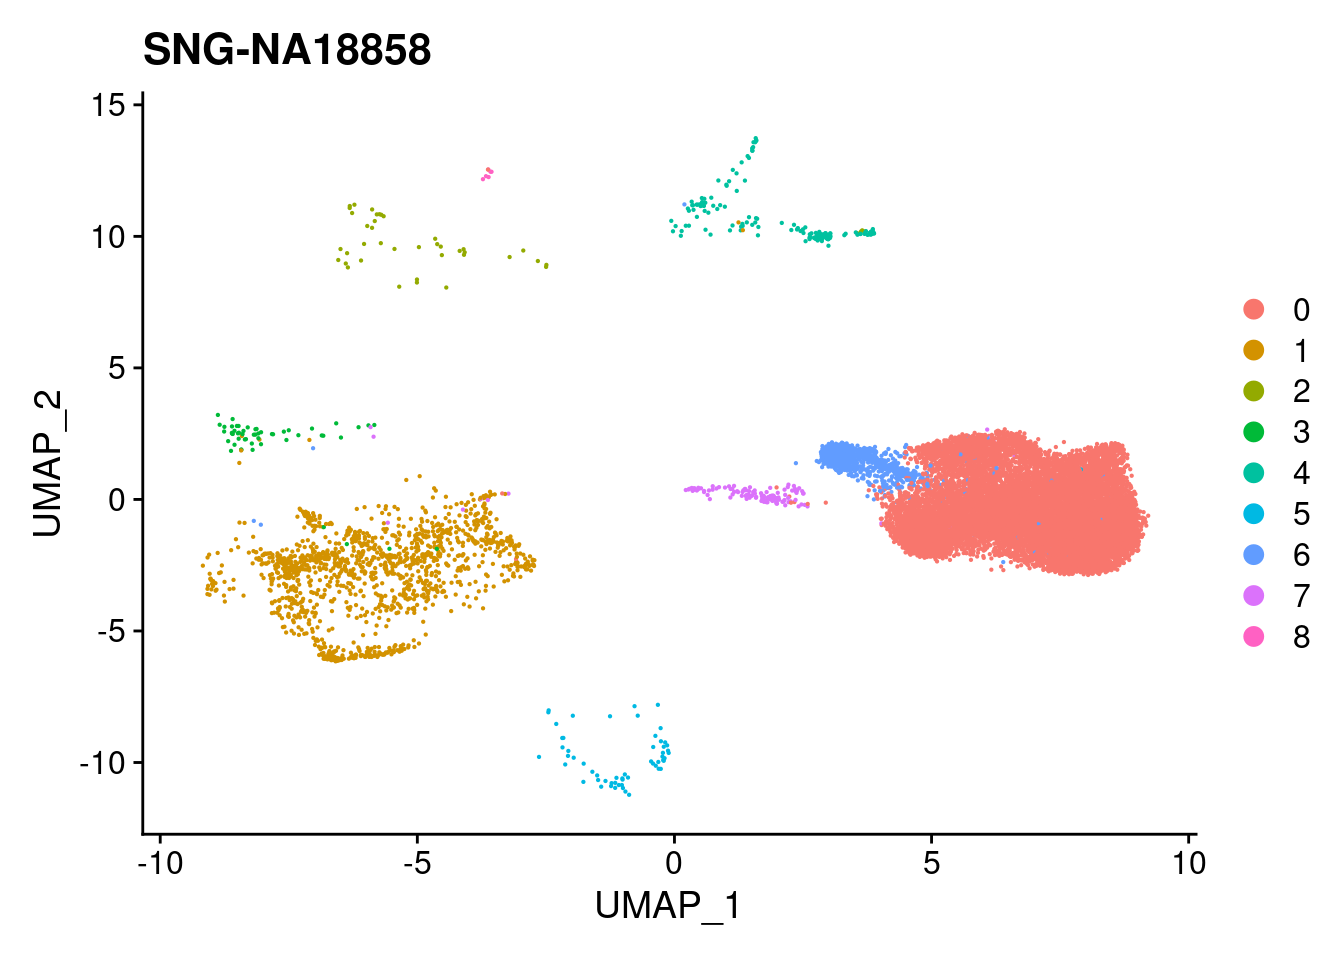
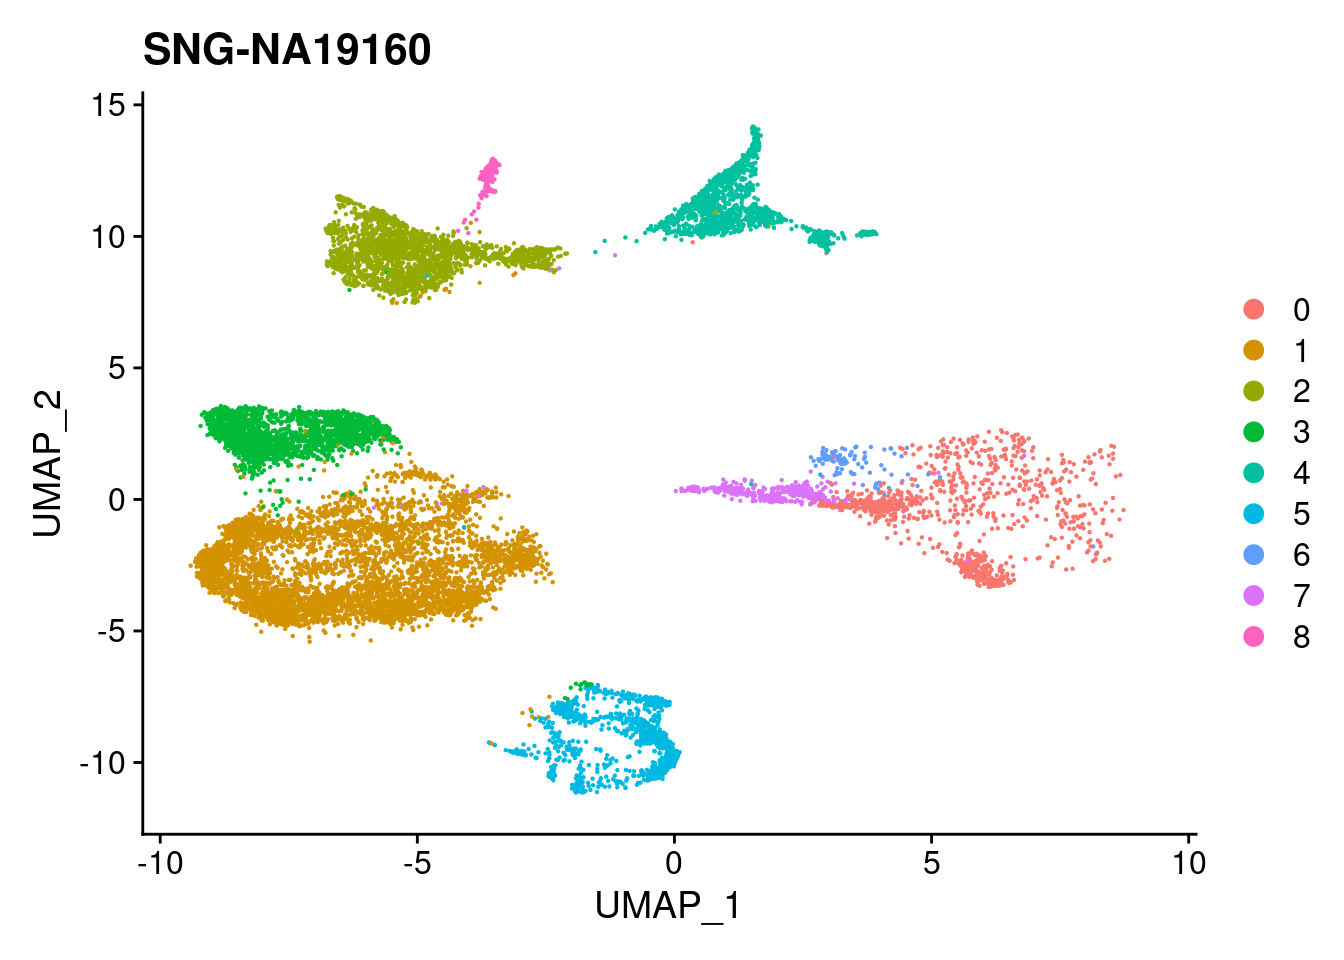
for (i in individuals)
{
print(DimPlot(merged, reduction = "umap",
cells = WhichCells(merged, expression = individual == i)) +
xlim(xlim) + ylim(ylim) + ggtitle(i))
}
| Version | Author | Date |
|---|---|---|
| 421a225 | KLRhodes | 2020-08-10 |
| Version | Author | Date |
|---|---|---|
| 421a225 | KLRhodes | 2020-08-10 |
| Version | Author | Date |
|---|---|---|
| 421a225 | KLRhodes | 2020-08-10 |
#exploring similarity in the number of cells per individual between batches
merged.Batch1<- (subset(merged, Batch == "Batch1"))
b1t<- table(merged.Batch1$SCT_snn_res.0.1, merged.Batch1$individual)
remove("merged.Batch1")
b1tcolsums<- colSums(b1t)
percb1t<- b1t/b1tcolsums

merged.Batch2<- (subset(merged, Batch == "Batch2"))
b2t<- table(merged.Batch2$SCT_snn_res.0.1, merged.Batch2$individual)
remove("merged.Batch2")
b2tcolsums<- colSums(b2t)
percb2t<- b2t/b2tcolsums

merged.Batch3<- (subset(merged, Batch == "Batch3"))
b3t<- table(merged.Batch3$SCT_snn_res.0.1, merged.Batch3$individual)
remove("merged.Batch3")
b3tcolsums<- colSums(b3t)
percb3t<- b3t/b3tcolsums
cols1<- c("Batch1_18511","Batch1_18858","Batch1_19160", "Batch2_18511", "Batch2_18858","Batch2_19160",
"Batch3_18511","Batch3_18858", "Batch3_19160")
cols2<- c("Batch1_18511", "Batch2_18511", "Batch3_18511","Batch1_18858", "Batch2_18858", "Batch3_18858","Batch1_19160", "Batch2_19160", "Batch3_19160")
fullpercs<- as.data.frame(cbind(percb1t[,1:3], percb2t,percb3t))
colnames(fullpercs)<-cols1
fullpercs<- cbind(fullpercs$Batch1_18511, fullpercs$Batch2_18511, fullpercs$Batch3_18511,
fullpercs$Batch1_18858, fullpercs$Batch2_18858, fullpercs$Batch3_18858,
fullpercs$Batch1_19160, fullpercs$Batch2_19160, fullpercs$Batch3_19160)
colnames(fullpercs)<-cols2
fullpercs_cor<- round(cor(fullpercs),2)
fullpercs_melt<- melt(fullpercs_cor)
ggplot(data= fullpercs_melt, aes(x=Var1, y=Var2, fill=value)) +
geom_tile(color="white") +
scale_fill_gradient2(low="blue", high="red", mid="white", midpoint = 0, limit= c(-1,1), space= "Lab", name="Pearson\nCorrelation") +
theme_minimal() +
theme(axis.text.x = element_text(angle = 30, hjust=1))+
ggtitle("Pairwise Pearson Correlation of the percent of cells from \neach cell line assigned to each Seurat Cluster\ncluster res. 0.1")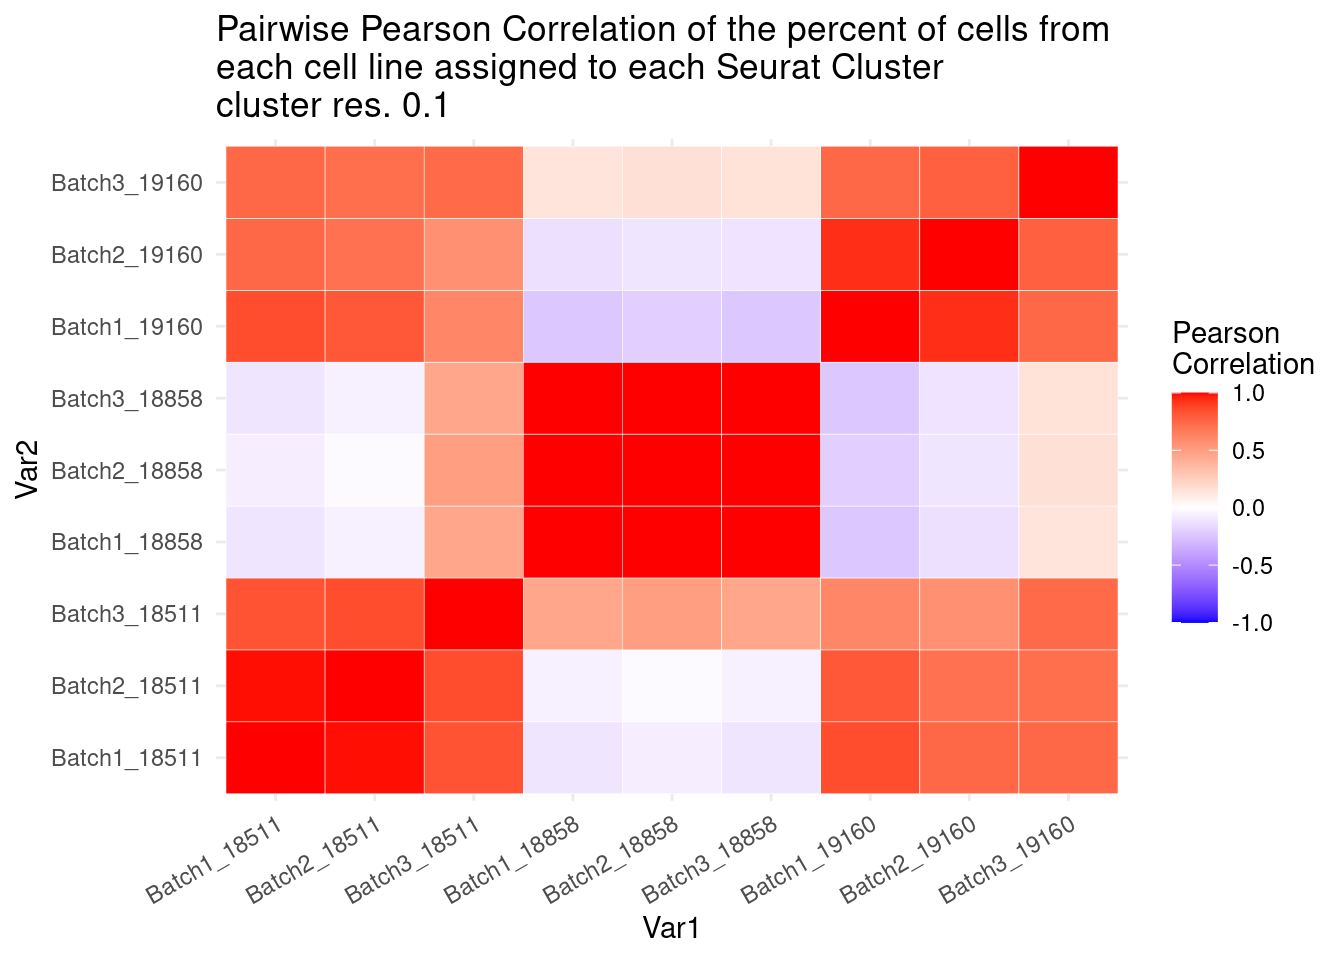
| Version | Author | Date |
|---|---|---|
| 421a225 | KLRhodes | 2020-08-10 |
#now clustering individual_Batch samples with hierarchical clustering/they will get reordered based on similarity

beauty<- colorRampPalette(brewer.pal(9,"Purples"))(200)
#fullnonorm<- as.data.frame(cbind(b1t[,1:3], b2t,b3t))
#colnames(fullnonorm)<-cols1
#heatmap((as.matrix(fullnonorm)), scale="column", col= beauty)

rownames(fullpercs)<- c(0:(nrow(fullpercs)-1))

heatmap(as.matrix(fullpercs), scale="none", col=beauty, cexCol = .7, cexRow=.6)
text(1:ncol(fullpercs),labels=names(fullpercs),srt=30)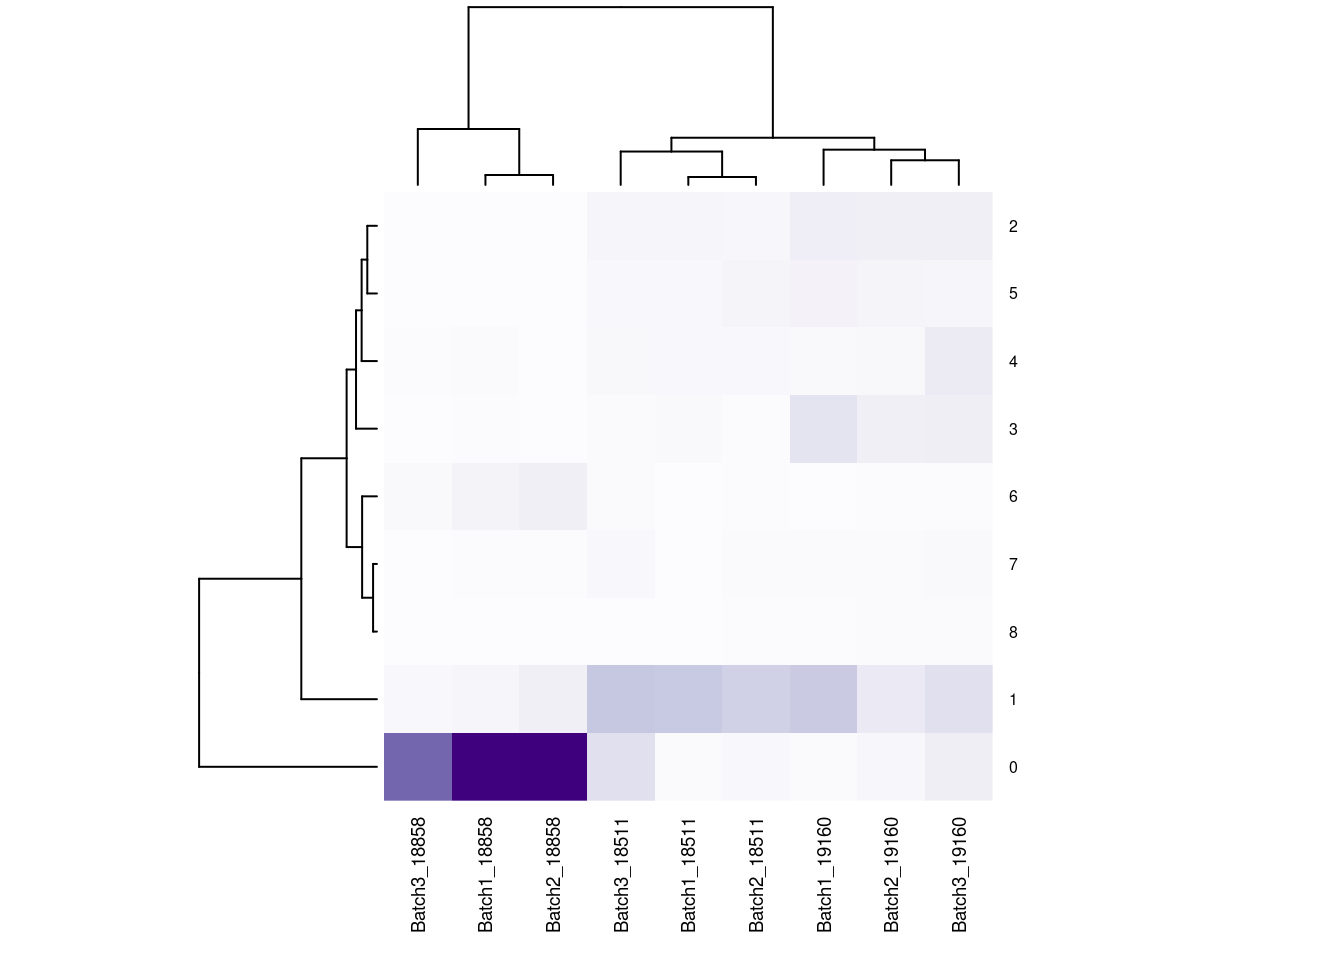
| Version | Author | Date |
|---|---|---|
| 421a225 | KLRhodes | 2020-08-10 |
#generate a heatmap of the raw proportion of cells from each individual_batch in each seurat cluster. dendrograms based on similarity of the vectors. should be colored by the value(proportion), but some of the cluster/sample values to seem to match with the color#reassign idents
Idents(merged)<- 'SCT_snn_res.0.8'DimPlot(merged, reduction = "umap")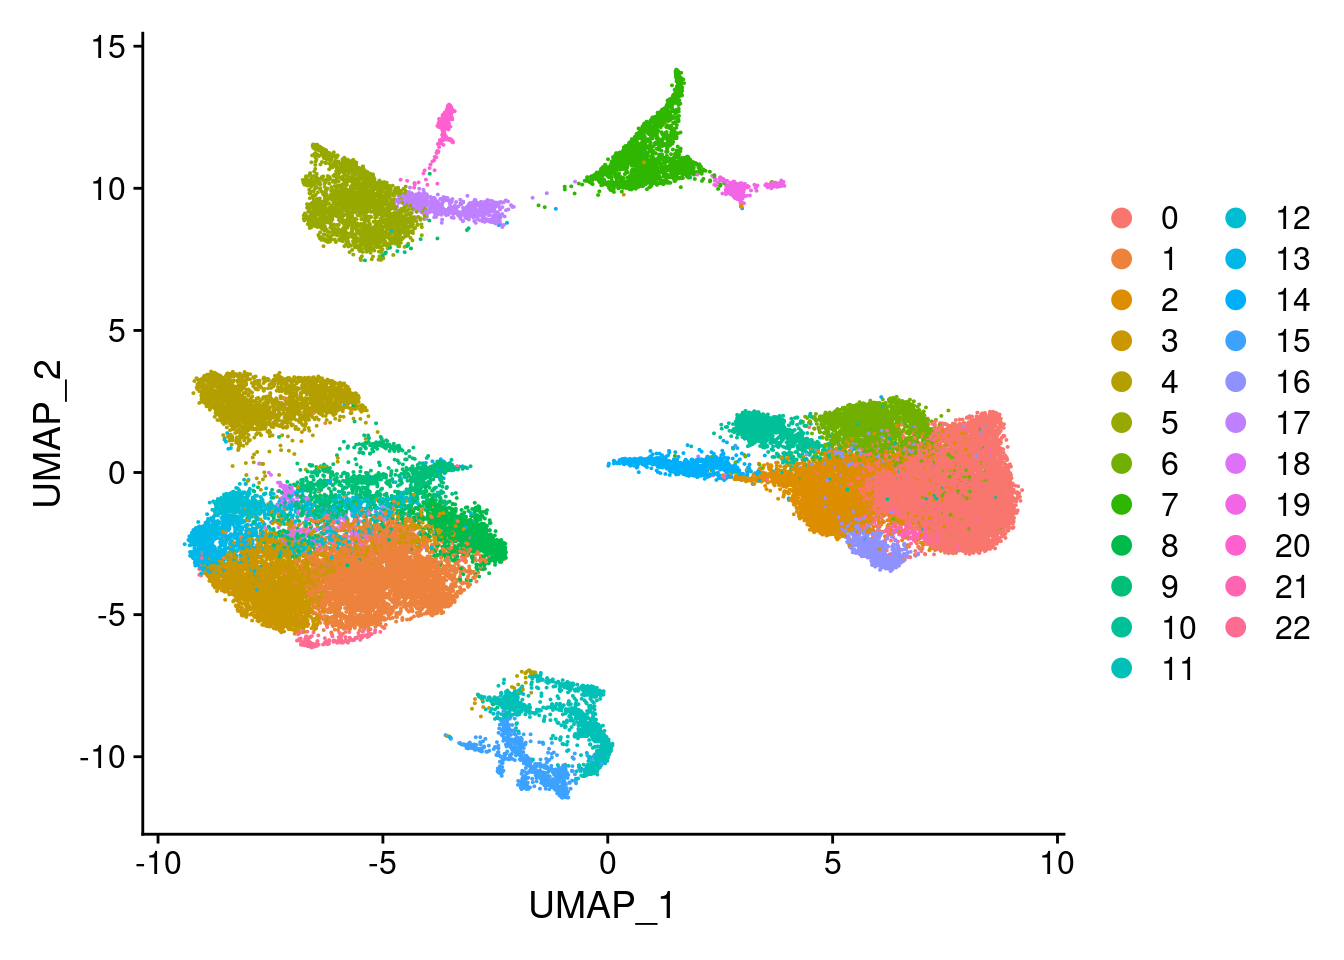
| Version | Author | Date |
|---|---|---|
| 421a225 | KLRhodes | 2020-08-10 |
DimPlot(merged, reduction = "umap", group.by = "Batch")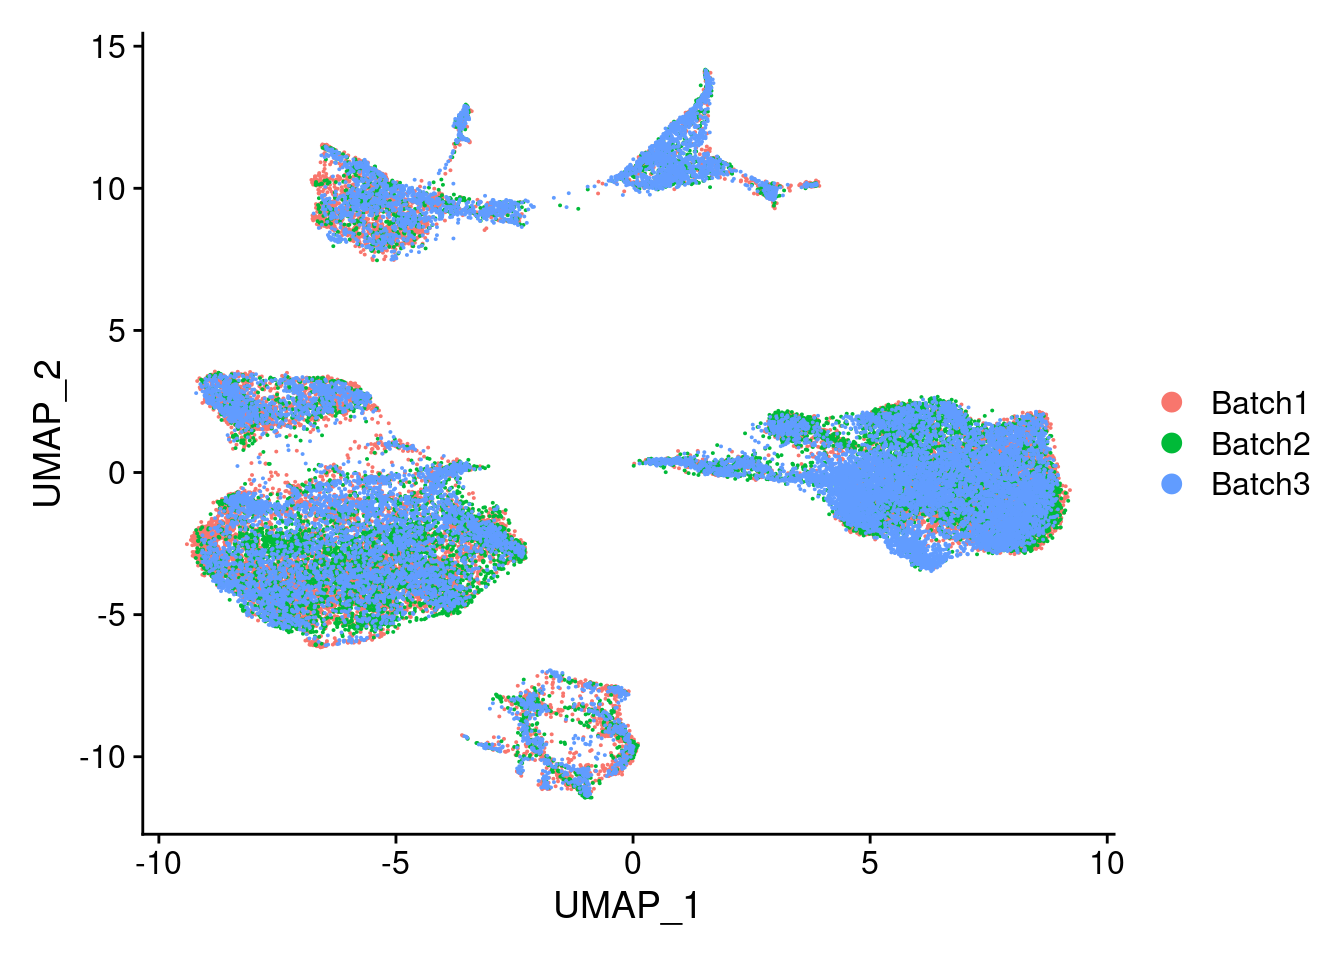
| Version | Author | Date |
|---|---|---|
| 421a225 | KLRhodes | 2020-08-10 |
DimPlot(merged, reduction = "umap", group.by = "individual")
| Version | Author | Date |
|---|---|---|
| 421a225 | KLRhodes | 2020-08-10 |
xlim <- c(min(merged@reductions$umap@cell.embeddings[,'UMAP_1']),
          max(merged@reductions$umap@cell.embeddings[,'UMAP_1']))
ylim <- c(min(merged@reductions$umap@cell.embeddings[,'UMAP_2']),
          max(merged@reductions$umap@cell.embeddings[,'UMAP_2']))
for (i in individuals)
{
  print(DimPlot(merged, reduction = "umap",
                cells = WhichCells(merged, expression = individual == i)) +
          xlim(xlim) + ylim(ylim) + ggtitle(i))
}
| Version | Author | Date |
|---|---|---|
| 421a225 | KLRhodes | 2020-08-10 |
| Version | Author | Date |
|---|---|---|
| 421a225 | KLRhodes | 2020-08-10 |
| Version | Author | Date |
|---|---|---|
| 421a225 | KLRhodes | 2020-08-10 |
#exploring similarity in the number of cells per individual between batches
merged.Batch1<- (subset(merged, Batch == "Batch1"))
b1t<- table(merged.Batch1$SCT_snn_res.0.8, merged.Batch1$individual)
remove("merged.Batch1")
b1tcolsums<- colSums(b1t)
percb1t<- b1t/b1tcolsums

merged.Batch2<- (subset(merged, Batch == "Batch2"))
b2t<- table(merged.Batch2$SCT_snn_res.0.8, merged.Batch2$individual)
remove("merged.Batch2")
b2tcolsums<- colSums(b2t)
percb2t<- b2t/b2tcolsums

merged.Batch3<- (subset(merged, Batch == "Batch3"))
b3t<- table(merged.Batch3$SCT_snn_res.0.8, merged.Batch3$individual)
remove("merged.Batch3")
b3tcolsums<- colSums(b3t)
percb3t<- b3t/b3tcolsums
cols1<- c("Batch1_18511","Batch1_18858","Batch1_19160", "Batch2_18511", "Batch2_18858","Batch2_19160",
"Batch3_18511","Batch3_18858", "Batch3_19160")
cols2<- c("Batch1_18511", "Batch2_18511", "Batch3_18511","Batch1_18858", "Batch2_18858", "Batch3_18858","Batch1_19160", "Batch2_19160", "Batch3_19160")
fullpercs<- as.data.frame(cbind(percb1t[,1:3], percb2t,percb3t))
colnames(fullpercs)<-cols1
fullpercs<- cbind(fullpercs$Batch1_18511, fullpercs$Batch2_18511, fullpercs$Batch3_18511,
fullpercs$Batch1_18858, fullpercs$Batch2_18858, fullpercs$Batch3_18858,
fullpercs$Batch1_19160, fullpercs$Batch2_19160, fullpercs$Batch3_19160)
colnames(fullpercs)<-cols2
fullpercs_cor<- round(cor(fullpercs),2)
fullpercs_melt<- melt(fullpercs_cor)
ggplot(data= fullpercs_melt, aes(x=Var1, y=Var2, fill=value)) +
geom_tile(color="white") +
scale_fill_gradient2(low="blue", high="red", mid="white", midpoint = 0, limit= c(-1,1), space= "Lab", name="Pearson\nCorrelation") +
theme_minimal() +
ggtitle("Pairwise Pearson Correlation of the percent of cells from \neach cell line assigned to each Seurat Cluster\ncluster res. 0.8")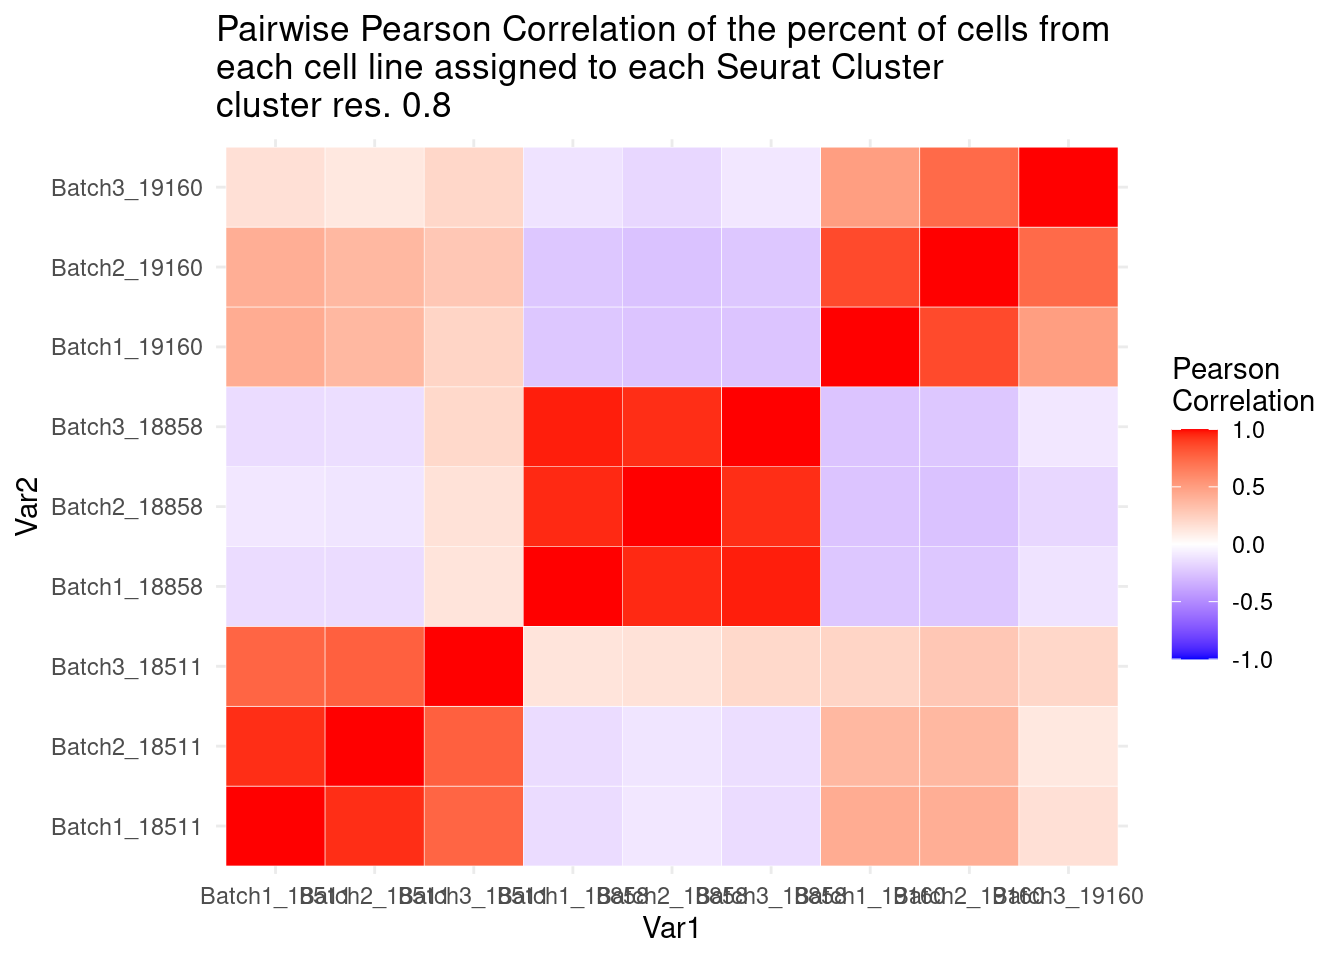
| Version | Author | Date |
|---|---|---|
| 421a225 | KLRhodes | 2020-08-10 |
#now clustering individual_Batch samples with hierarchical clustering/they will get reordered based on similarity

beauty<- colorRampPalette(brewer.pal(9,"Purples"))(200)

rownames(fullpercs)<- c(0:(nrow(fullpercs)-1))

heatmap(as.matrix(fullpercs), scale="none", col=beauty, cexCol = .7, cexRow=.6)
text(1:ncol(fullpercs),labels=names(fullpercs),srt=30)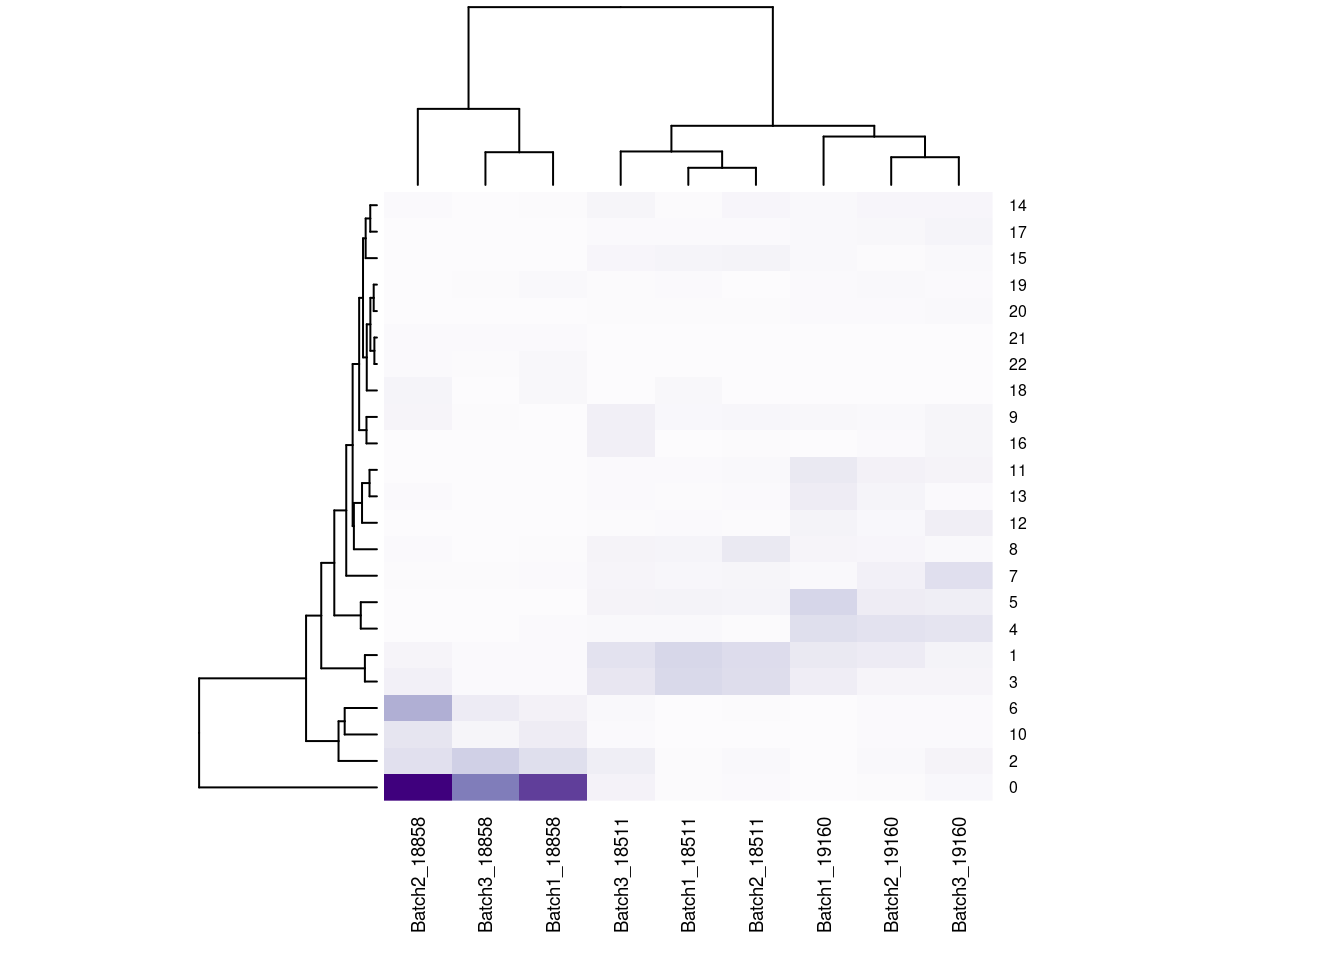
| Version | Author | Date |
|---|---|---|
| 421a225 | KLRhodes | 2020-08-10 |
#generate a heatmap of the raw proportion of cells from each individual_batch in each seurat cluster. dendrograms based on similarity of the vectors. should be colored by the value(proportion), but some of the cluster/sample values to seem to match with the colorVlnPlot(merged, features= "percent.mt", group.by = "SCT_snn_res.1", pt.size = 0)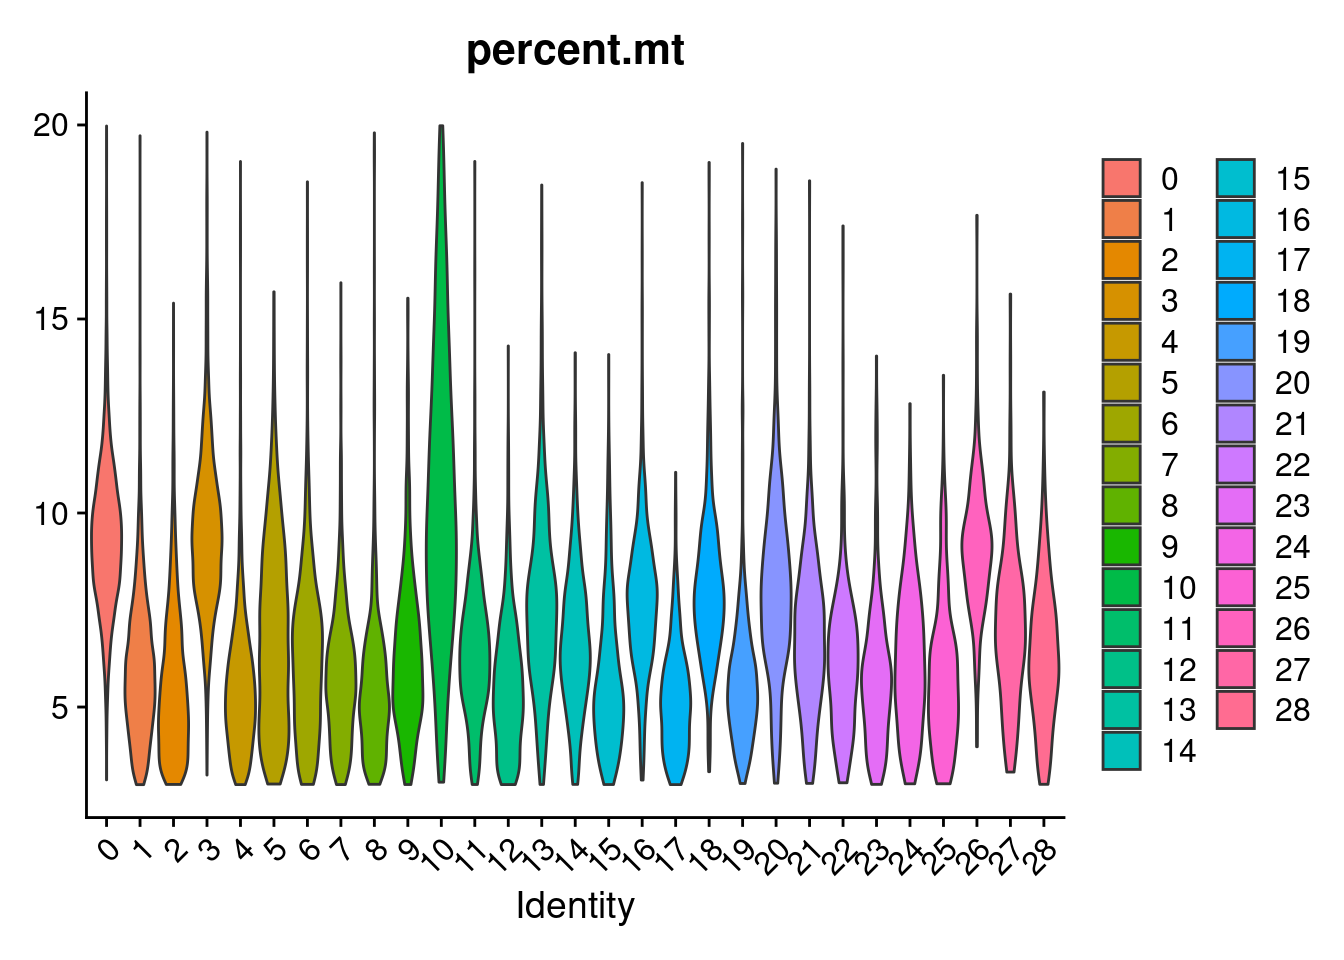
| Version | Author | Date |
|---|---|---|
| 421a225 | KLRhodes | 2020-08-10 |
merged[["percent.rps"]]<- PercentageFeatureSet(merged, pattern = "^RPS")
merged[["percent.rpl"]]<- PercentageFeatureSet(merged, pattern = "^RPL")
merged[["percent.rp"]]<- merged[["percent.rps"]]+merged[["percent.rpl"]]
VlnPlot(merged, features= "percent.rp", group.by = "SCT_snn_res.1", pt.size=0)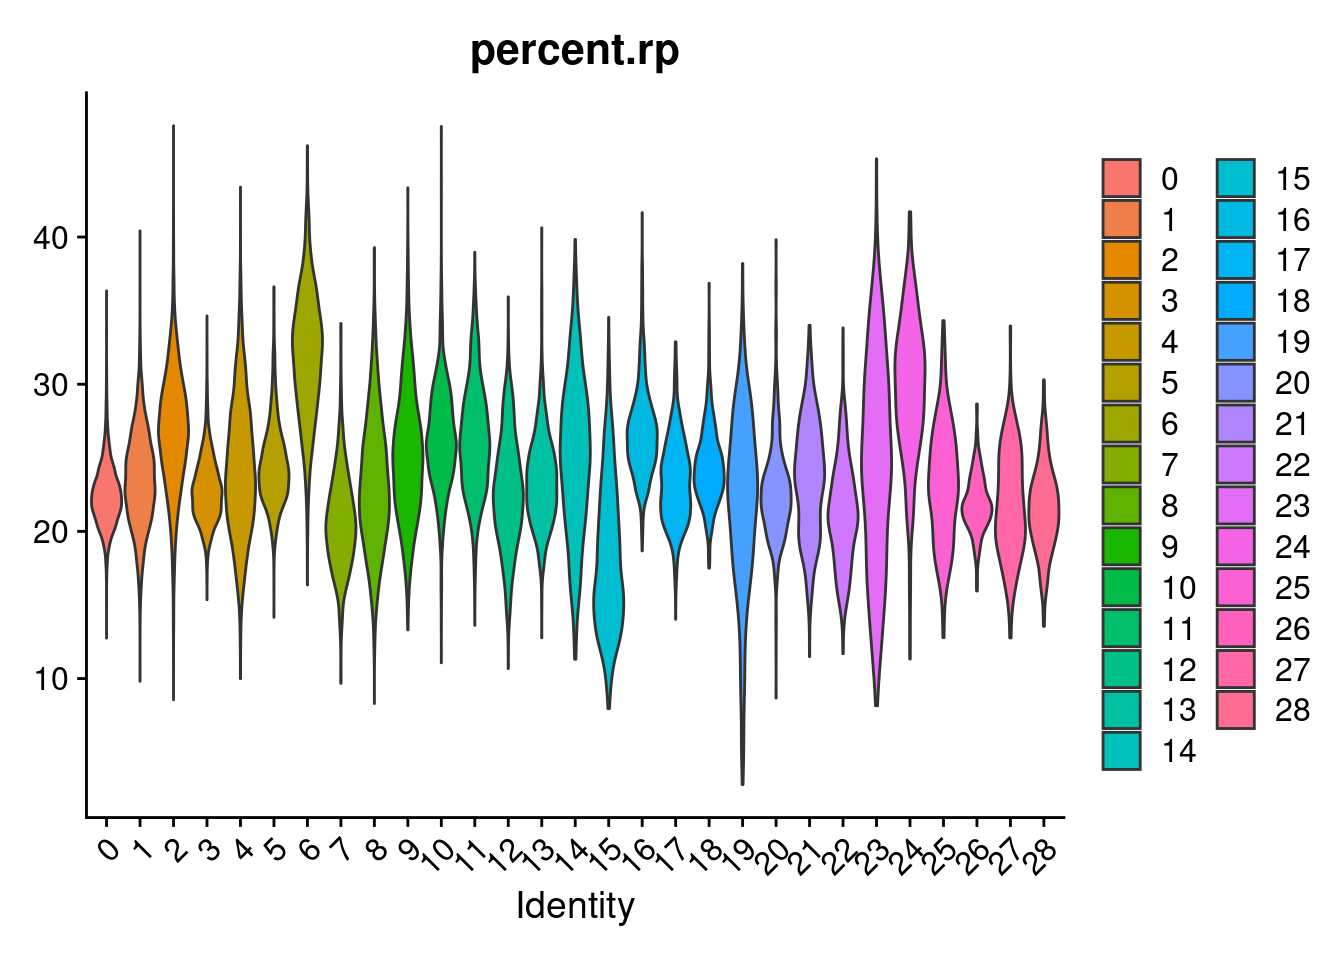
| Version | Author | Date |
|---|---|---|
| 421a225 | KLRhodes | 2020-08-10 |
FeaturePlot(merged, features = "nFeature_RNA")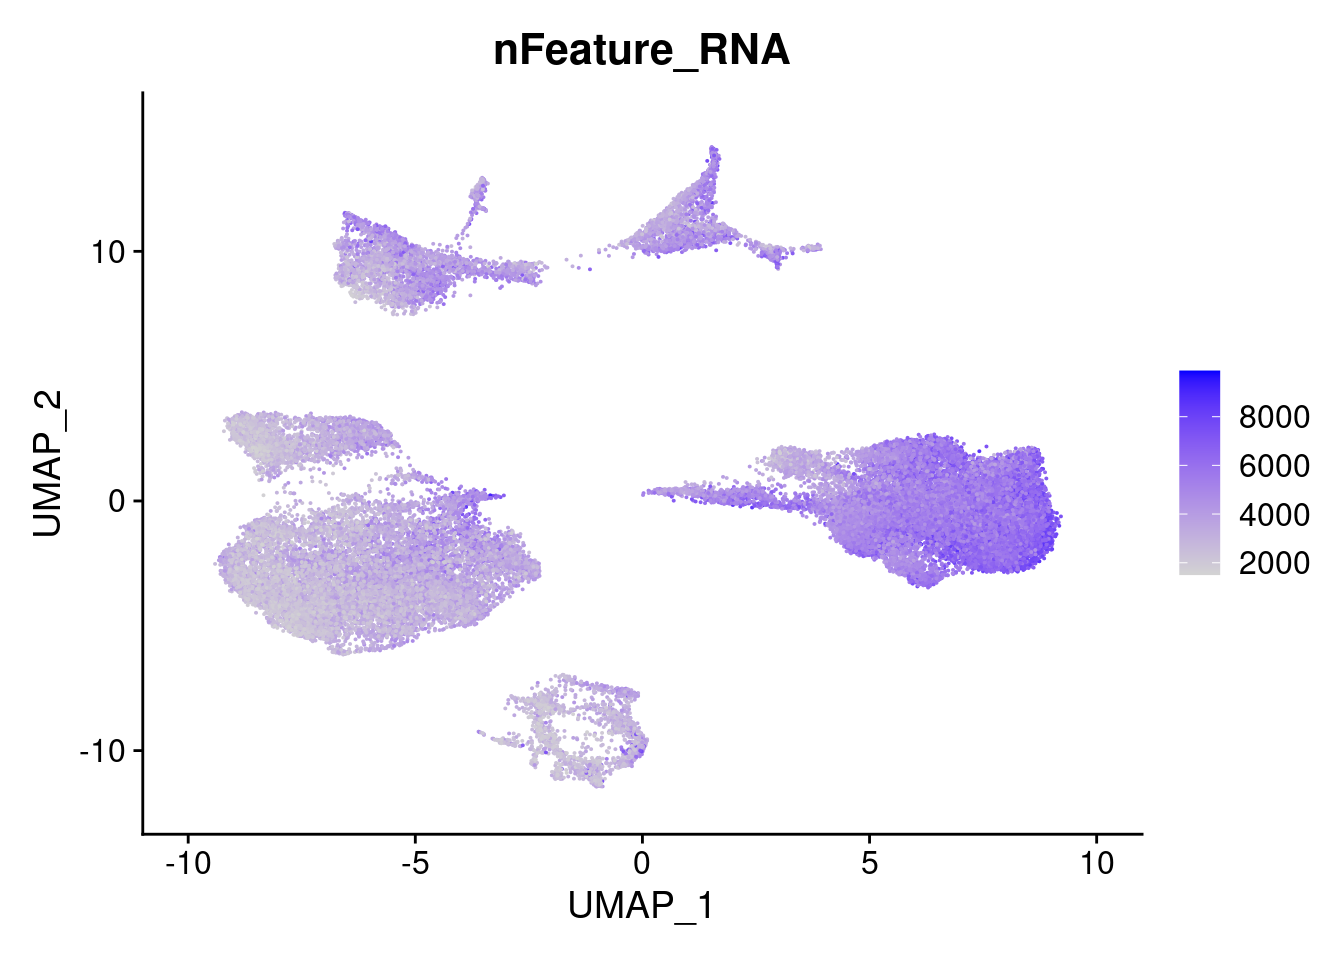
| Version | Author | Date |
|---|---|---|
| 421a225 | KLRhodes | 2020-08-10 |
head(merged)An object of class Seurat
2 features across 42488 samples within 2 assays
Active assay: SCT (1 features, 1 variable features)
1 other assay present: RNA
3 dimensional reductions calculated: pca, harmony, umapVlnPlot(merged, features= "nFeature_RNA", group.by = "SCT_snn_res.1", pt.size=0)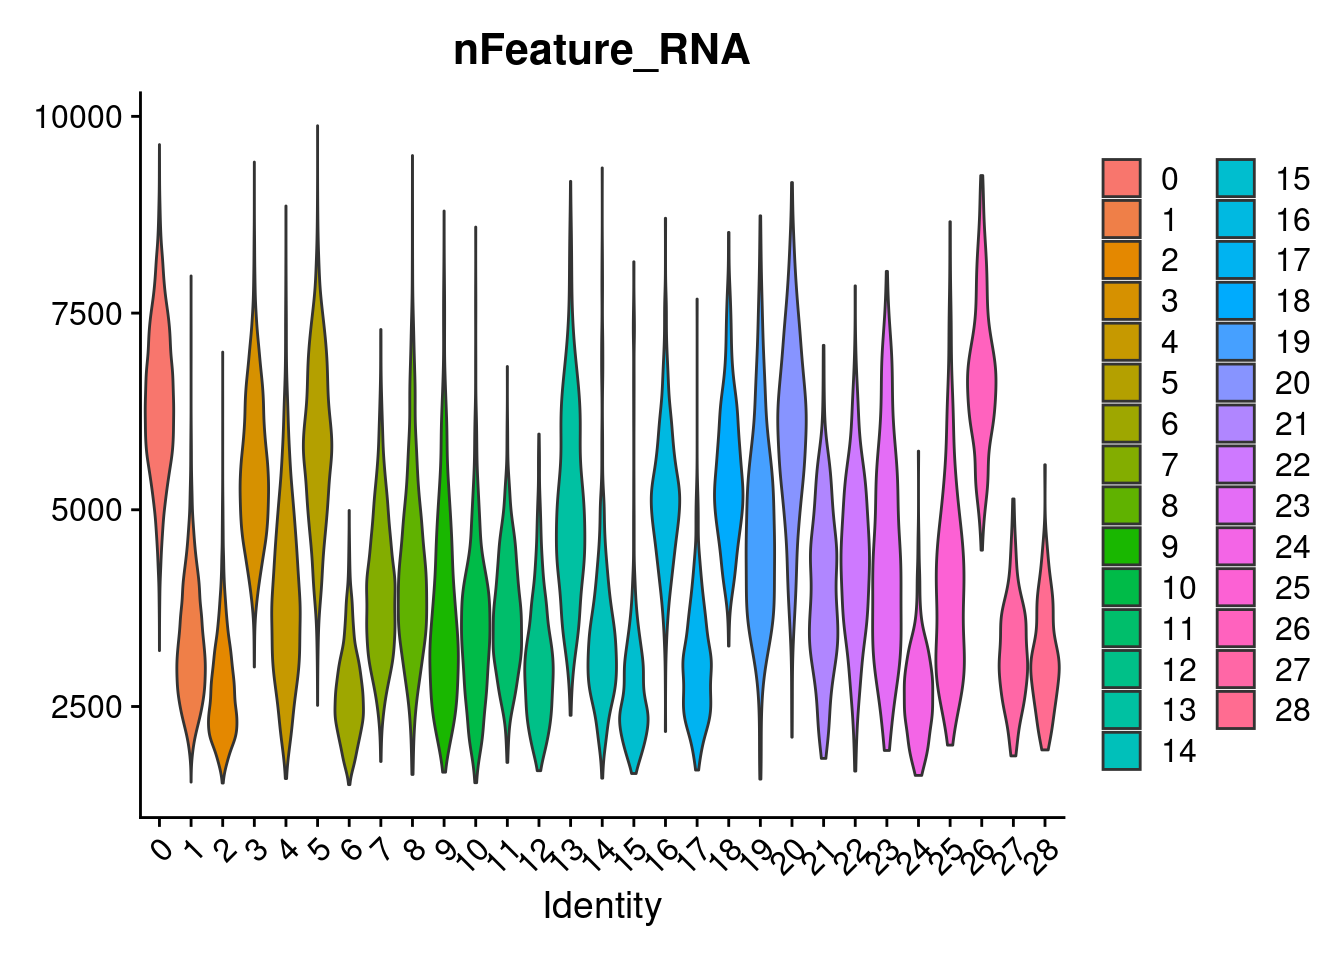
| Version | Author | Date |
|---|---|---|
| 421a225 | KLRhodes | 2020-08-10 |
FeaturePlot(merged, features = c("POU5F1", "SOX17", "HAND1", "PAX6"), pt.size = 0.2, ncol=2, combine=T)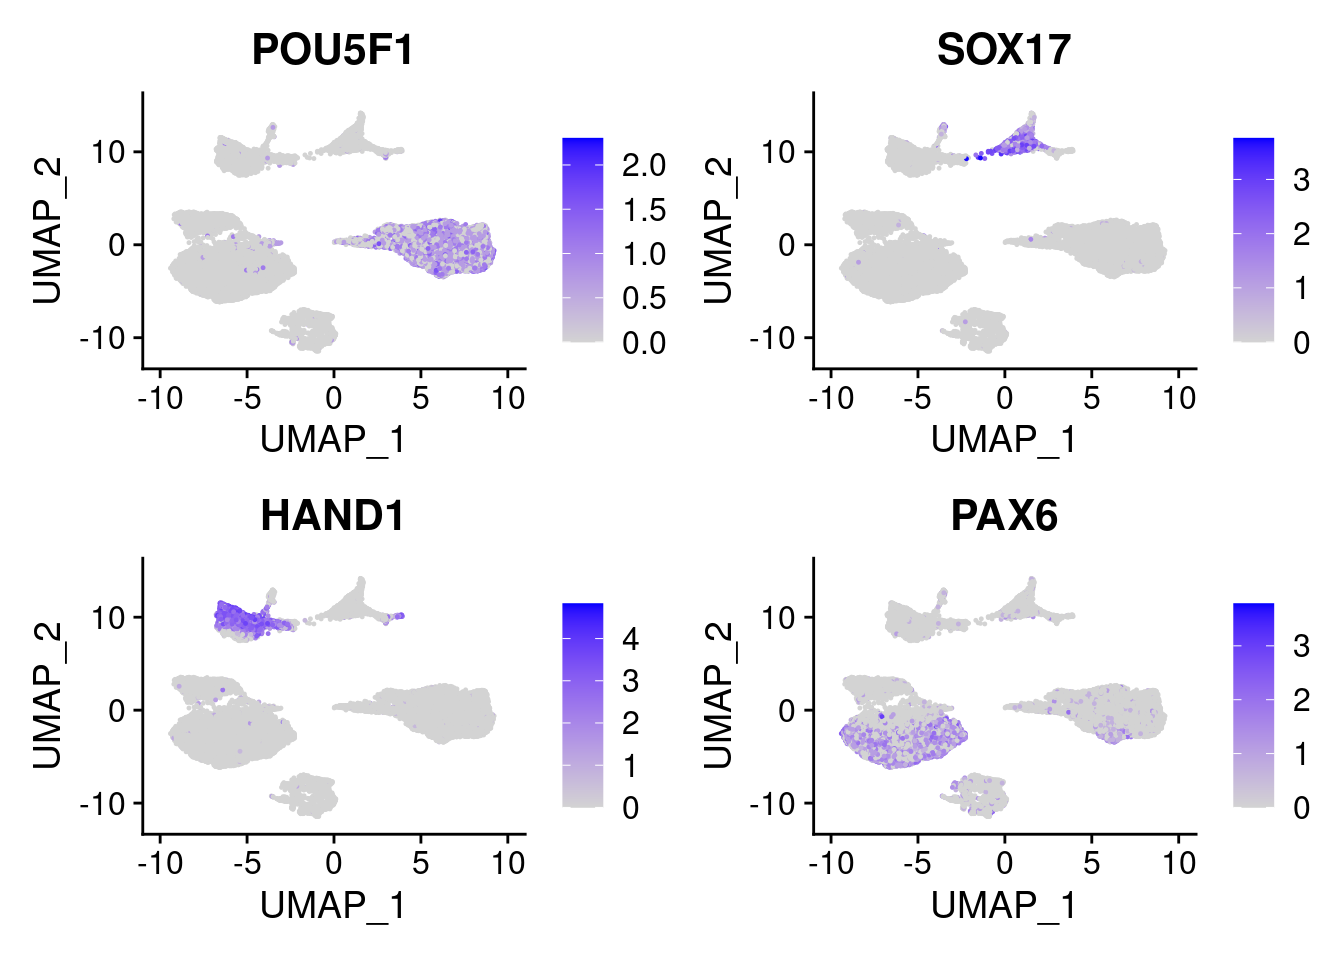
| Version | Author | Date |
|---|---|---|
| 421a225 | KLRhodes | 2020-08-10 |
FeaturePlot(merged, features = c("FGB", "ECSCR", "NEUROD1", "SOX10"), pt.size = 0.2, ncol=2)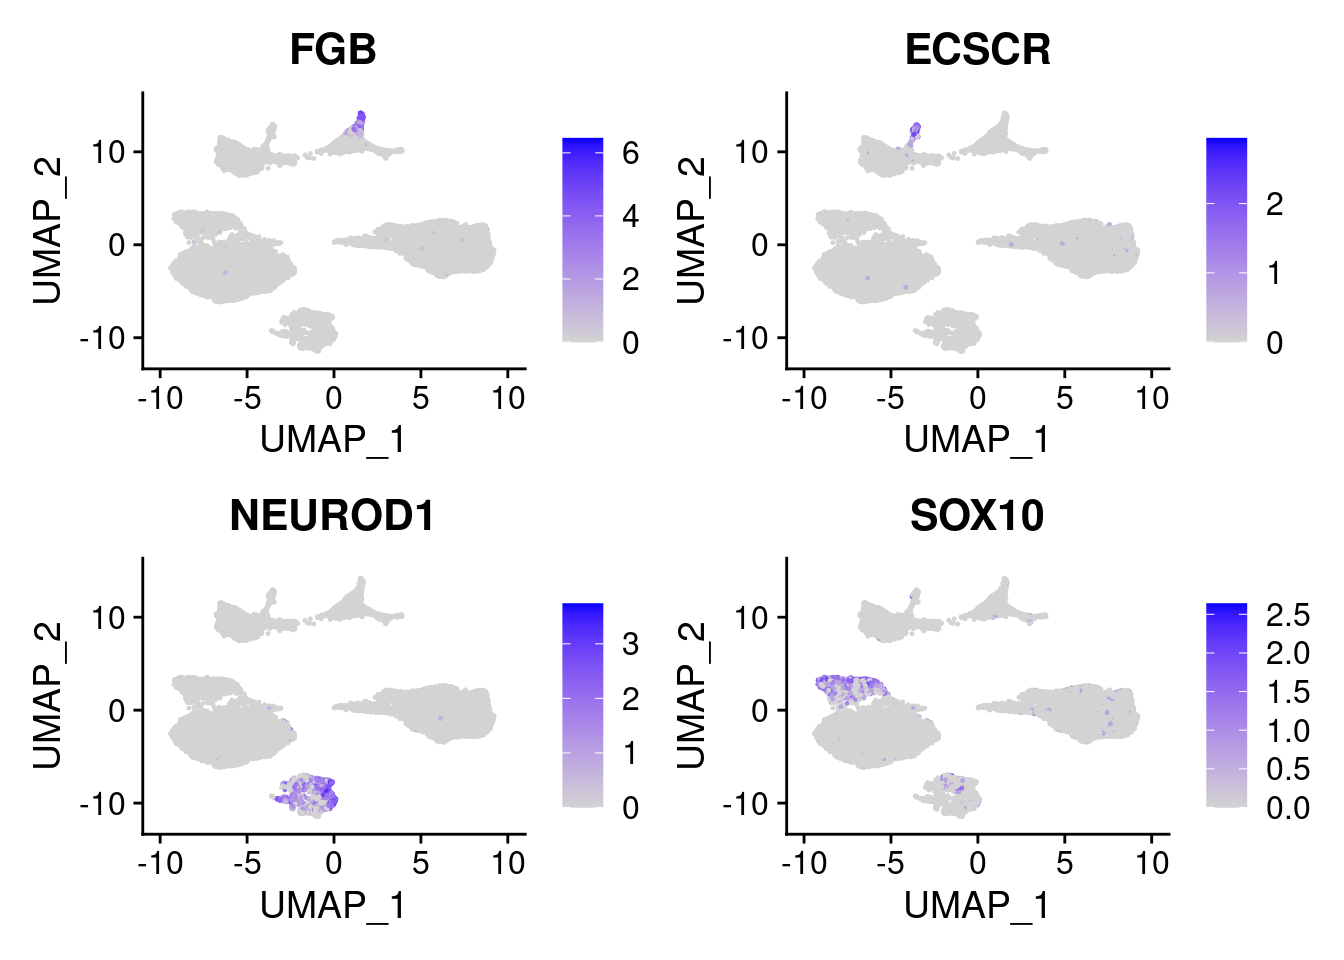
| Version | Author | Date |
|---|---|---|
| 421a225 | KLRhodes | 2020-08-10 |
sessionInfo()R version 3.6.1 (2019-07-05)
Platform: x86_64-pc-linux-gnu (64-bit)
Running under: Scientific Linux 7.4 (Nitrogen)
Matrix products: default
BLAS/LAPACK: /software/openblas-0.2.19-el7-x86_64/lib/libopenblas_haswellp-r0.2.19.so
locale:
[1] C
attached base packages:
[1] stats graphics grDevices utils datasets methods base
other attached packages:
[1] reshape2_1.4.4 RColorBrewer_1.1-2 here_0.1-11 DataCombine_0.2.21
[5] ggplot2_3.3.2 harmony_1.0 Rcpp_1.0.5 Seurat_3.2.0
[9] workflowr_1.6.2
loaded via a namespace (and not attached):
[1] Rtsne_0.15 colorspace_1.4-1 deldir_0.1-28
[4] ellipsis_0.3.1 ggridges_0.5.2 rprojroot_1.3-2
[7] fs_1.4.2 spatstat.data_1.4-3 farver_2.0.3
[10] leiden_0.3.3 listenv_0.8.0 npsurv_0.4-0
[13] ggrepel_0.8.2 RSpectra_0.16-0 codetools_0.2-16
[16] splines_3.6.1 lsei_1.2-0 knitr_1.29
[19] polyclip_1.10-0 jsonlite_1.7.0 ica_1.0-2
[22] cluster_2.1.0 png_0.1-7 uwot_0.1.8
[25] shiny_1.5.0 sctransform_0.2.1 compiler_3.6.1
[28] httr_1.4.2 backports_1.1.8 Matrix_1.2-18
[31] fastmap_1.0.1 lazyeval_0.2.2 later_1.1.0.1
[34] htmltools_0.5.0 tools_3.6.1 rsvd_1.0.3
[37] igraph_1.2.5 gtable_0.3.0 glue_1.4.1
[40] RANN_2.6.1 dplyr_1.0.0 rappdirs_0.3.1
[43] spatstat_1.64-1 vctrs_0.3.2 gdata_2.18.0
[46] ape_5.3 nlme_3.1-140 lmtest_0.9-37
[49] xfun_0.16 stringr_1.4.0 globals_0.12.5
[52] mime_0.9 miniUI_0.1.1.1 lifecycle_0.2.0
[55] irlba_2.3.3 gtools_3.8.2 goftest_1.2-2
[58] future_1.18.0 MASS_7.3-51.4 zoo_1.8-8
[61] scales_1.1.1 promises_1.1.1 spatstat.utils_1.17-0
[64] parallel_3.6.1 yaml_2.2.1 reticulate_1.16
[67] pbapply_1.4-2 gridExtra_2.3 rpart_4.1-15
[70] stringi_1.4.6 caTools_1.18.0 rlang_0.4.7
[73] pkgconfig_2.0.3 bitops_1.0-6 evaluate_0.14
[76] lattice_0.20-38 ROCR_1.0-7 purrr_0.3.4
[79] tensor_1.5 labeling_0.3 patchwork_1.0.1
[82] htmlwidgets_1.5.1 cowplot_1.0.0 tidyselect_1.1.0
[85] RcppAnnoy_0.0.16 plyr_1.8.6 magrittr_1.5
[88] R6_2.4.1 gplots_3.0.4 generics_0.0.2
[91] withr_2.2.0 pillar_1.4.6 whisker_0.4
[94] mgcv_1.8-28 fitdistrplus_1.0-14 survival_3.2-3
[97] abind_1.4-5 tibble_3.0.3 future.apply_1.6.0
[100] crayon_1.3.4 KernSmooth_2.23-15 plotly_4.9.2.1
[103] rmarkdown_2.3 grid_3.6.1 data.table_1.13.0
[106] git2r_0.26.1 digest_0.6.25 xtable_1.8-4
[109] tidyr_1.1.0 httpuv_1.5.4 munsell_0.5.0
[112] viridisLite_0.3.0