Integrate lanes from all batches of EB pilot
Last updated: 2021-07-05
Checks: 7 0
Knit directory: Embryoid_Body_Pilot_Workflowr/analysis/
This reproducible R Markdown analysis was created with workflowr (version 1.6.2). The Checks tab describes the reproducibility checks that were applied when the results were created. The Past versions tab lists the development history.
Great! Since the R Markdown file has been committed to the Git repository, you know the exact version of the code that produced these results.
Great job! The global environment was empty. Objects defined in the global environment can affect the analysis in your R Markdown file in unknown ways. For reproduciblity it's best to always run the code in an empty environment.
The command set.seed(20200804) was run prior to running the code in the R Markdown file. Setting a seed ensures that any results that rely on randomness, e.g. subsampling or permutations, are reproducible.
Great job! Recording the operating system, R version, and package versions is critical for reproducibility.
Nice! There were no cached chunks for this analysis, so you can be confident that you successfully produced the results during this run.
Great job! Using relative paths to the files within your workflowr project makes it easier to run your code on other machines.
Great! You are using Git for version control. Tracking code development and connecting the code version to the results is critical for reproducibility.
The results in this page were generated with repository version e9247fb. See the Past versions tab to see a history of the changes made to the R Markdown and HTML files.
Note that you need to be careful to ensure that all relevant files for the analysis have been committed to Git prior to generating the results (you can use wflow_publish or wflow_git_commit). workflowr only checks the R Markdown file, but you know if there are other scripts or data files that it depends on. Below is the status of the Git repository when the results were generated:
Ignored files:
    Ignored:    .Rhistory
    Ignored:    .Rproj.user/
    Ignored:    analysis/.Rhistory
    Ignored:    output/.Rhistory

Untracked files:
    Untracked:  GSE122380_raw_counts.txt.gz
    Untracked:  UTF1_plots.Rmd
    Untracked:  analysis/IntegrateReference_SCTregressCaoPlusScHCL_JustEarlyEcto.Rmd
    Untracked:  analysis/IntegrateReference_SCTregressCaoPlusScHCL_JustEndo.Rmd
    Untracked:  analysis/IntegrateReference_SCTregressCaoPlusScHCL_JustMeso.Rmd
    Untracked:  analysis/IntegrateReference_SCTregressCaoPlusScHCL_JustNeuralCrest.Rmd
    Untracked:  analysis/IntegrateReference_SCTregressCaoPlusScHCL_JustNeuron.Rmd
    Untracked:  analysis/IntegrateReference_SCTregressCaoPlusScHCL_JustPluri.Rmd
    Untracked:  analysis/OLD/
    Untracked:  analysis/Pseudobulk_Limma_Harmony.BatchIndividual_ClusterRes0.8_minPCT0.2.Rmd
    Untracked:  analysis/Pseudobulk_Limma_Harmony.BatchIndividual_ClusterRes1_minPCT0.2.Rmd
    Untracked:  analysis/Pseudobulk_VariancePartition_Harmony.Batchindividual_ClusterRes0.1_byCluster.Rmd
    Untracked:  analysis/RefInt_ComparingFulltoPartialIntegrationAnnotations.Rmd
    Untracked:  analysis/ReferenceAnn_DE.Rmd
    Untracked:  analysis/SingleCell_HierarchicalClustering_NoGeneFilter.Rmd
    Untracked:  analysis/SingleCell_VariancePartitionByCluster_Harmony.Batchindividual_ClusterRes0.1_minPCT0.2.Rmd
    Untracked:  analysis/VarPartPlots_res0.1_SCT.Rmd
    Untracked:  analysis/VarPart_SC_res0.1_SCT.Rmd
    Untracked:  analysis/child/
    Untracked:  analysis/k10topics_Explore.Rmd
    Untracked:  analysis/k6topics_Explore.Rmd
    Untracked:  build_refint_scale.R
    Untracked:  build_refint_sct.R
    Untracked:  build_stuff.R
    Untracked:  build_varpart_sc.R
    Untracked:  code/.ipynb_checkpoints/
    Untracked:  code/CellRangerPreprocess.Rmd
    Untracked:  code/ConvertToDGE.Rmd
    Untracked:  code/ConvertToDGE_PseudoBulk.Rmd
    Untracked:  code/ConvertToDGE_SingleCellRes_minPCT0.2.Rmd
    Untracked:  code/EB.getHumanMetadata.Rmd
    Untracked:  code/GEO_processed_data.Rmd
    Untracked:  code/PowerAnalysis_NoiseRatio.ipynb
    Untracked:  code/Untitled.ipynb
    Untracked:  code/Untitled1.ipynb
    Untracked:  code/compile_fits.Rmd
    Untracked:  code/fit_all_models.sh
    Untracked:  code/fit_poisson_nmf.R
    Untracked:  code/fit_poisson_nmf.sbatch
    Untracked:  code/functions_for_fit_comparison.Rmd
    Untracked:  code/get_genelist_byPCTthresh.Rmd
    Untracked:  code/prefit_poisson_nmf.R
    Untracked:  code/prefit_poisson_nmf.sbatch
    Untracked:  code/prepare_data_for_fastTopics.Rmd
    Untracked:  data/HCL_Fig1_adata.h5ad
    Untracked:  data/HCL_Fig1_adata.h5seurat
    Untracked:  data/dge/
    Untracked:  data/dge_raw_data.tar.gz
    Untracked:  data/ref.expr.rda
    Untracked:  figure/
    Untracked:  output/CR_sampleQCrds/
    Untracked:  output/CaoEtAl.Obj.CellsOfAllClusters.ProteinCodingGenes.rds
    Untracked:  output/CaoEtAl.Obj.rds
    Untracked:  output/ClusterInfo_res0.1.csv
    Untracked:  output/DGELists/
    Untracked:  output/DownSampleVarPart.rds
    Untracked:  output/Frequency.MostCommonAnnotation.FiveNearestRefCells.csv
    Untracked:  output/GEOsubmissionProcessedFiles/
    Untracked:  output/GeneLists_by_minPCT/
    Untracked:  output/MostCommonAnnotation.FiveNearestRefCells.csv
    Untracked:  output/NearestReferenceCell.Cao.hESC.EuclideanDistanceinHarmonySpace.csv
    Untracked:  output/NearestReferenceCell.Cao.hESC.FrequencyofEachAnnotation.csv
    Untracked:  output/NearestReferenceCell.SCTregressRNAassay.Cao.hESC.EuclideanDistanceinHarmonySpace.csv
    Untracked:  output/NearestReferenceCell.SCTregressRNAassay.Cao.hESC.FrequencyofEachAnnotation.csv
    Untracked:  output/Pseudobulk_Limma_res0.1_OnevAllTopTables.csv
    Untracked:  output/Pseudobulk_Limma_res0.1_OnevAll_top10Upregby_adjP.csv
    Untracked:  output/Pseudobulk_Limma_res0.1_OnevAll_top10Upregby_logFC.csv
    Untracked:  output/Pseudobulk_Limma_res0.5_OnevAllTopTables.csv
    Untracked:  output/Pseudobulk_Limma_res0.8_OnevAllTopTables.csv
    Untracked:  output/Pseudobulk_Limma_res1_OnevAllTopTables.csv
    Untracked:  output/Pseudobulk_VarPart.ByCluster.Res0.1.rds
    Untracked:  output/ResidualVariances_fromDownSampAnalysis.csv
    Untracked:  output/SingleCell_VariancePartition_RNA_Res0.1_minPCT0.2.rds
    Untracked:  output/SingleCell_VariancePartition_Res0.1_minPCT0.2.rds
    Untracked:  output/SingleCell_VariancePartition_SCT_Res0.1_minPCT0.2.rds
    Untracked:  output/TopicModelling_k10_top10drivergenes.byBeta.csv
    Untracked:  output/TopicModelling_k6_top10drivergenes.byBeta.csv
    Untracked:  output/TopicModelling_k6_top15drivergenes.byZ.csv
    Untracked:  output/TranferredAnnotations_ReferenceInt_JustEarlyEcto.csv
    Untracked:  output/TranferredAnnotations_ReferenceInt_JustEndoderm.csv
    Untracked:  output/TranferredAnnotations_ReferenceInt_JustMeso.csv
    Untracked:  output/TranferredAnnotations_ReferenceInt_JustNeuralCrest.csv
    Untracked:  output/TranferredAnnotations_ReferenceInt_JustNeuron.csv
    Untracked:  output/TranferredAnnotations_ReferenceInt_JustPluripotent.csv
    Untracked:  output/VarPart.ByCluster.Res0.1.rds
    Untracked:  output/azimuth/
    Untracked:  output/downsamp_10800cells_10subreps_medianexplainedbyresiduals_varpart_PsB.rds
    Untracked:  output/downsamp_16200cells_10subreps_medianexplainedbyresiduals_varpart_PsB.rds
    Untracked:  output/downsamp_21600cells_10subreps_medianexplainedbyresiduals_varpart_PsB.rds
    Untracked:  output/downsamp_2700cells_10subreps_medianexplainedbyresiduals_varpart_PsB.rds
    Untracked:  output/downsamp_2700cells_10subreps_medianexplainedbyresiduals_varpart_scres.rds
    Untracked:  output/downsamp_5400cells_10subreps_medianexplainedbyresiduals_varpart_PsB.rds
    Untracked:  output/downsamp_7200cells_10subreps_medianexplainedbyresiduals_varpart_PsB.rds
    Untracked:  output/fasttopics/
    Untracked:  output/figs/
    Untracked:  output/merge.Cao.SCTwRegressOrigIdent.rds
    Untracked:  output/merge.all.SCTwRegressOrigIdent.Harmony.rds
    Untracked:  output/merged.SCT.counts.matrix.rds
    Untracked:  output/merged.raw.counts.matrix.rds
    Untracked:  output/mergedObjects/
    Untracked:  output/pdfs/
    Untracked:  output/sampleQCrds/
    Untracked:  output/splitgpm_gsea_results/
    Untracked:  slurm-12005914.out
    Untracked:  slurm-12005923.out

Unstaged changes:
    Deleted:    analysis/IntegrateAnalysis.afterFilter.HarmonyBatch.Rmd
    Deleted:    analysis/IntegrateAnalysis.afterFilter.HarmonyBatchSampleIDindividual.Rmd
    Deleted:    analysis/IntegrateAnalysis.afterFilter.NOHARMONYjustmerge.Rmd
    Deleted:    analysis/IntegrateAnalysis.afterFilter.SCTregressBatchIndividual.Rmd
    Deleted:    analysis/IntegrateAnalysis.afterFilter.SCTregressBatchIndividualHarmonyBatchindividual.Rmd
    Modified:   analysis/Pseudobulk_HierarchicalClustering_Harmony.Batchindividual_ClusterRes0.1_minPCT0.2.Rmd
    Modified:   analysis/Pseudobulk_HierarchicalClustering_Harmony.Batchindividual_ClusterRes0.5_minPCT0.2.Rmd
    Modified:   analysis/Pseudobulk_HierarchicalClustering_Harmony.Batchindividual_ClusterRes0.8_minPCT0.2.Rmd
    Modified:   analysis/Pseudobulk_HierarchicalClustering_Harmony.Batchindividual_ClusterRes1_minPCT0.2.Rmd
    Modified:   analysis/Pseudobulk_Limma_Harmony.BatchIndividual_ClusterRes0.1_minPCT0.2.Rmd
    Modified:   analysis/Pseudobulk_Limma_Harmony.BatchIndividual_ClusterRes0.5_minPCT0.2.Rmd
    Modified:   analysis/Pseudobulk_VariancePartition_Harmony.Batchindividual_ClusterRes0.1_minPCT0.2.Rmd
    Modified:   analysis/Pseudobulk_VariancePartition_Harmony.Batchindividual_ClusterRes0.5_minPCT0.2.Rmd
    Modified:   analysis/Pseudobulk_VariancePartition_Harmony.Batchindividual_ClusterRes0.8_minPCT0.2.Rmd
    Modified:   analysis/Pseudobulk_VariancePartition_Harmony.Batchindividual_ClusterRes1_minPCT0.2.Rmd
    Deleted:    analysis/RunscHCL_HarmonyBatchInd.Rmd
Note that any generated files, e.g. HTML, png, CSS, etc., are not included in this status report because it is ok for generated content to have uncommitted changes.
These are the previous versions of the repository in which changes were made to the R Markdown (analysis/IntegrateAnalysis.afterFilter.HarmonyBatchindividual.Rmd) and HTML (docs/IntegrateAnalysis.afterFilter.HarmonyBatchindividual.html) files. If you've configured a remote Git repository (see ?wflow_git_remote), click on the hyperlinks in the table below to view the files as they were in that past version.
| File | Version | Author | Date | Message |
|---|---|---|---|---|
| Rmd | e9247fb | KLRhodes | 2021-07-05 | wflow_publish("analysis/IntegrateAnalysis.afterFilter.HarmonyBatchindividual.Rmd") |
| html | edaa6a3 | KLRhodes | 2020-08-11 | Build site. |
| Rmd | f50ebd3 | KLRhodes | 2020-08-10 | wflow_publish("analysis/Integrate*") |
| html | 421a225 | KLRhodes | 2020-08-10 | Build site. |
| Rmd | bc8ec6f | KLRhodes | 2020-08-10 | cleaning various versions of merging/intCurrent working directory |
library(Seurat)
library(harmony)
library(ggplot2)
library(DataCombine)
library(here)
library(RColorBrewer)
options(future.globals.maxSize= 15000*1024^2) #allow global exceeding 4Gb
Read in the files, add metadata, and create an object list
filelist<-list.files(here::here('output/sampleQCrds/'), full.names = T)
objectlist<- list()
for (i in 1:length(filelist)){
  rds<- readRDS(filelist[i])
  objectlist[i]<- rds

}
create a merged seurat object
ids<-substr(basename(filelist),1,12)
merged<- merge(objectlist[[1]], c(objectlist[[2]], objectlist[[3]],objectlist[[4]],objectlist[[5]],objectlist[[6]],objectlist[[7]],objectlist[[8]],objectlist[[9]],objectlist[[10]],objectlist[[11]],objectlist[[12]],objectlist[[13]],objectlist[[14]],objectlist[[15]],objectlist[[16]]),add.cell.ids=ids, merge.data=T)
#need to fix the individual names because they are slightly different from batch1
replacements<- data.frame(from= c("SNG-NA18511.variant2", "SNG-NA18858.variant2", "SNG-NA19160.variant2"), to=c("SNG-NA18511", "SNG-NA18858", "SNG-NA19160"))
merged@meta.data<-FindReplace(merged@meta.data, "individual", replacements, from = "from", to= "to", exact=T, vector=F )Only exact matches will be replaced.#run PCA on full dataset pre-alignment
all.genes= rownames(merged)
merged<-FindVariableFeatures(merged,selection.method="vst", nfeatures = 5000)
#have previously used all genes (nfeatures=25000) and clustering by individual rather than batch (based on proportion of cells per cluster) was still observed downstream. Now using 5000 because it is the upper bound of what has been recommended in the literature.
merged<- ScaleData(merged, features = all.genes)Centering and scaling data matrixmerged<-RunPCA(merged, npcs = 100, verbose=F)DimPlot(merged, reduction = "pca", group.by = "Batch")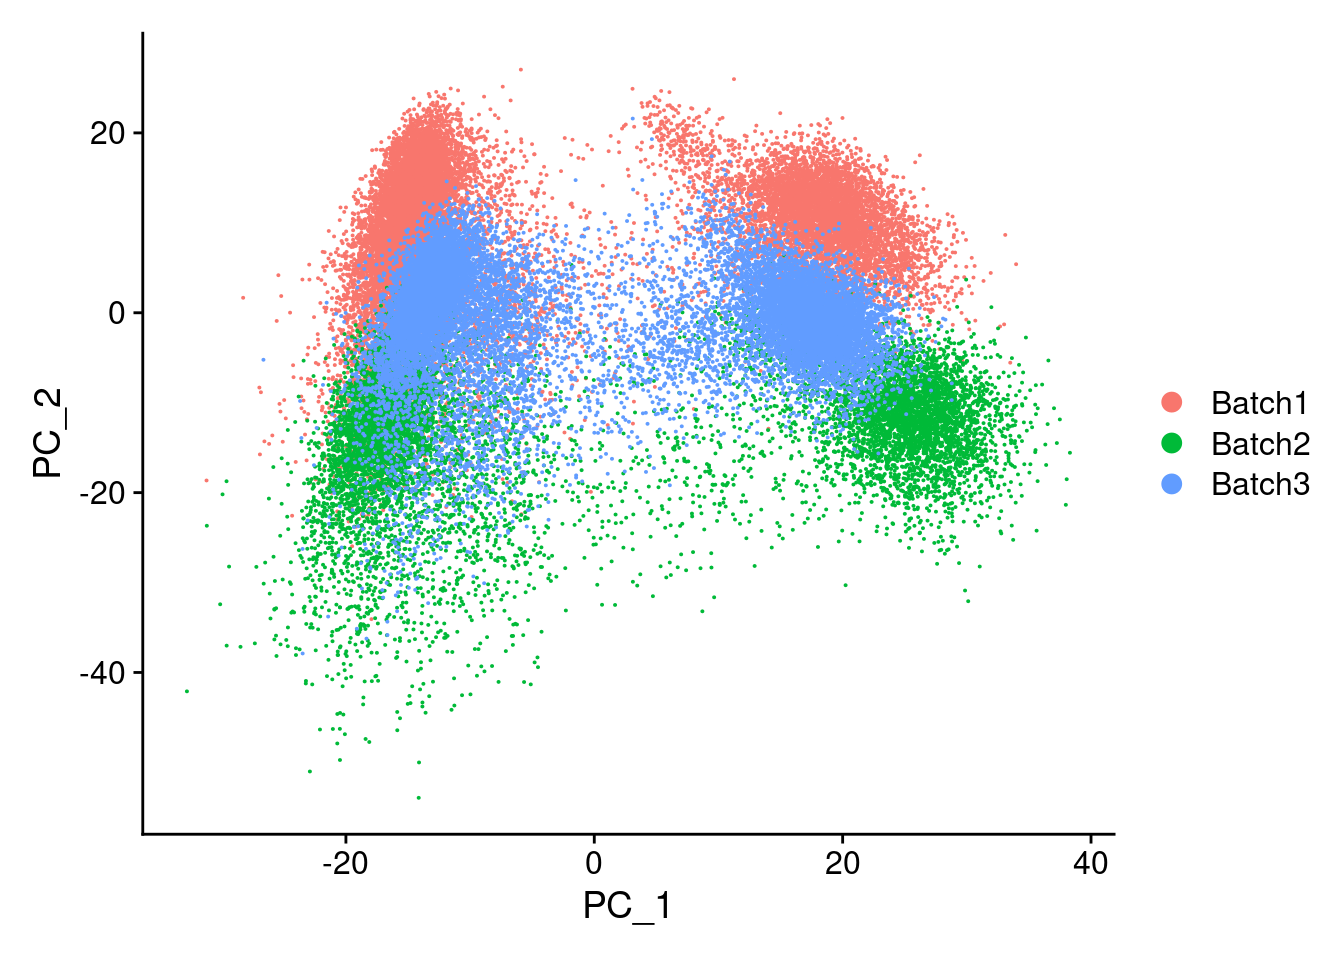
| Version | Author | Date |
|---|---|---|
| 421a225 | KLRhodes | 2020-08-10 |
Now, running harmony to integrate. Here, using Batch, SampleID(10x Lane), and individual to integrate. Since Batch and Lane are confounded, this may over correct for Batch.
merged<- RunHarmony(merged, c("Batch", "individual"), plot_convergence = T, assay.use = "SCT")Harmony 1/10Harmony 2/10Harmony 3/10Harmony converged after 3 iterationsWarning: Invalid name supplied, making object name syntactically valid. New
object name is Seurat..ProjectDim.SCT.harmony; see ?make.names for more details
on syntax validity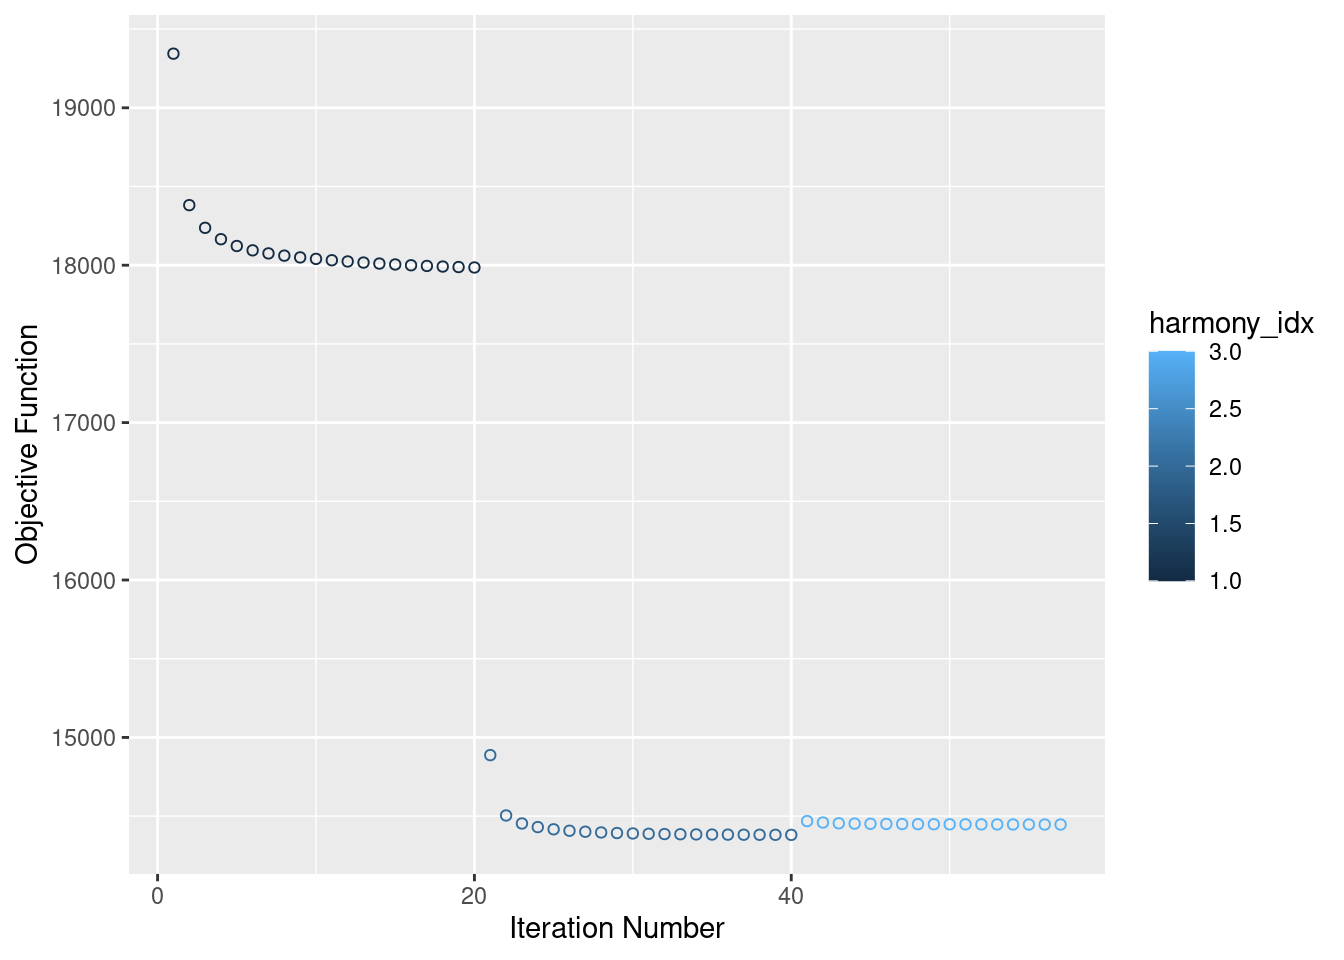
| Version | Author | Date |
|---|---|---|
| 421a225 | KLRhodes | 2020-08-10 |
Visualize Harmony embeddings
DimPlot(merged, reduction="harmony", group.by= c("individual", "Batch"), combine=F)[[1]]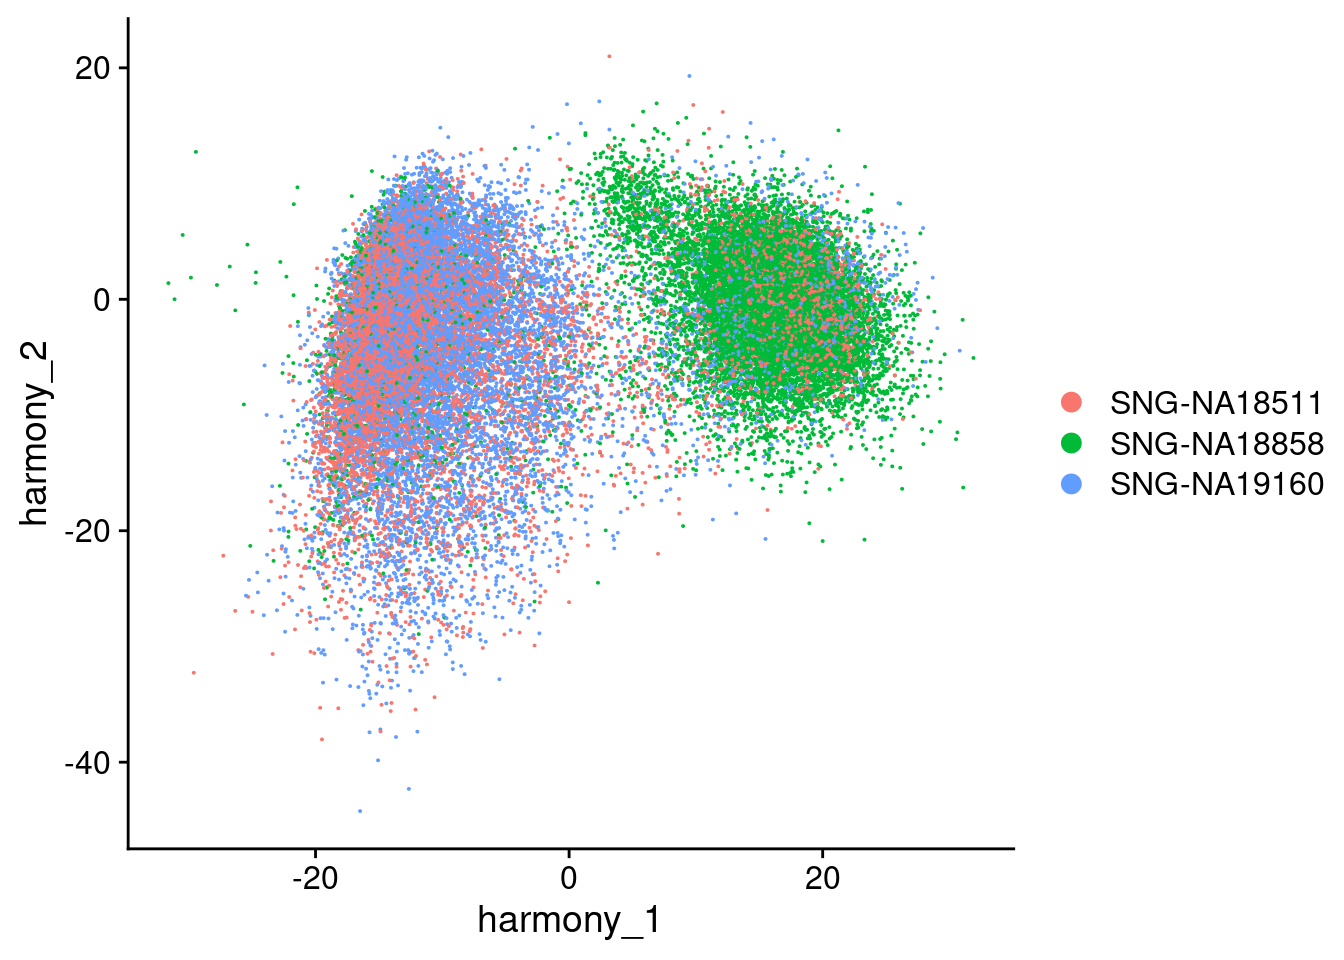
| Version | Author | Date |
|---|---|---|
| 421a225 | KLRhodes | 2020-08-10 |
[[2]]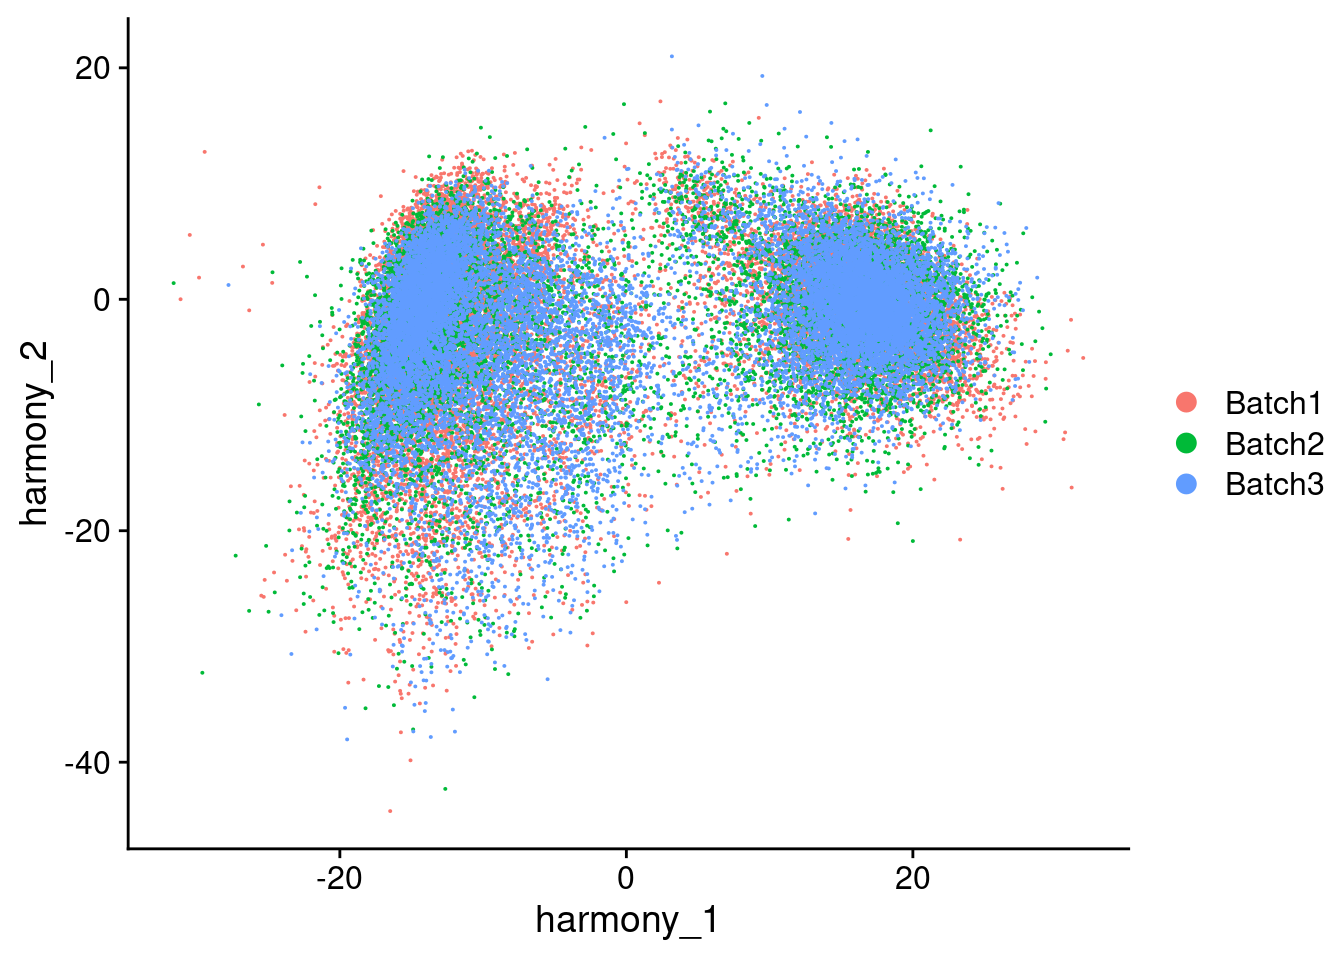
| Version | Author | Date |
|---|---|---|
| 421a225 | KLRhodes | 2020-08-10 |
Now Running UMAP and identifying clusters, etc
merged<- RunUMAP(merged, reduction = "harmony", dims = 1:100, verbose = F)Warning: The default method for RunUMAP has changed from calling Python UMAP via reticulate to the R-native UWOT using the cosine metric
To use Python UMAP via reticulate, set umap.method to 'umap-learn' and metric to 'correlation'
This message will be shown once per sessionmerged<- FindNeighbors(merged, reduction="harmony", dims = 1:100, verbose = F)
merged<- FindClusters(merged, resolution=1, verbose = F)
merged<- FindClusters(merged, resolution=0.8, verbose = F)
merged<- FindClusters(merged, resolution=0.5, verbose = F)
merged<- FindClusters(merged, resolution=0.1, verbose = F)SAVING merged/aligned/reclustered object
path<- here::here("output/mergedObjects/")
saveRDS(merged, file=paste0(path,'Harmony.Batchindividual.rds'))
#reassign idents
Idents(merged)<- 'SCT_snn_res.1'VizDimLoadings(merged, dims = 1:2, reduction = "harmony")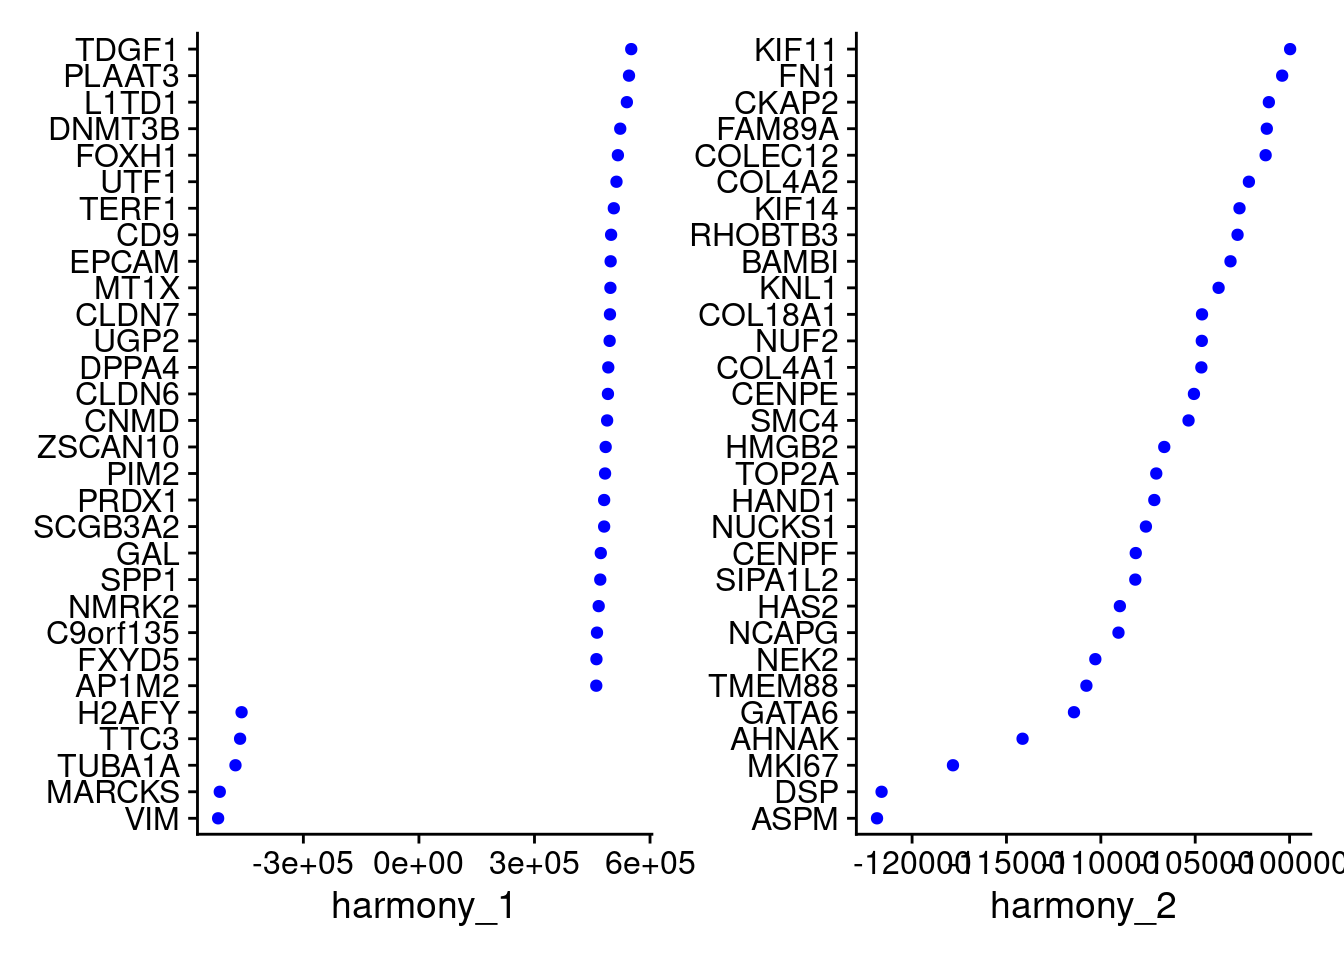
| Version | Author | Date |
|---|---|---|
| 421a225 | KLRhodes | 2020-08-10 |
VizDimLoadings(merged, dims = 3:4, reduction = "harmony")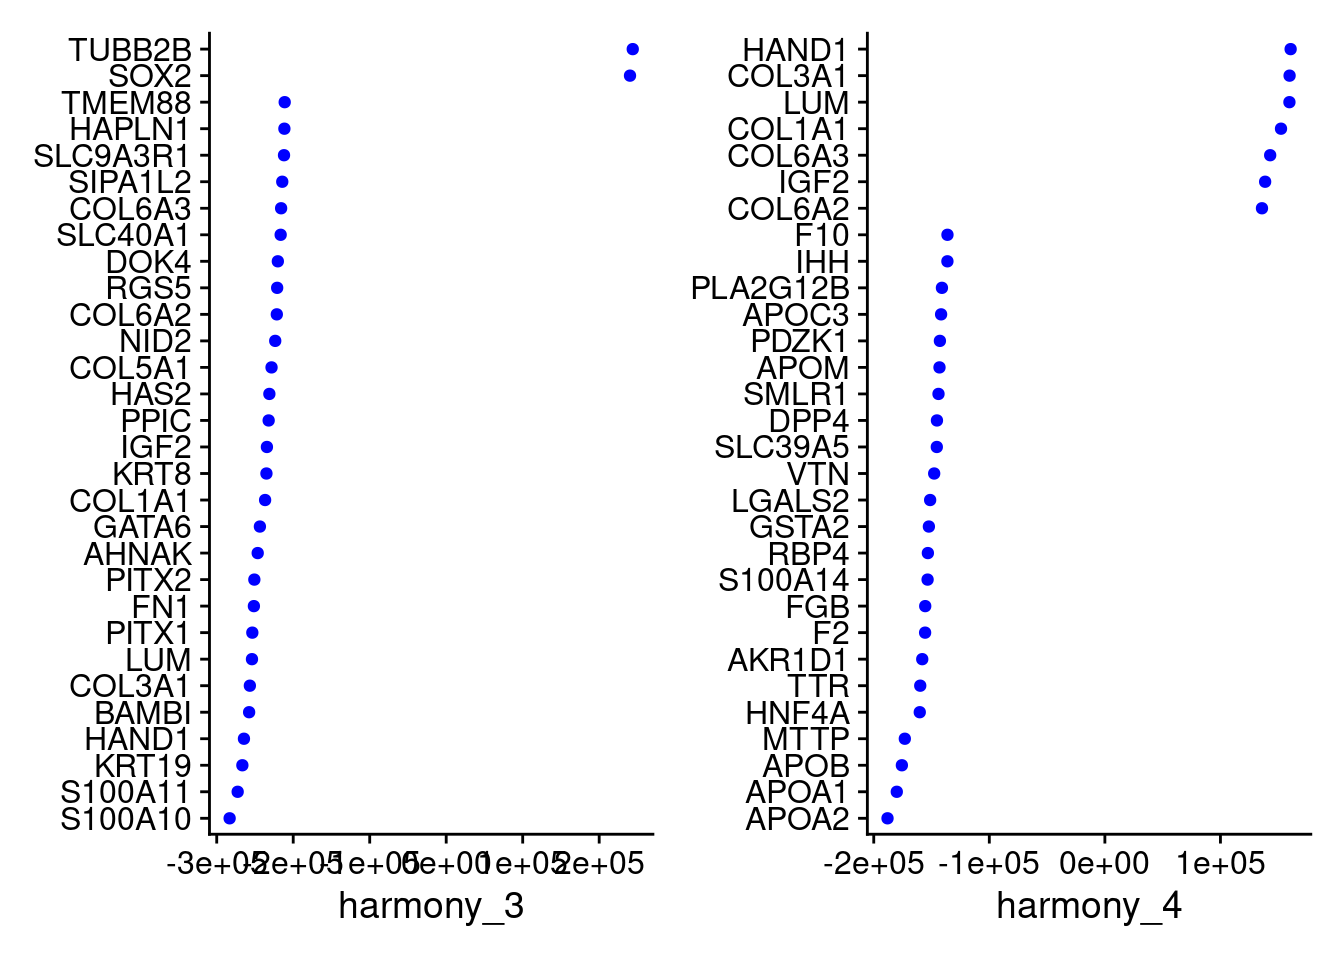
| Version | Author | Date |
|---|---|---|
| 421a225 | KLRhodes | 2020-08-10 |
VizDimLoadings(merged, dims = 5:6, reduction = "harmony")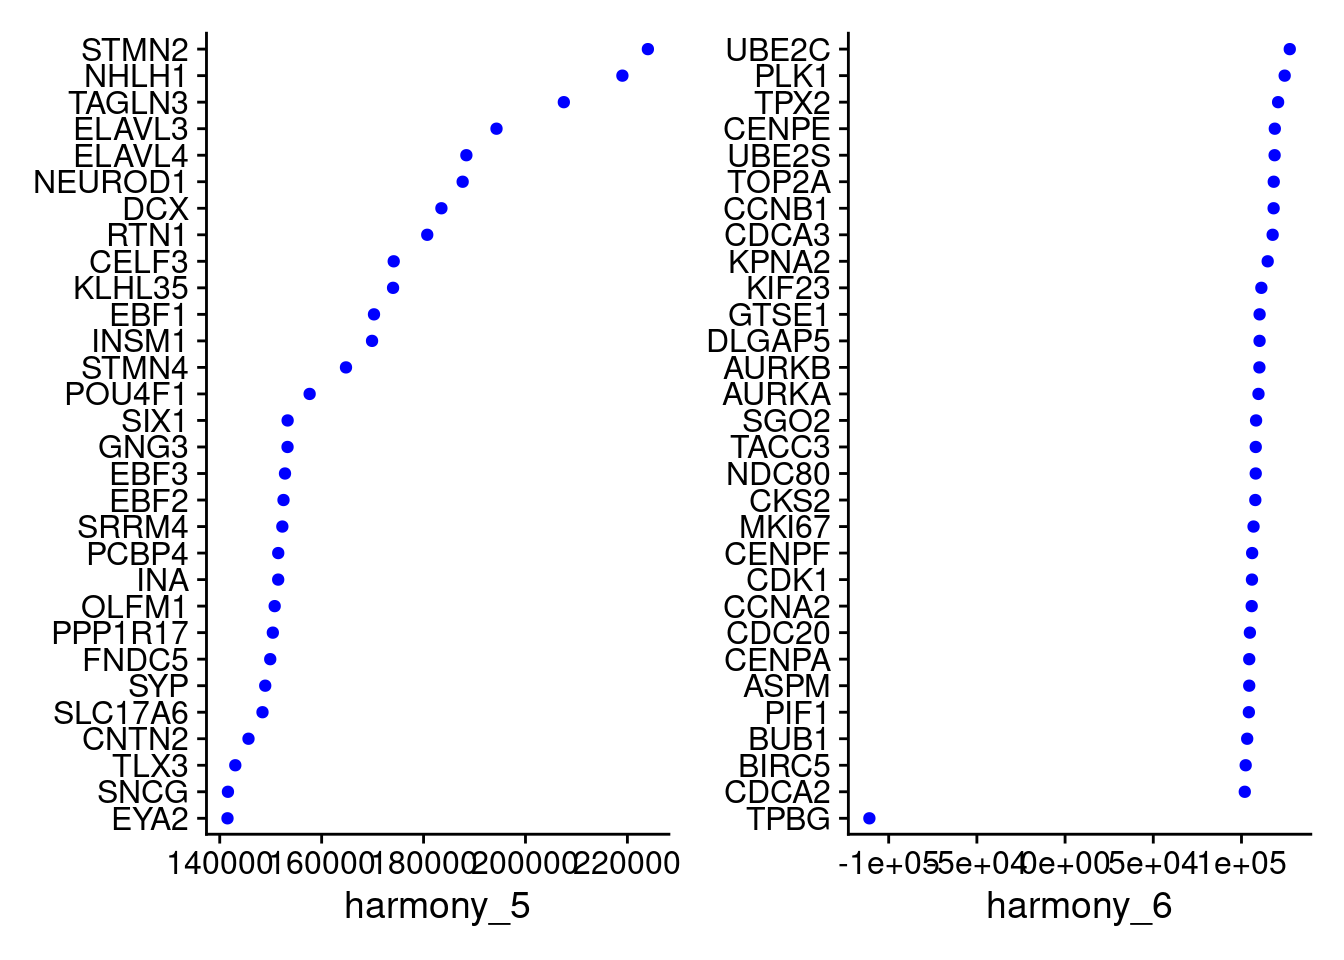
| Version | Author | Date |
|---|---|---|
| 421a225 | KLRhodes | 2020-08-10 |
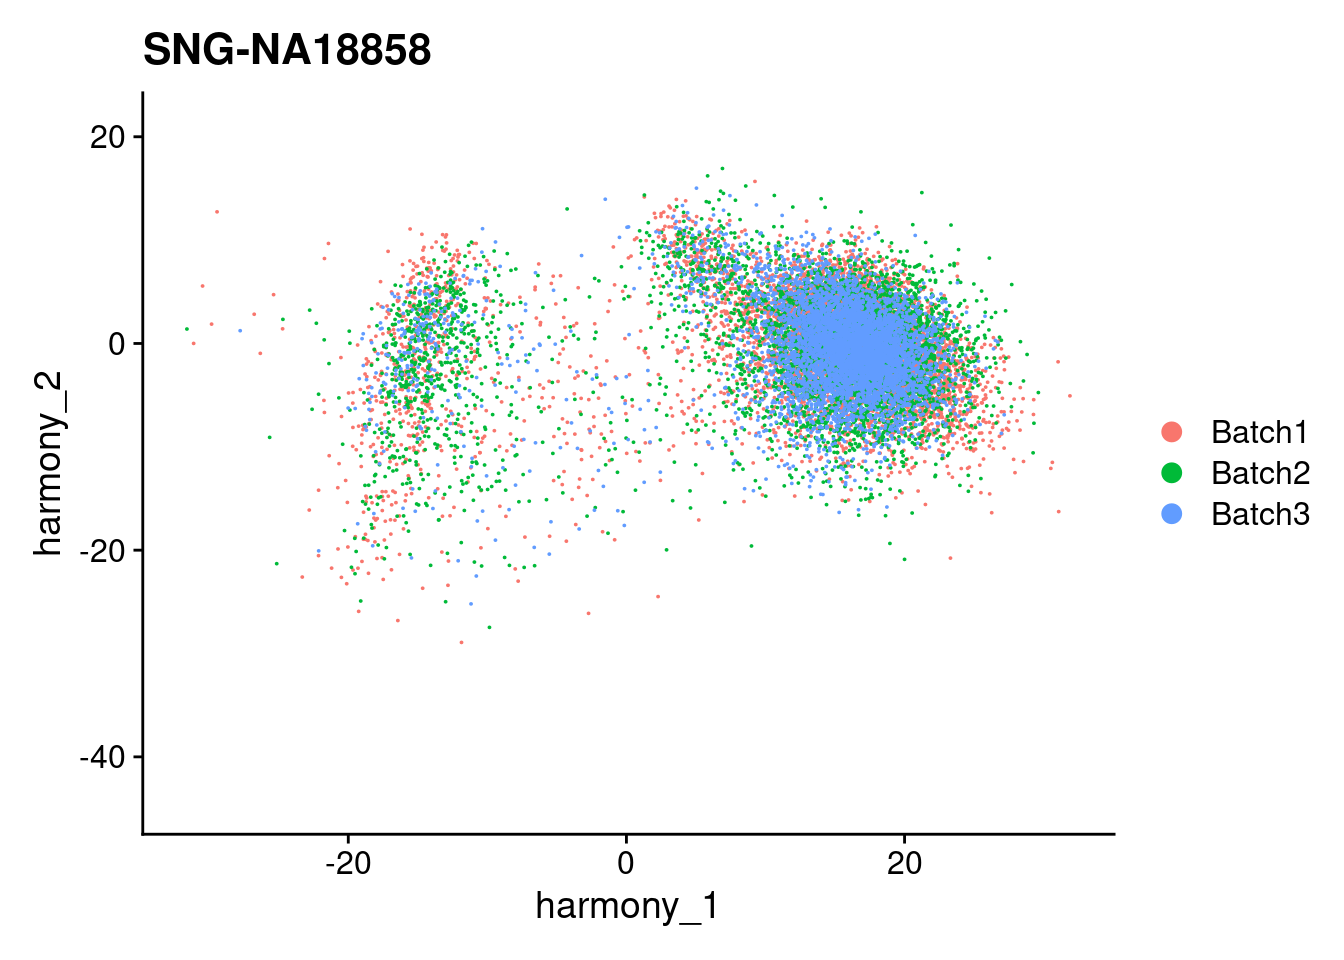
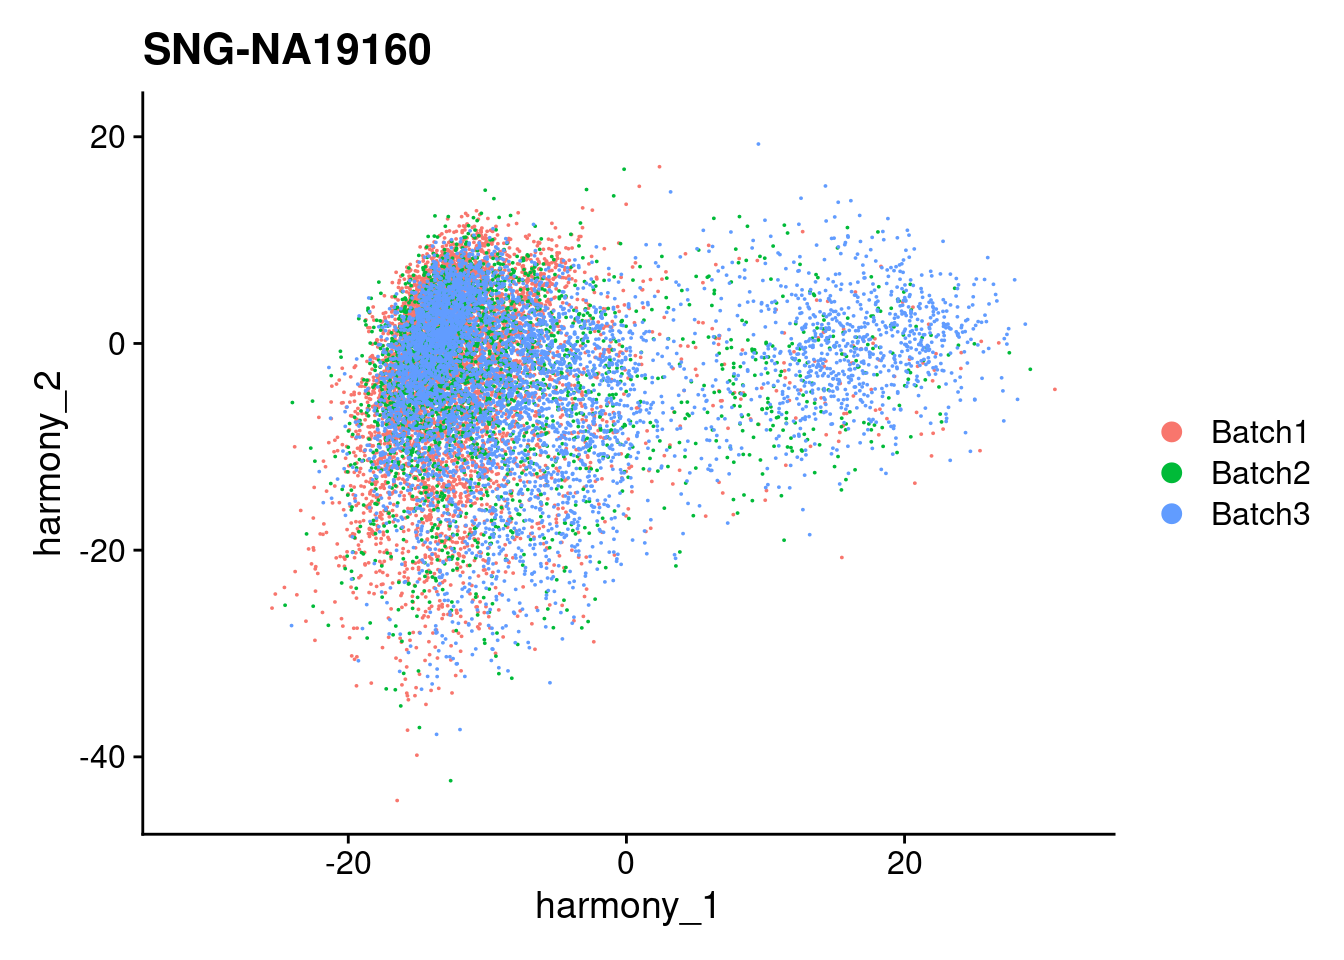
xlim <- c(min(merged@reductions$harmony@cell.embeddings[,'harmony_1']),
max(merged@reductions$harmony@cell.embeddings[,'harmony_1']))
ylim <- c(min(merged@reductions$harmony@cell.embeddings[,'harmony_2']),
max(merged@reductions$harmony@cell.embeddings[,'harmony_2']))
individuals <- table(merged$individual)
individuals <- individuals[individuals>50]
individuals <- names(individuals)
for (i in individuals)
{
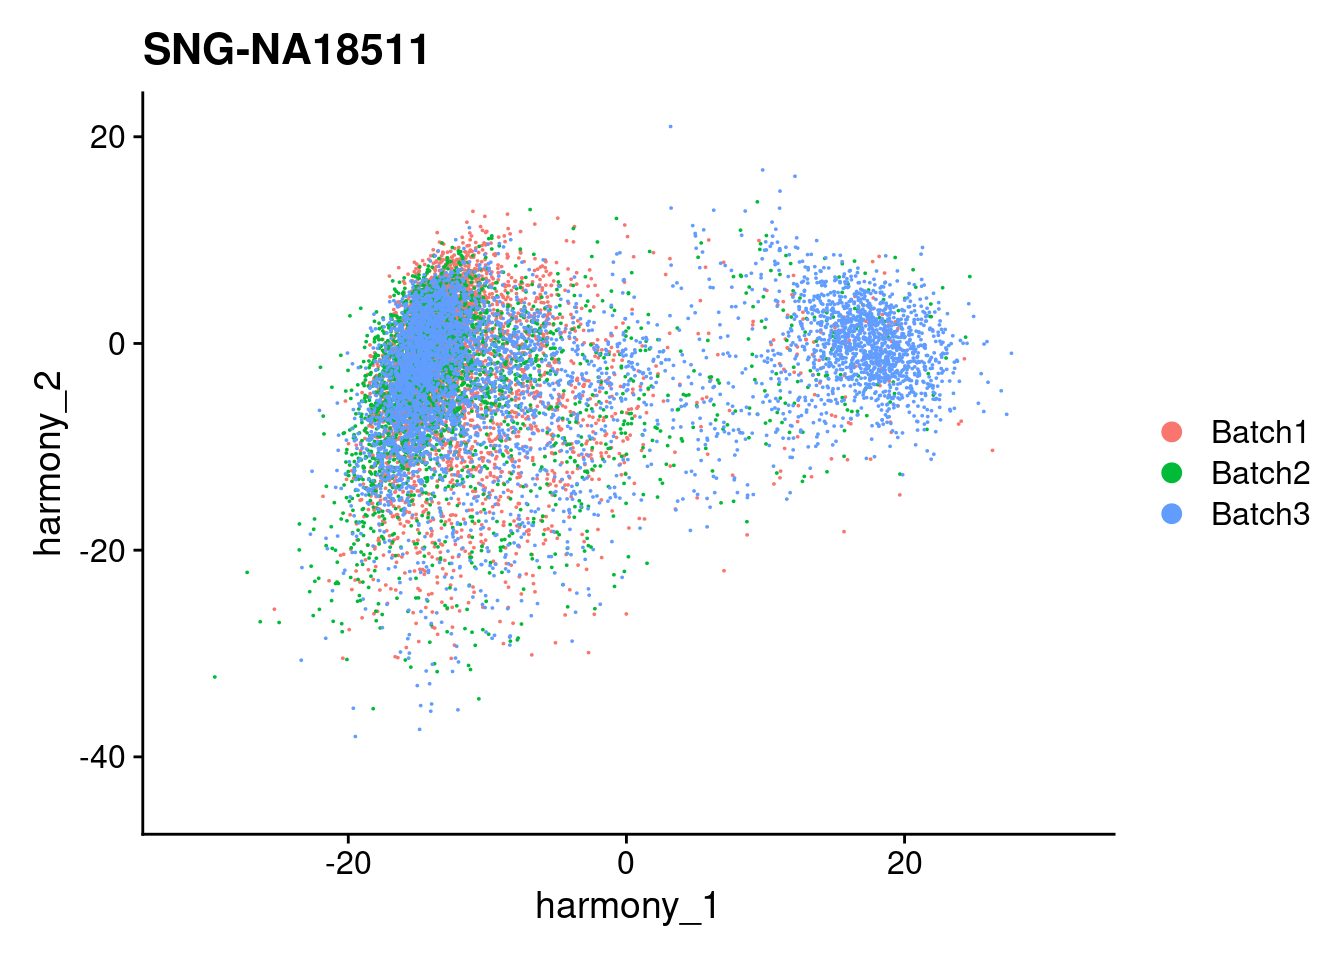
print(DimPlot(merged, reduction = "harmony", group.by = c("Batch"), pt.size = 0.01,
cells = WhichCells(merged, expression = individual == i)) +
xlim(xlim) + ylim(ylim) + ggtitle(i))
}
| Version | Author | Date |
|---|---|---|
| 421a225 | KLRhodes | 2020-08-10 |
| Version | Author | Date |
|---|---|---|
| 421a225 | KLRhodes | 2020-08-10 |
| Version | Author | Date |
|---|---|---|
| 421a225 | KLRhodes | 2020-08-10 |
DimPlot(merged, reduction = "umap")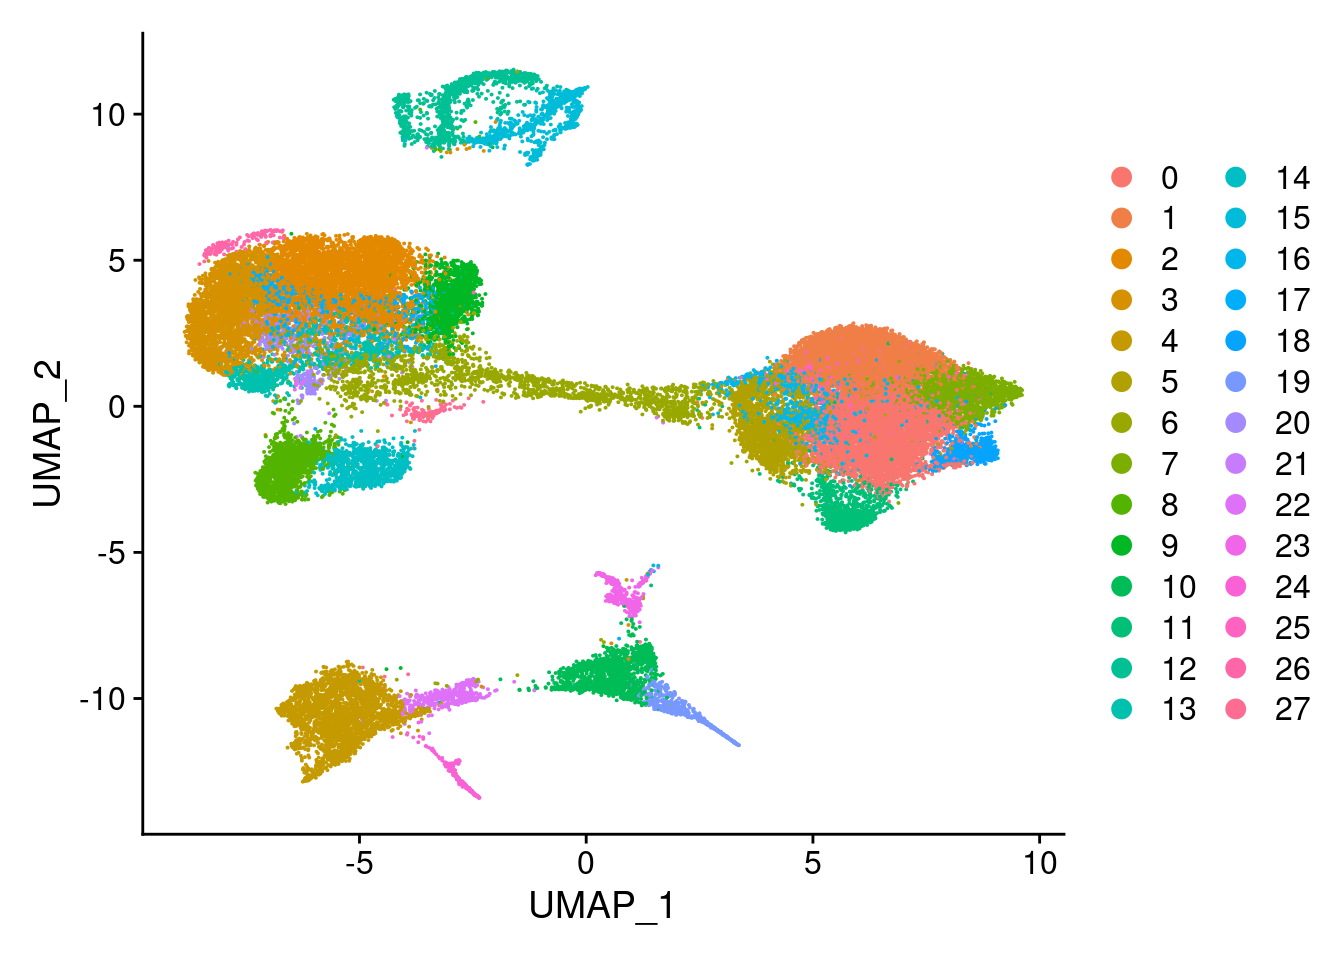
| Version | Author | Date |
|---|---|---|
| 421a225 | KLRhodes | 2020-08-10 |
DimPlot(merged, reduction = "umap", group.by = "Batch")
| Version | Author | Date |
|---|---|---|
| 421a225 | KLRhodes | 2020-08-10 |
DimPlot(merged, reduction = "umap", group.by = "individual")
| Version | Author | Date |
|---|---|---|
| 421a225 | KLRhodes | 2020-08-10 |
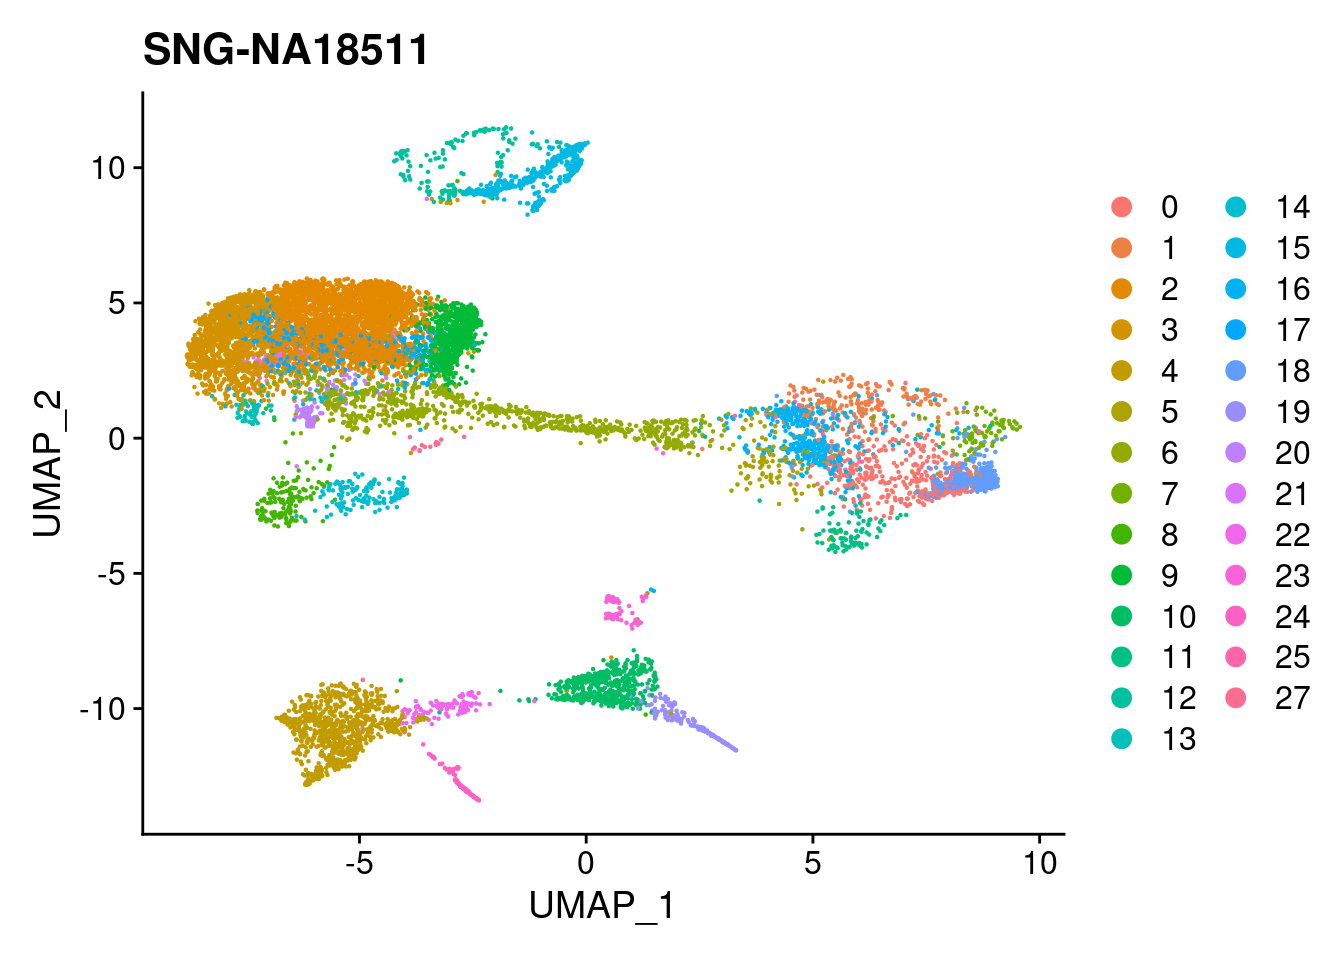
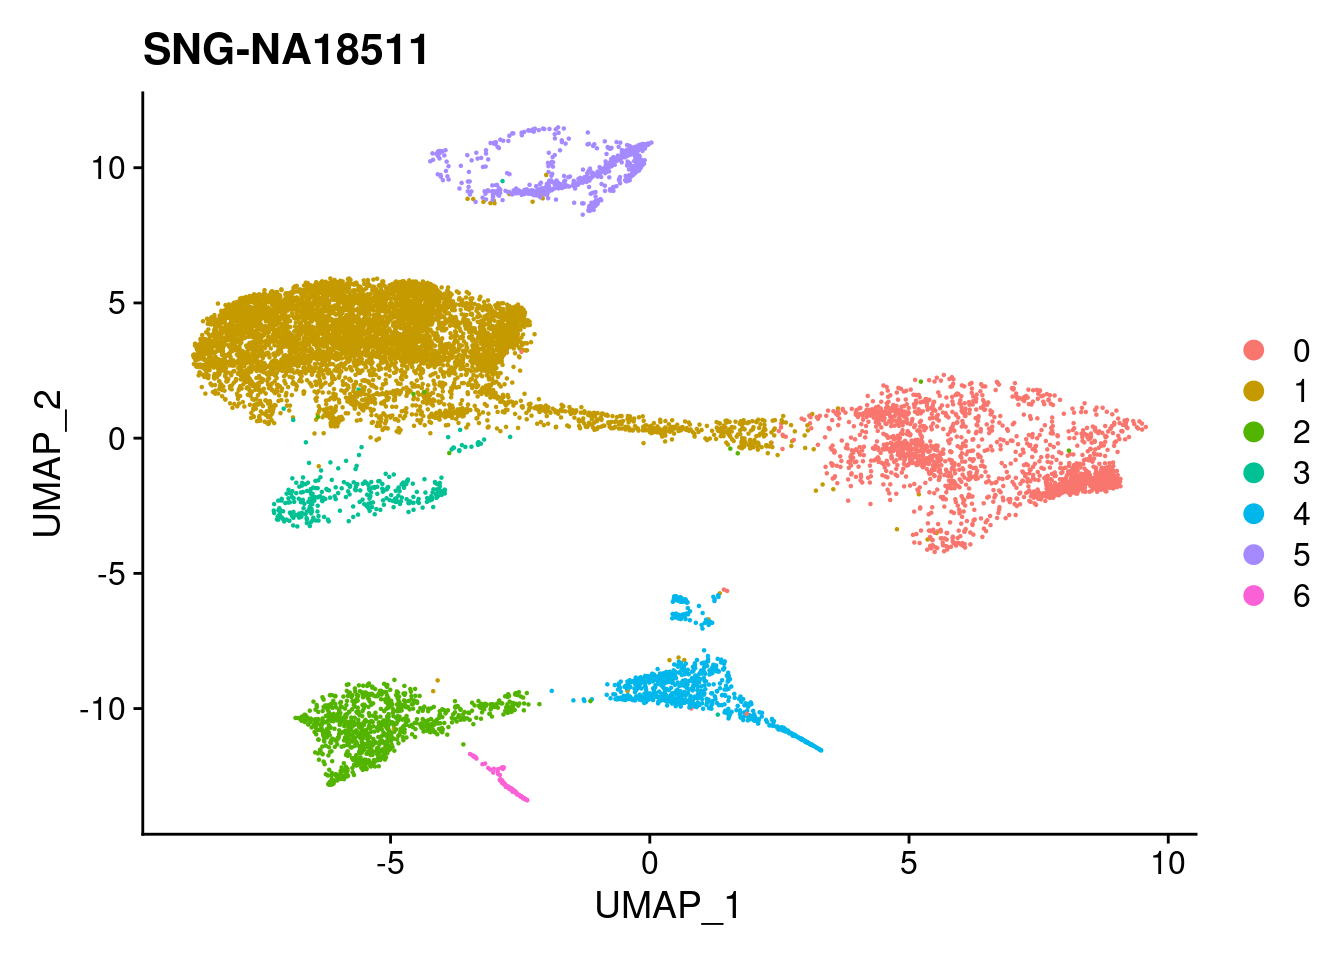
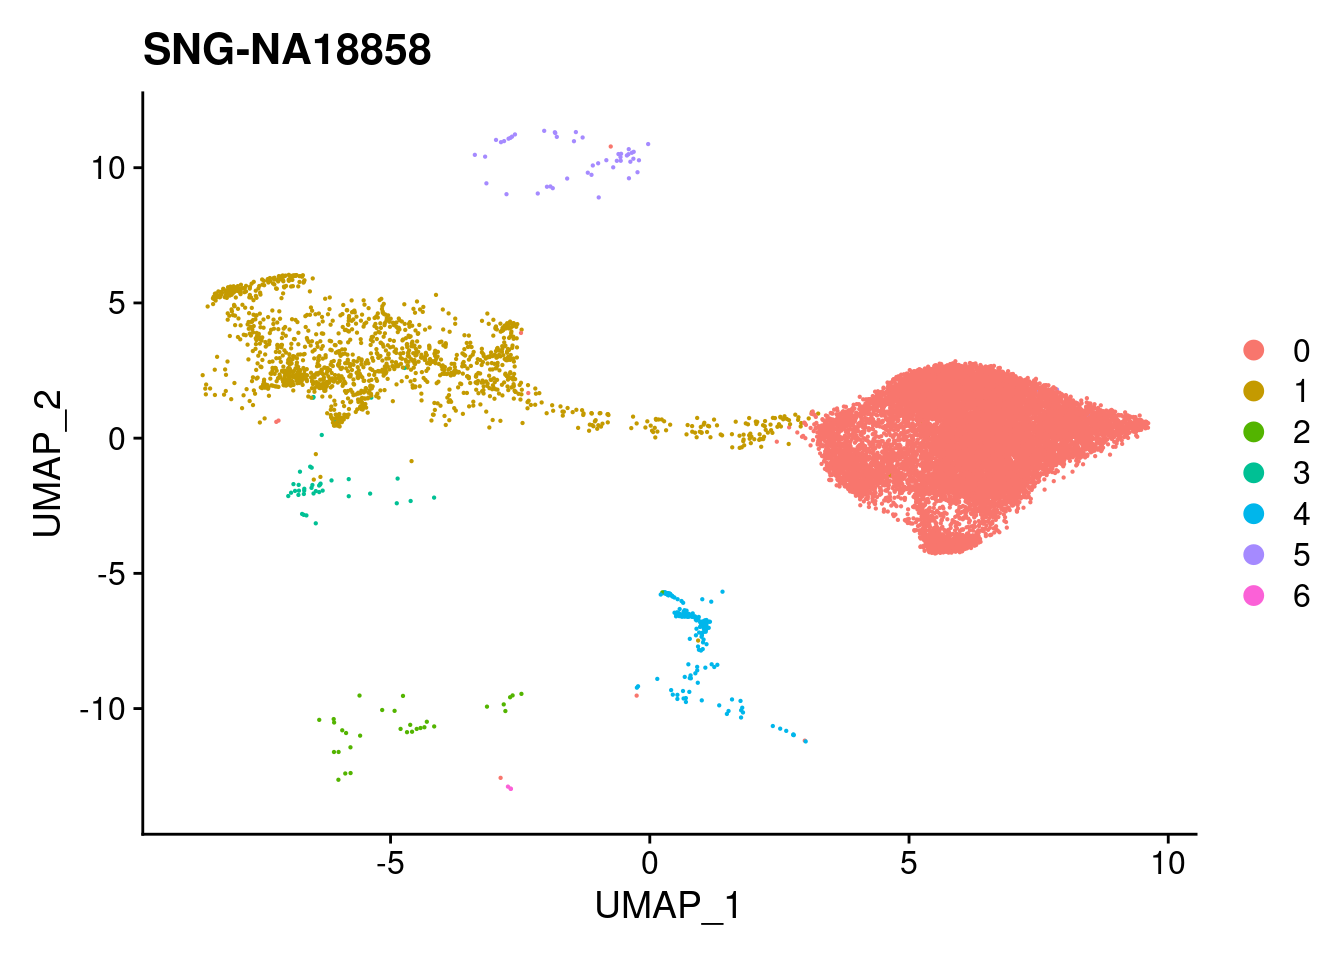
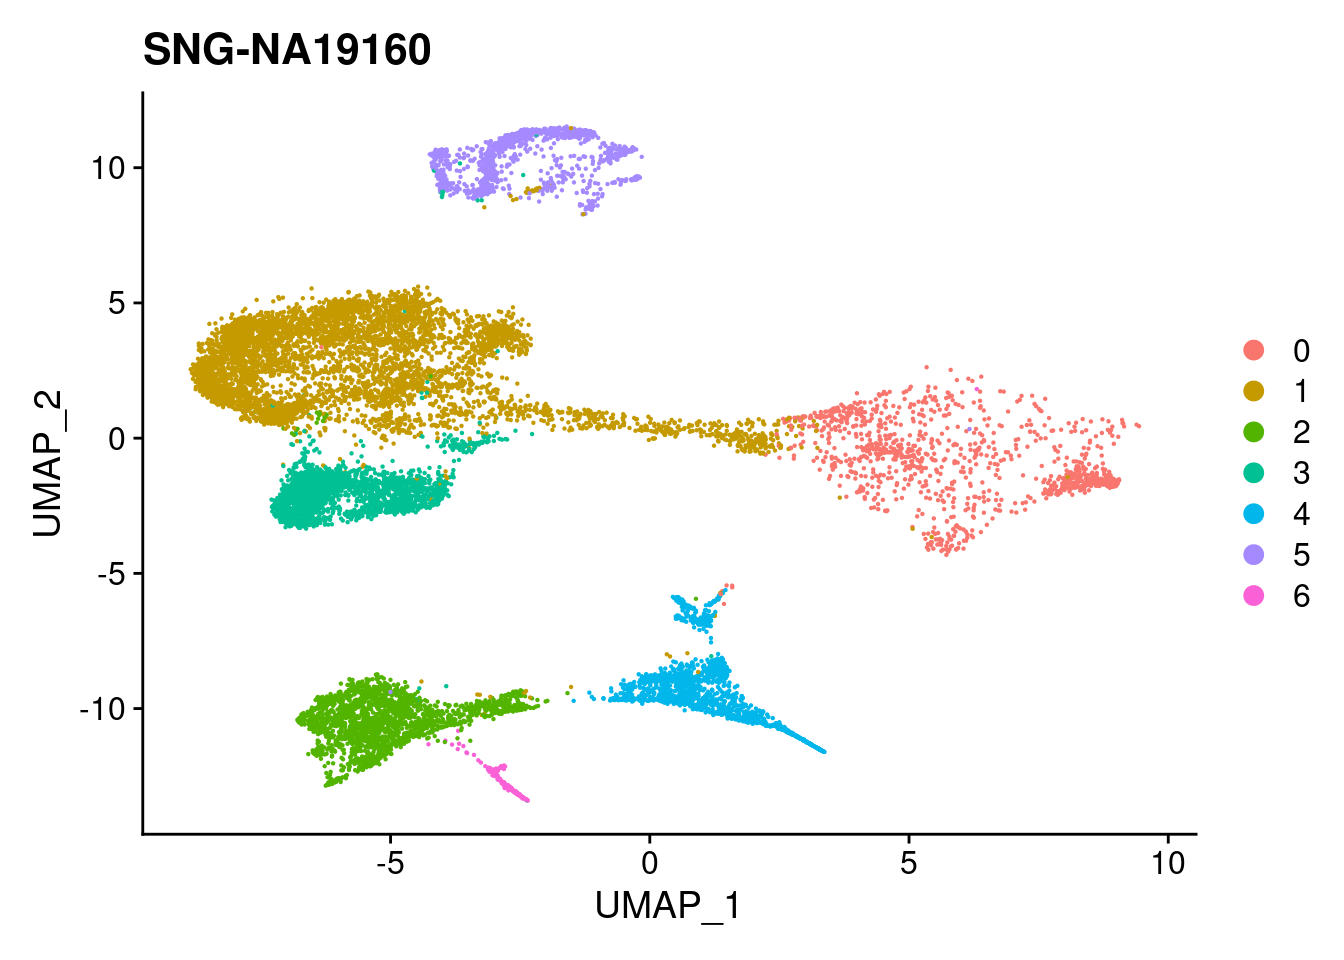
xlim <- c(min(merged@reductions$umap@cell.embeddings[,'UMAP_1']),
max(merged@reductions$umap@cell.embeddings[,'UMAP_1']))
ylim <- c(min(merged@reductions$umap@cell.embeddings[,'UMAP_2']),
max(merged@reductions$umap@cell.embeddings[,'UMAP_2']))
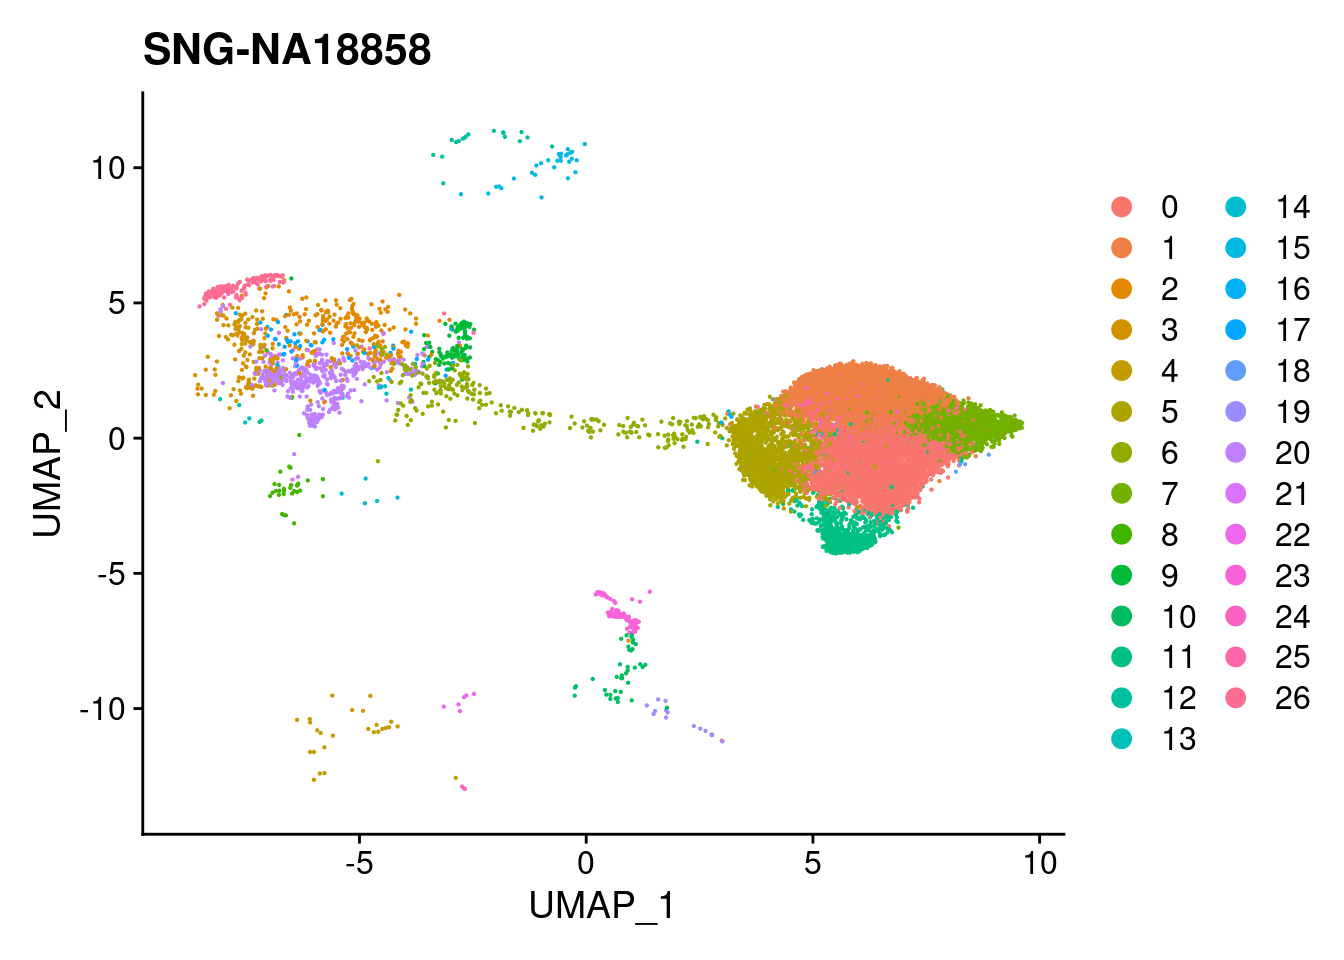
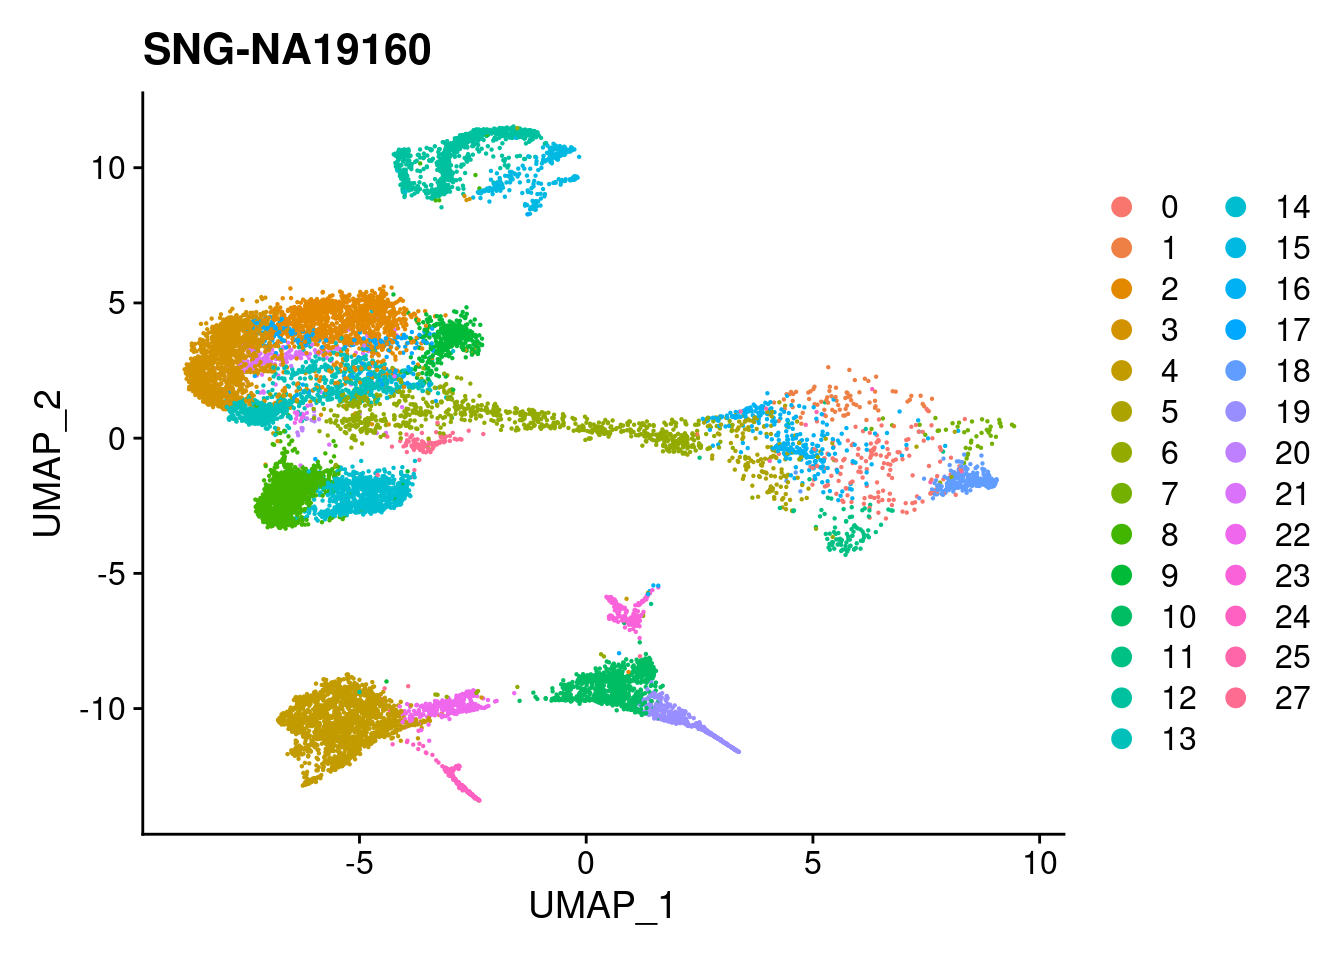
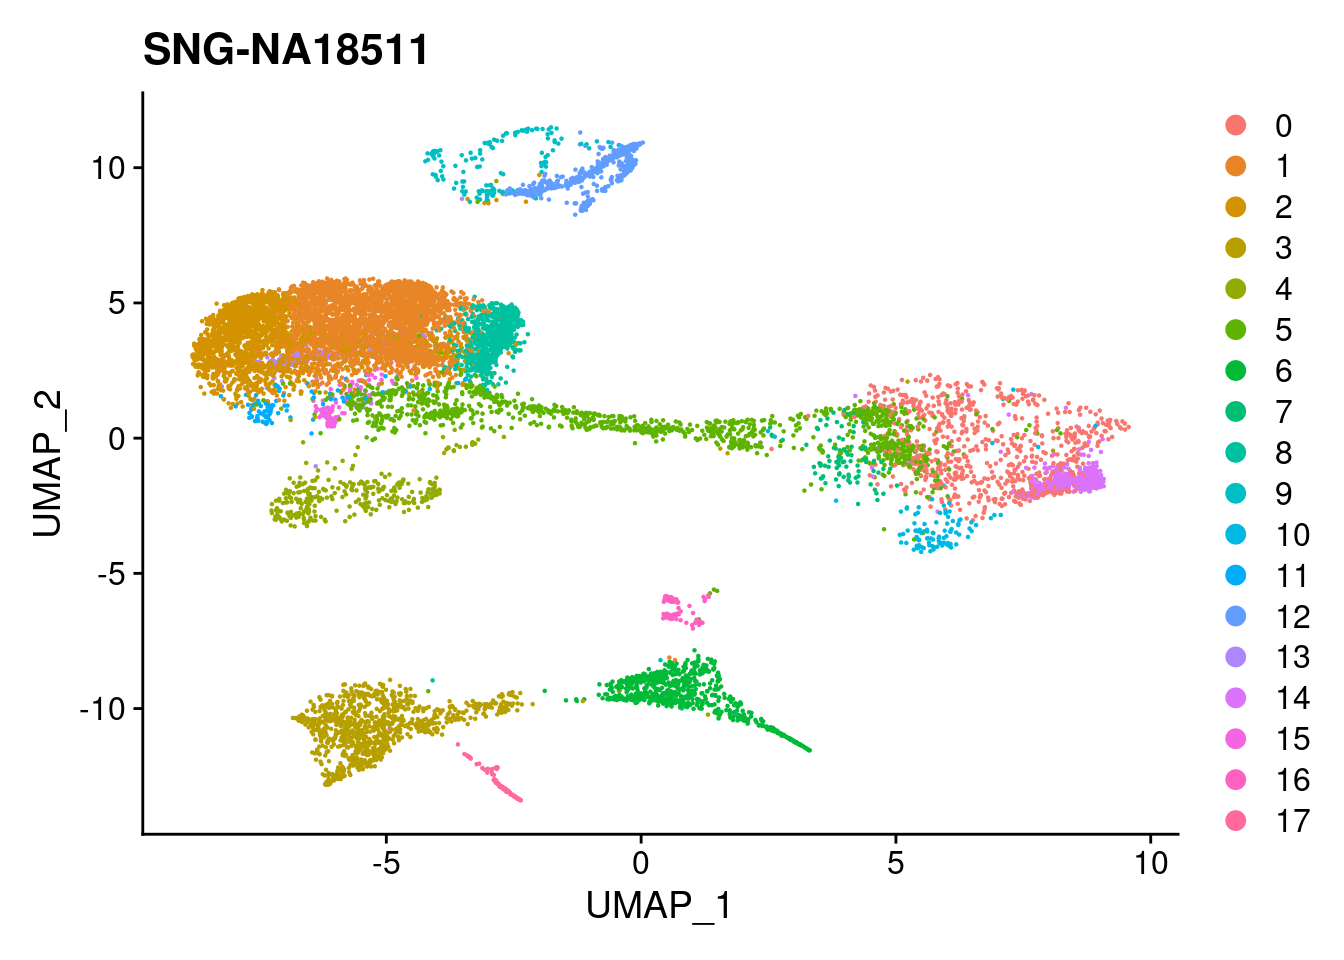
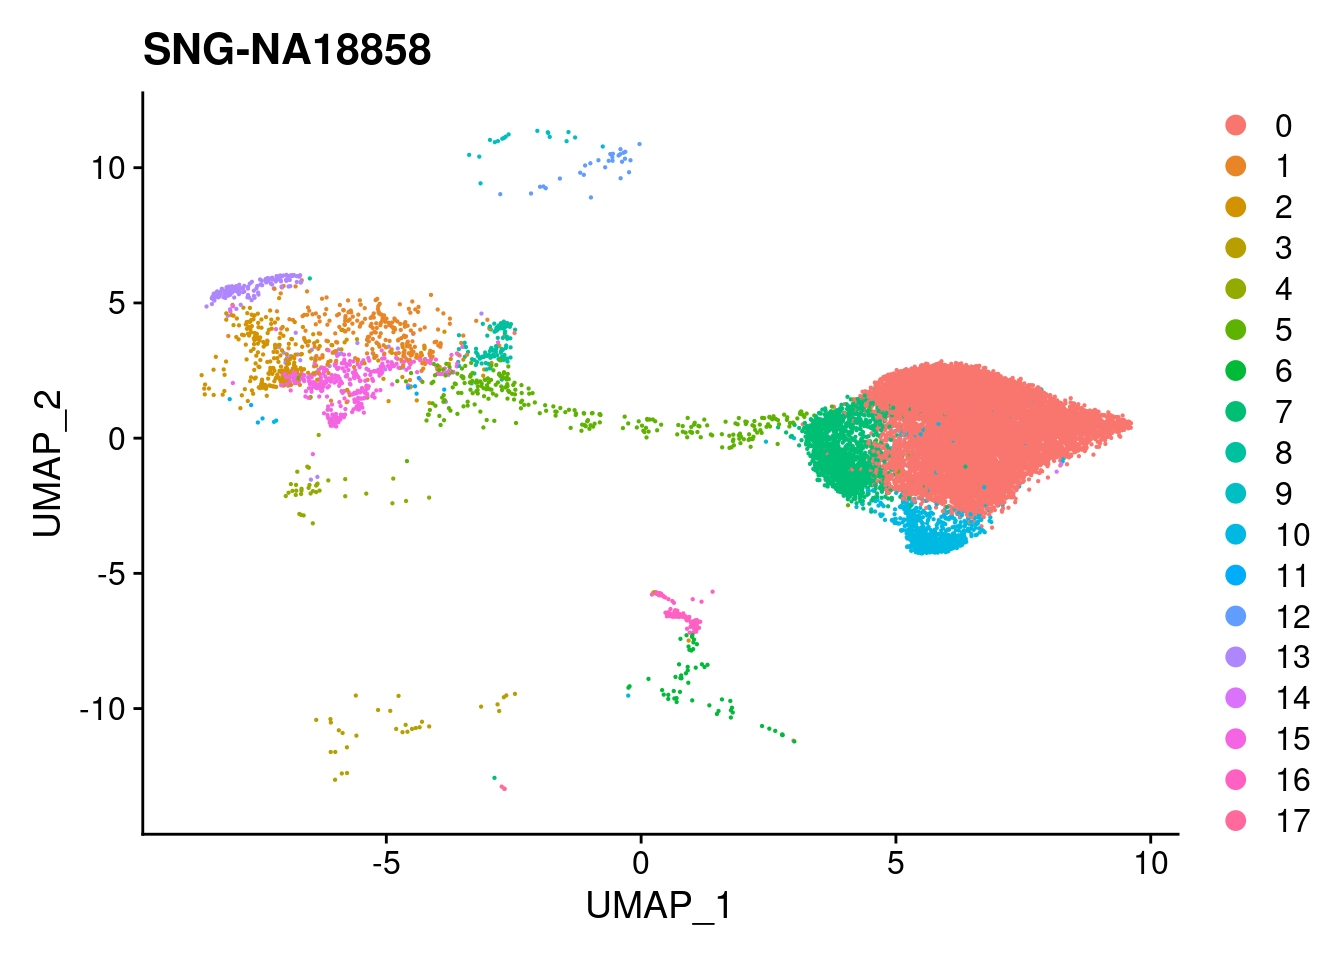
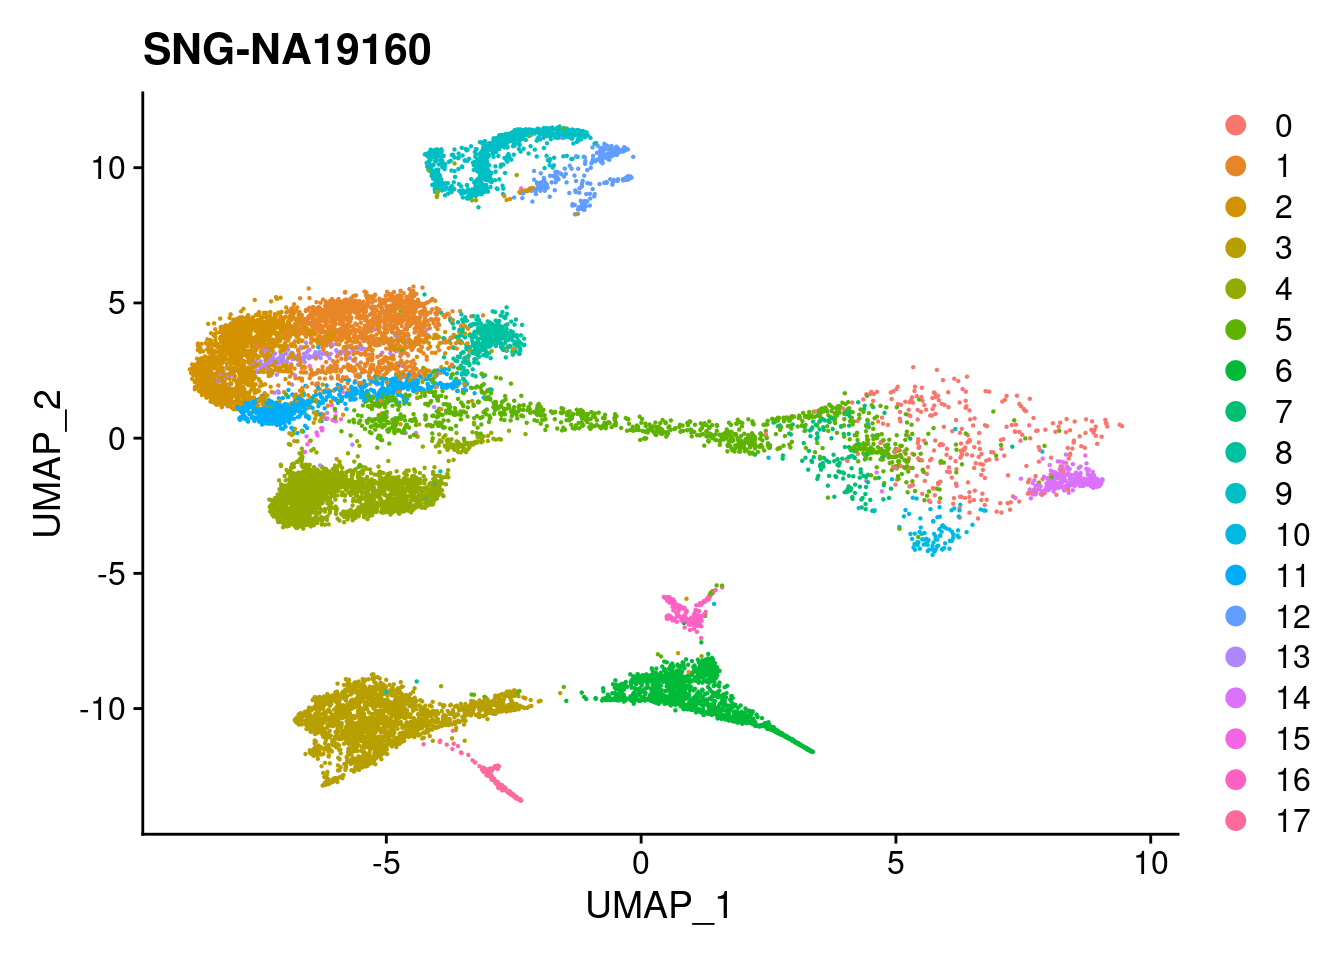
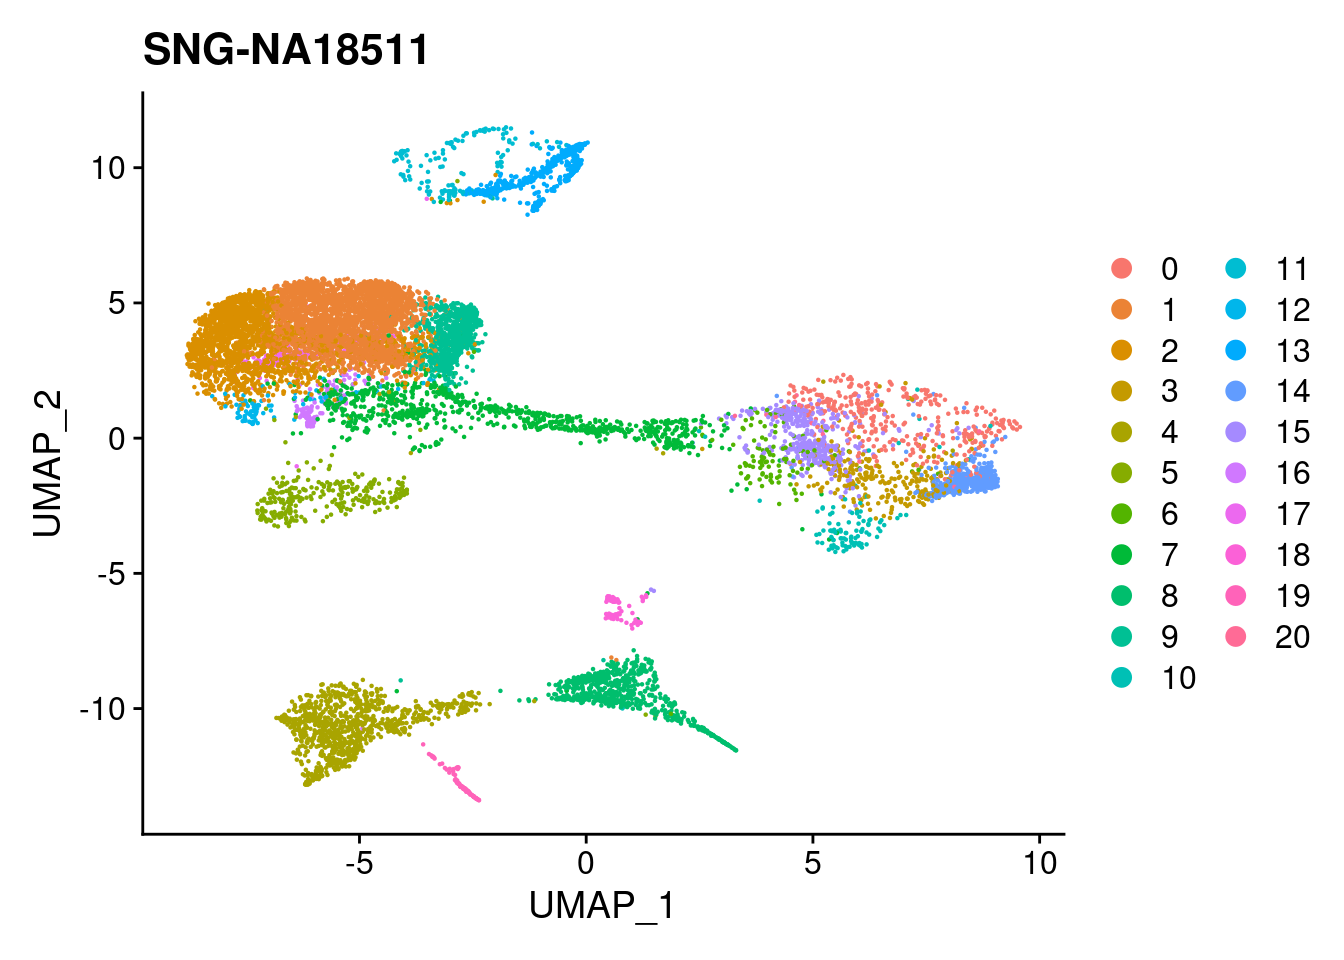
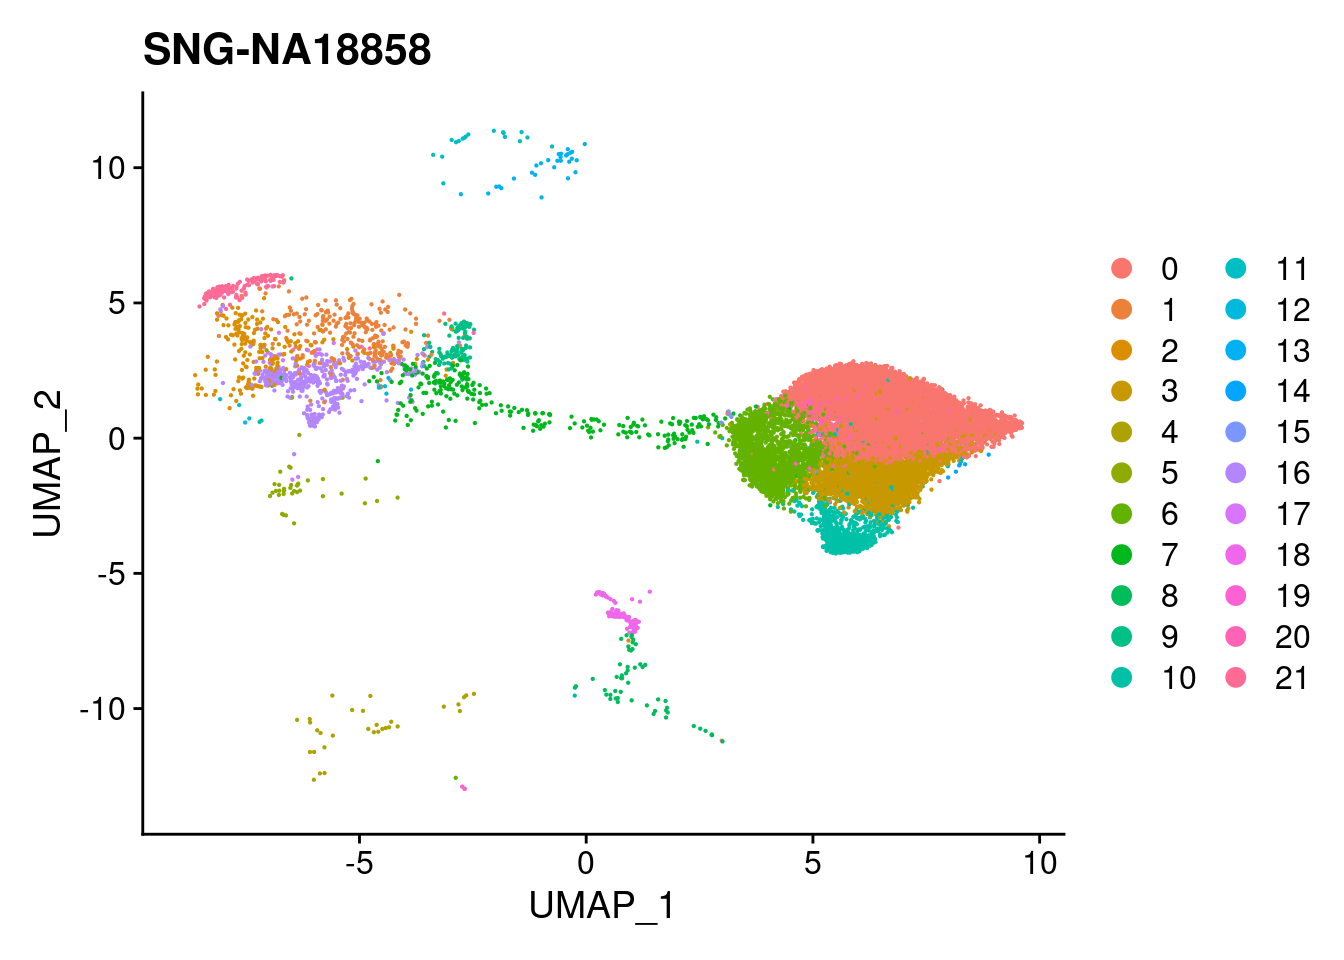
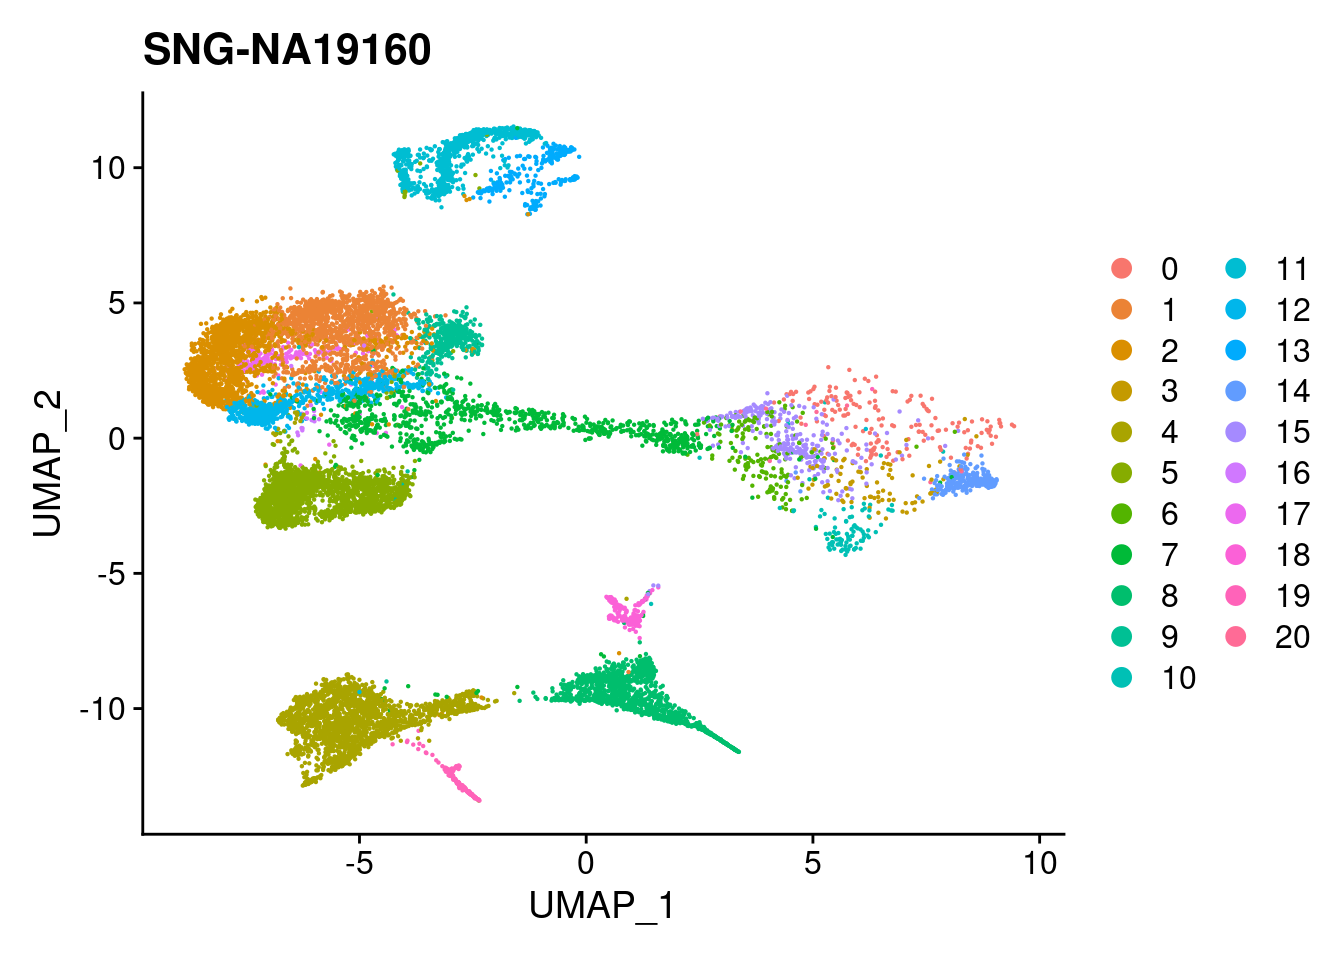
for (i in individuals)
{
print(DimPlot(merged, reduction = "umap",
cells = WhichCells(merged, expression = individual == i)) +
xlim(xlim) + ylim(ylim) + ggtitle(i))
}
| Version | Author | Date |
|---|---|---|
| 421a225 | KLRhodes | 2020-08-10 |
| Version | Author | Date |
|---|---|---|
| 421a225 | KLRhodes | 2020-08-10 |
| Version | Author | Date |
|---|---|---|
| 421a225 | KLRhodes | 2020-08-10 |
plots2<- DimPlot(merged, group.by = "individual", split.by = "Batch")
plots2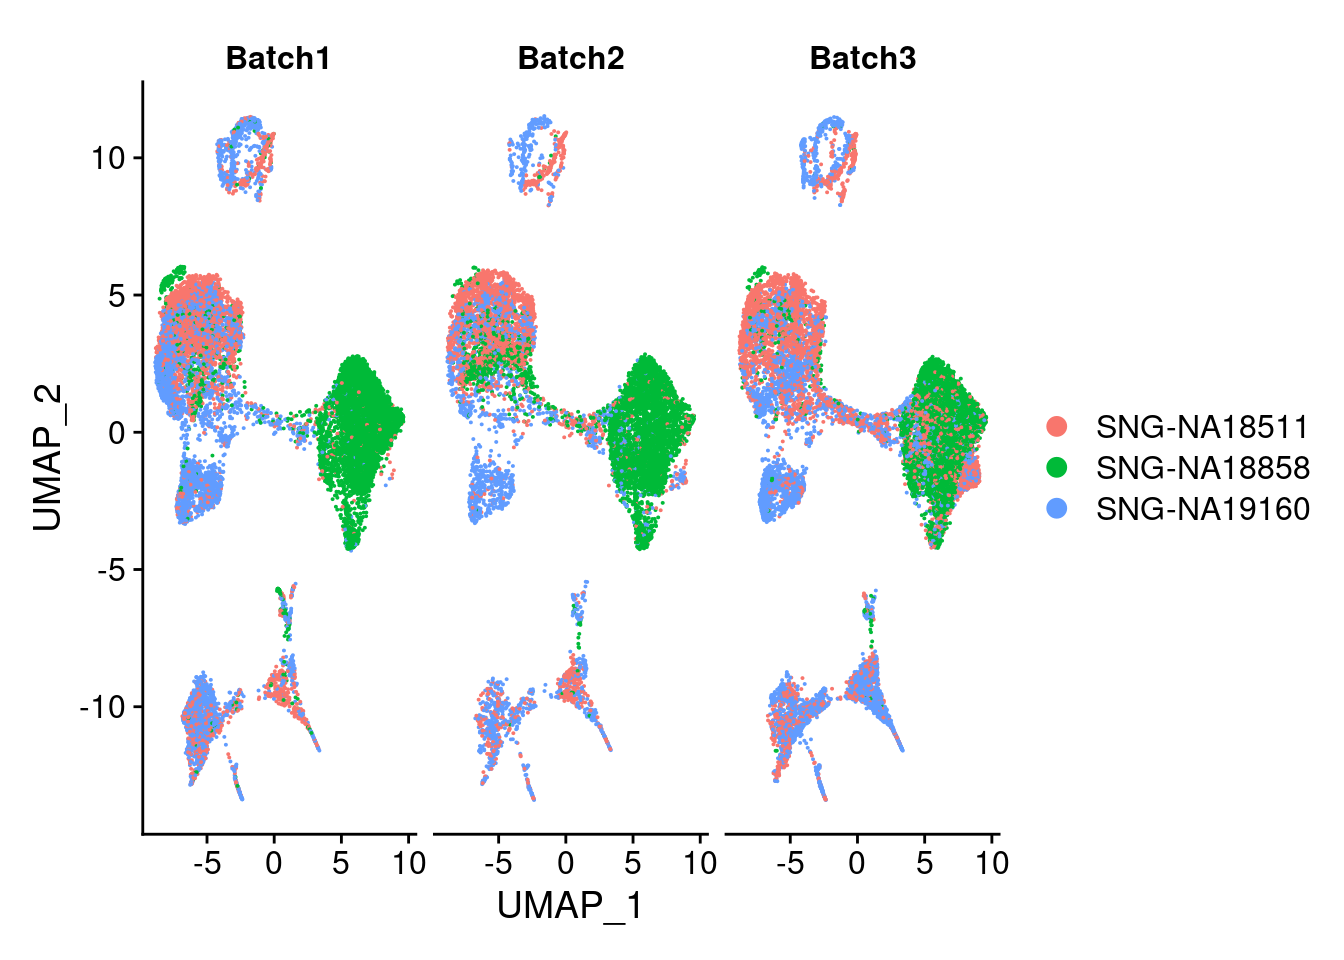
| Version | Author | Date |
|---|---|---|
| 421a225 | KLRhodes | 2020-08-10 |
DimPlot(merged, group.by = "Batch", split.by = c("individual"))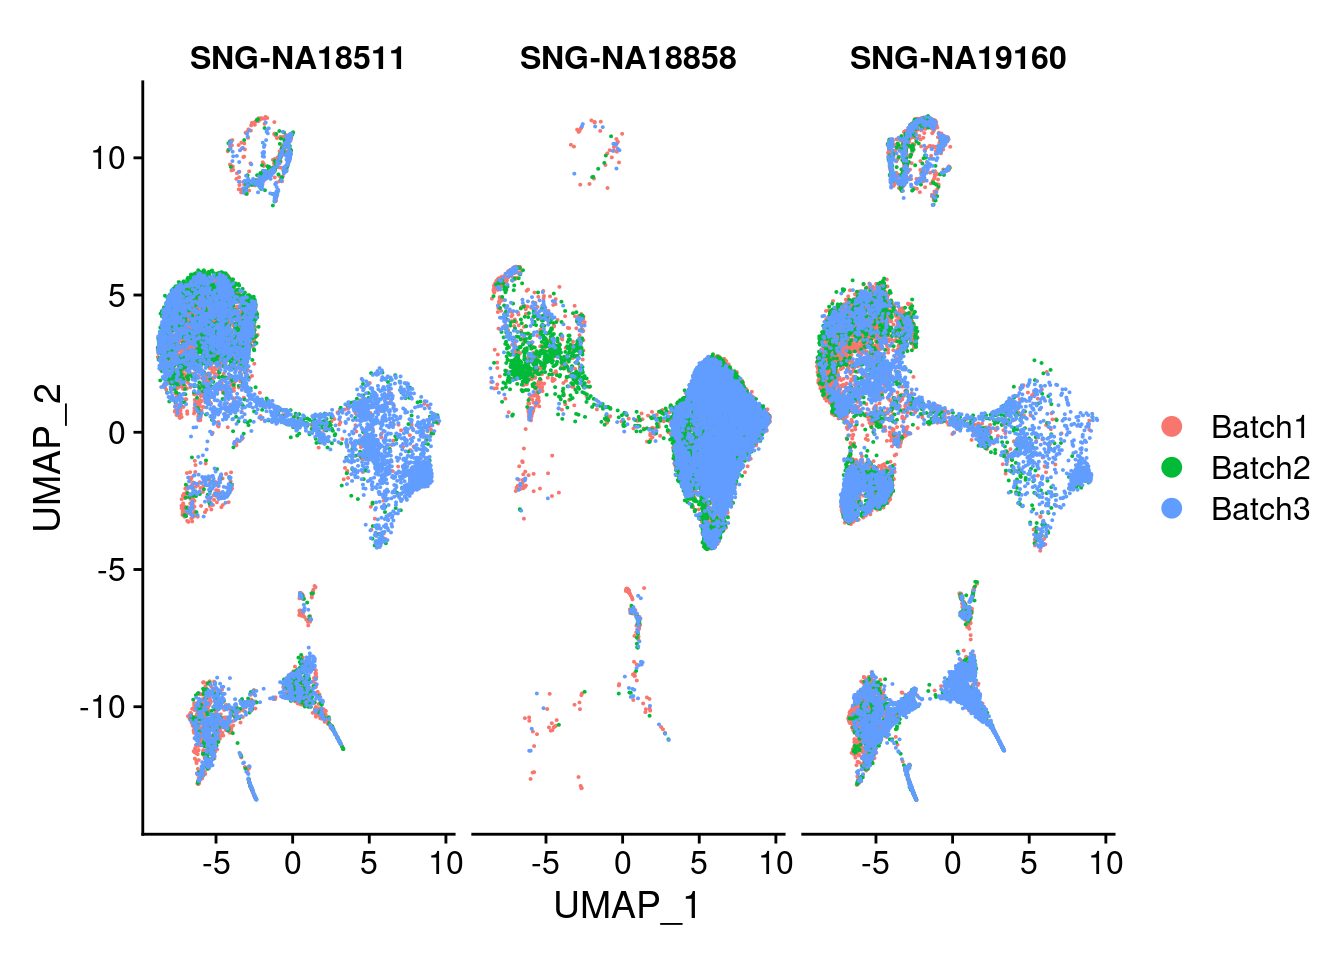
| Version | Author | Date |
|---|---|---|
| 421a225 | KLRhodes | 2020-08-10 |
DimPlot(merged, group.by = "SCT_snn_res.1", split.by = c("Batch"), label=T)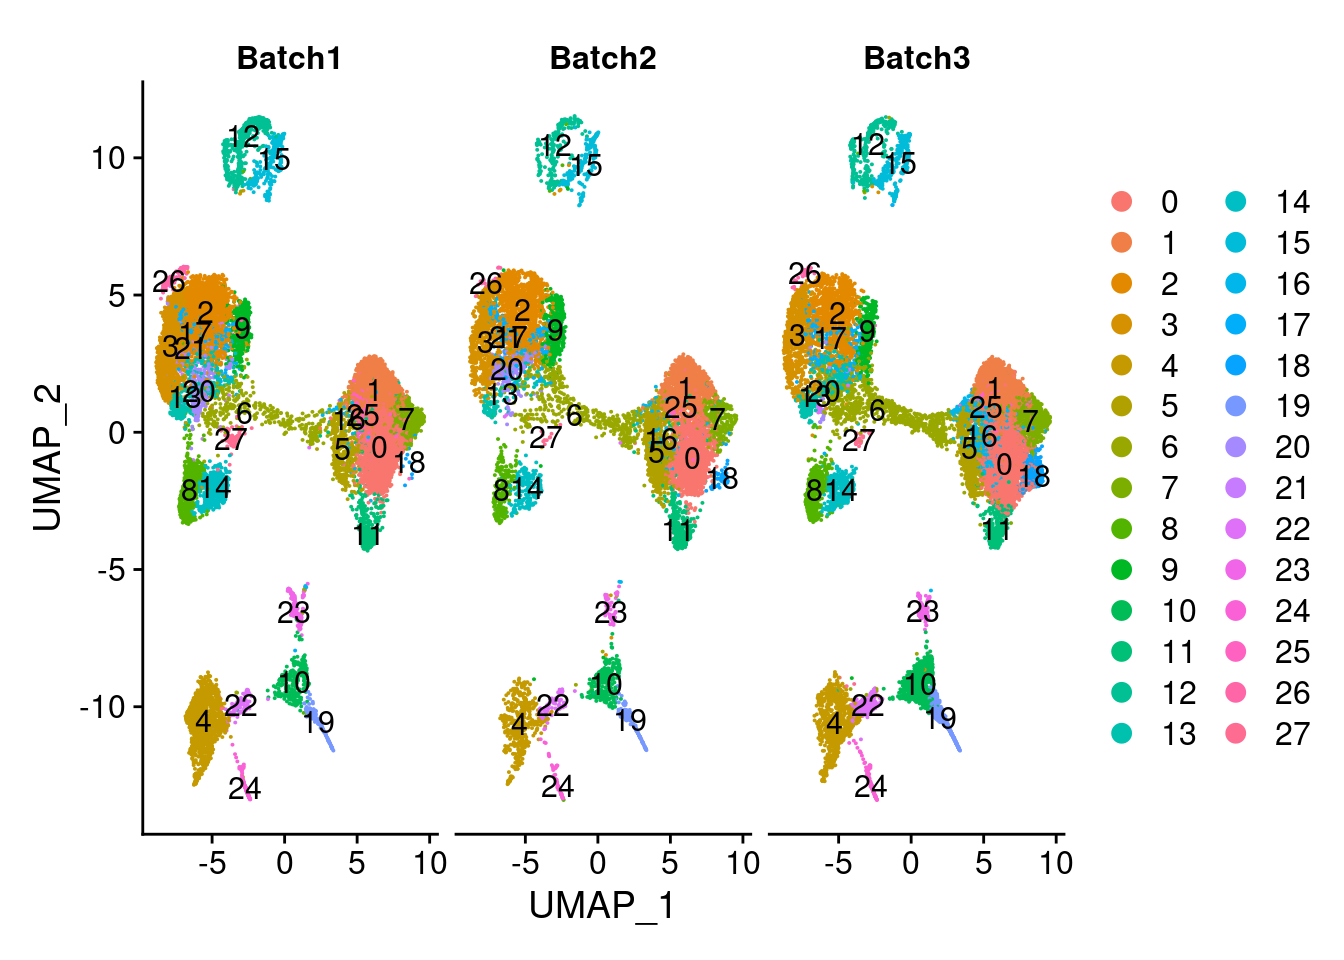
| Version | Author | Date |
|---|---|---|
| 421a225 | KLRhodes | 2020-08-10 |
DimPlot(merged, reduction = "harmony", group.by = "SCT_snn_res.1", split.by = "Batch", combine = F)[[1]]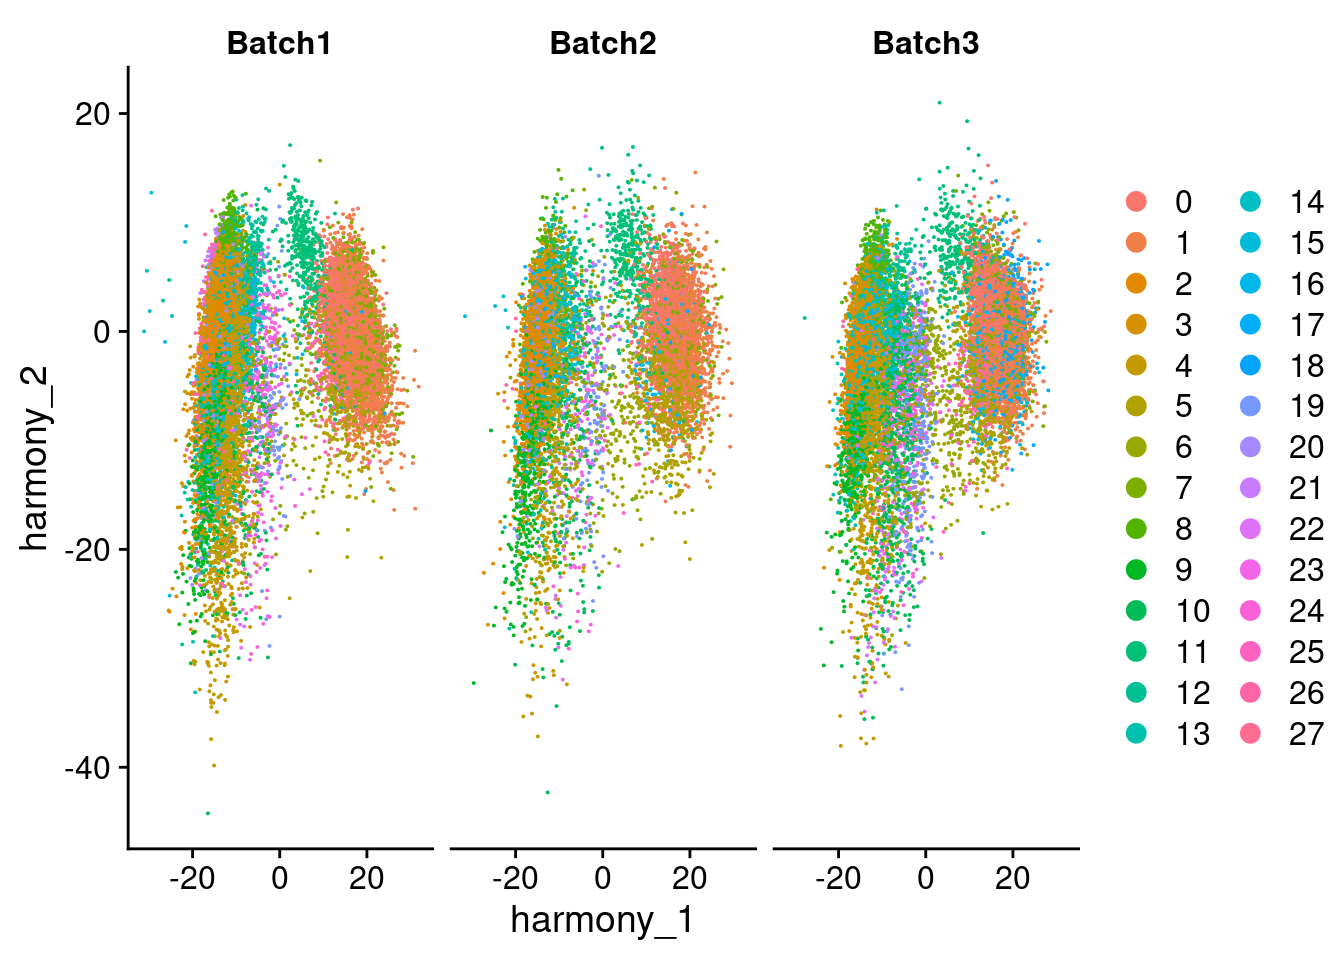
| Version | Author | Date |
|---|---|---|
| 421a225 | KLRhodes | 2020-08-10 |
VlnPlot(merged, features = c("POU5F1", "PAX6", "TNNT2", "SOX17", "HAND1", "LUM"), ncol=2)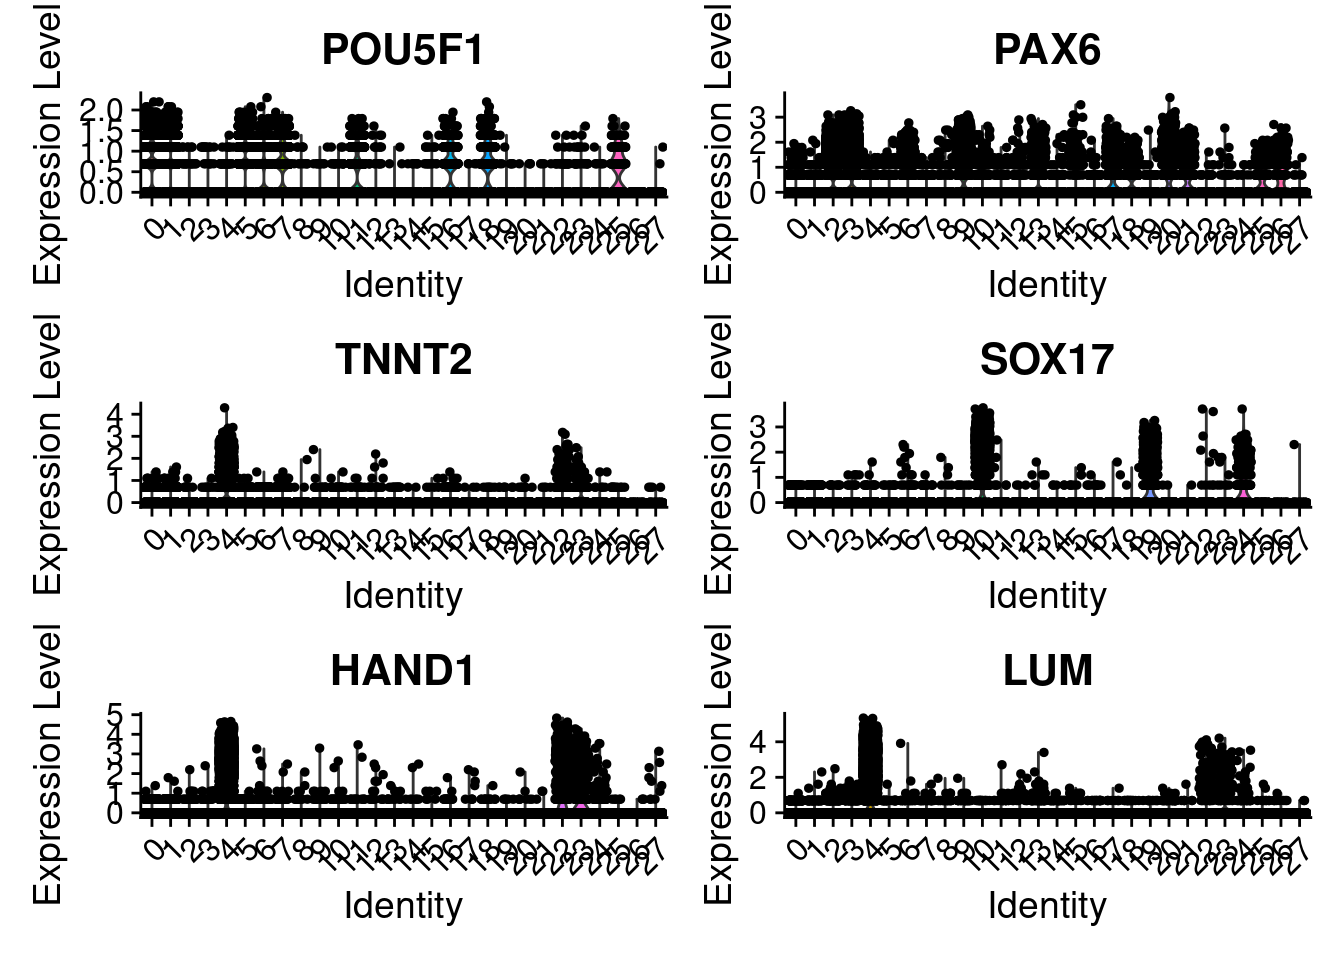
| Version | Author | Date |
|---|---|---|
| 421a225 | KLRhodes | 2020-08-10 |
#pluripotent markers
FeaturePlot(merged, features = c("POU5F1", "SOX2", "NANOG"), pt.size = 0.2, ncol=3)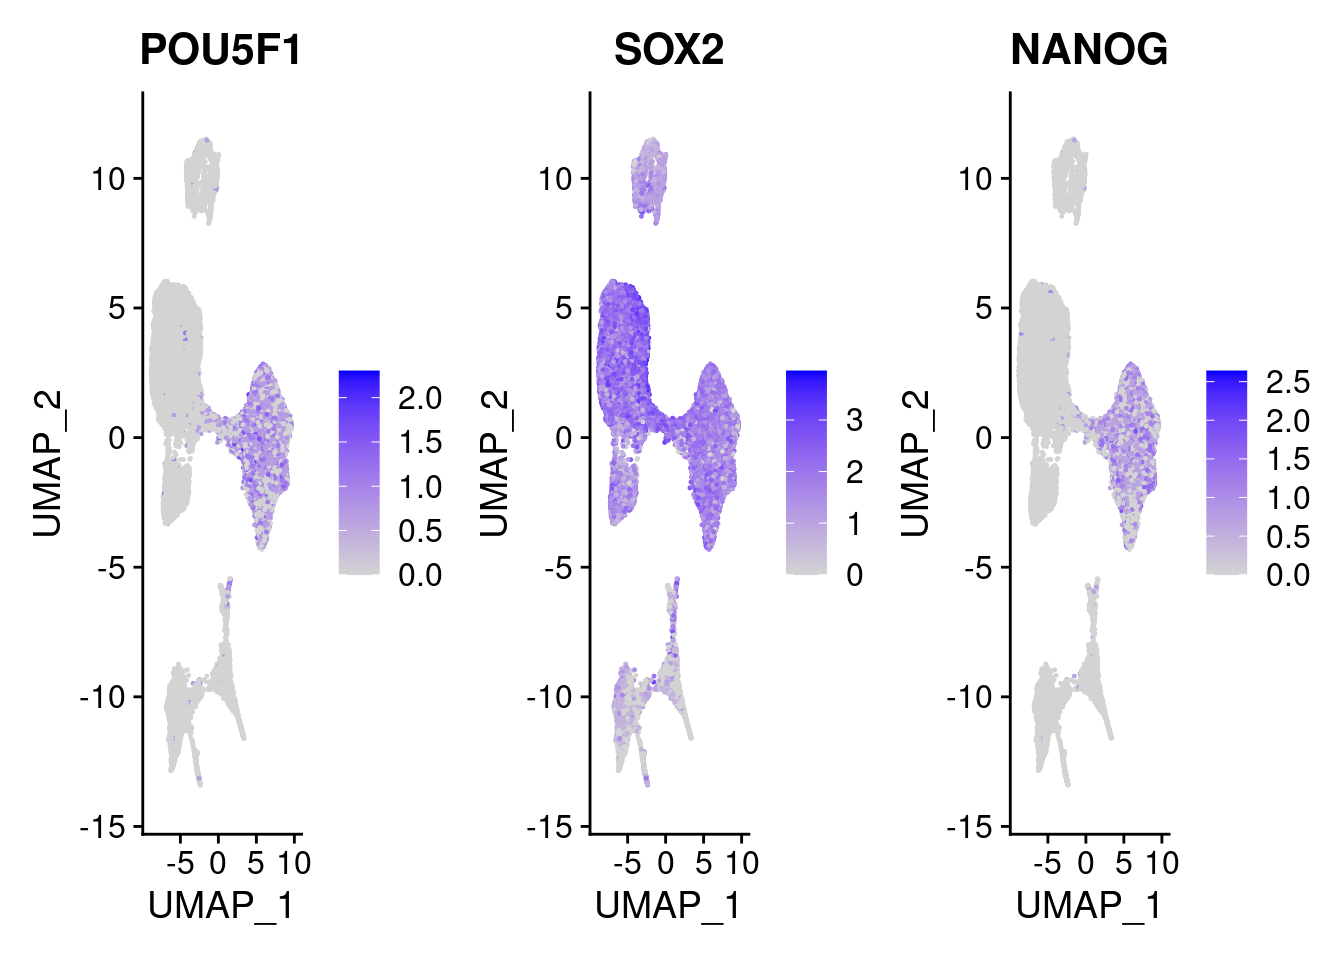
| Version | Author | Date |
|---|---|---|
| 421a225 | KLRhodes | 2020-08-10 |
#Endoderm markers (first 3 definitive endo, 4-6 liver markers, )
FeaturePlot(merged, features = c("SOX17","CLDN6","FOXA2", "TTR", "AFP", "FGB"), pt.size = 0.2, combine = F)
[[1]]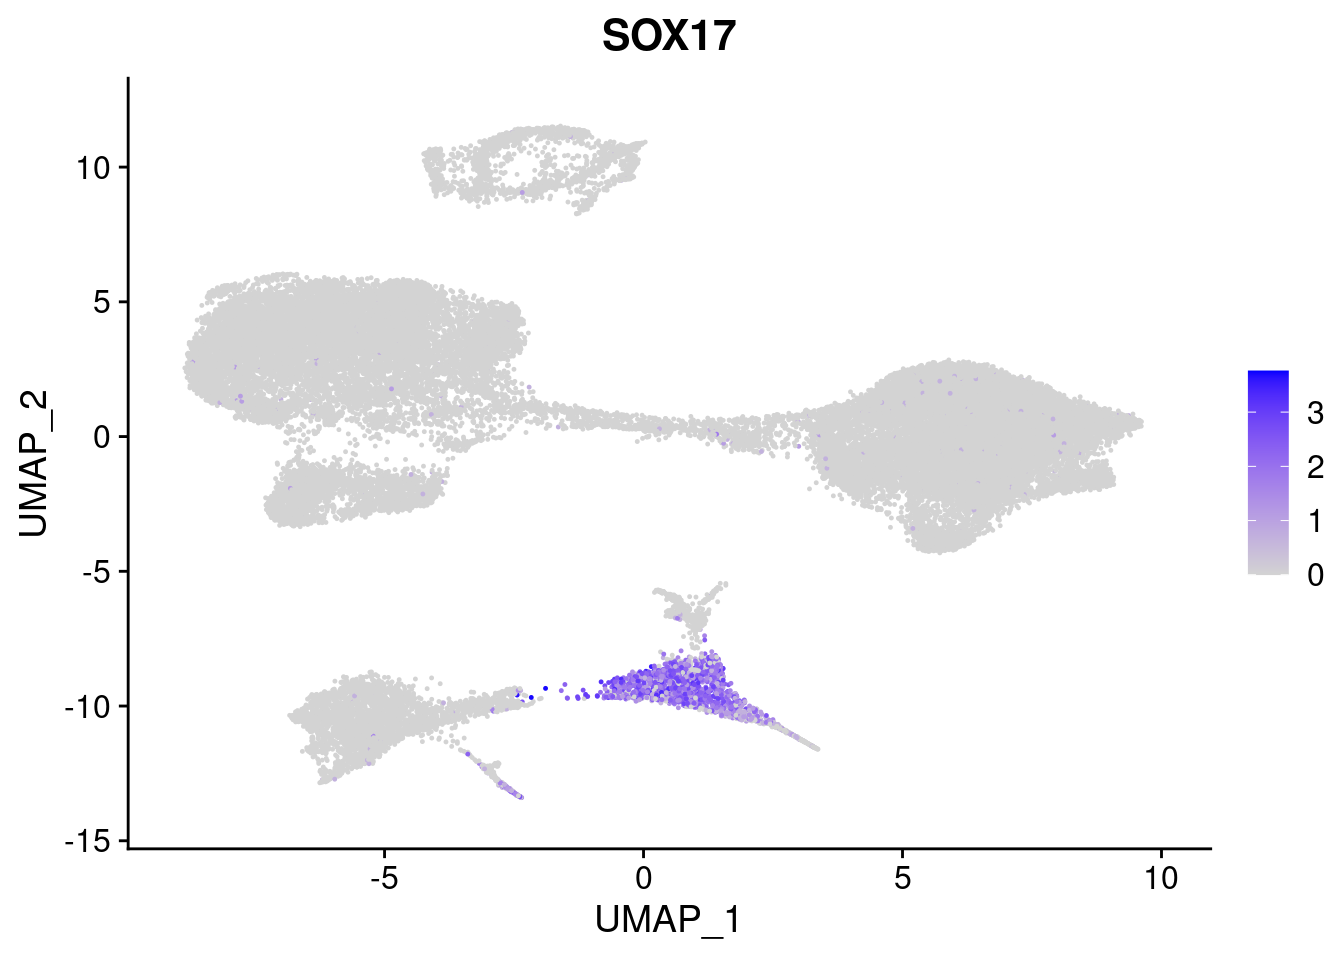
| Version | Author | Date |
|---|---|---|
| 421a225 | KLRhodes | 2020-08-10 |
[[2]]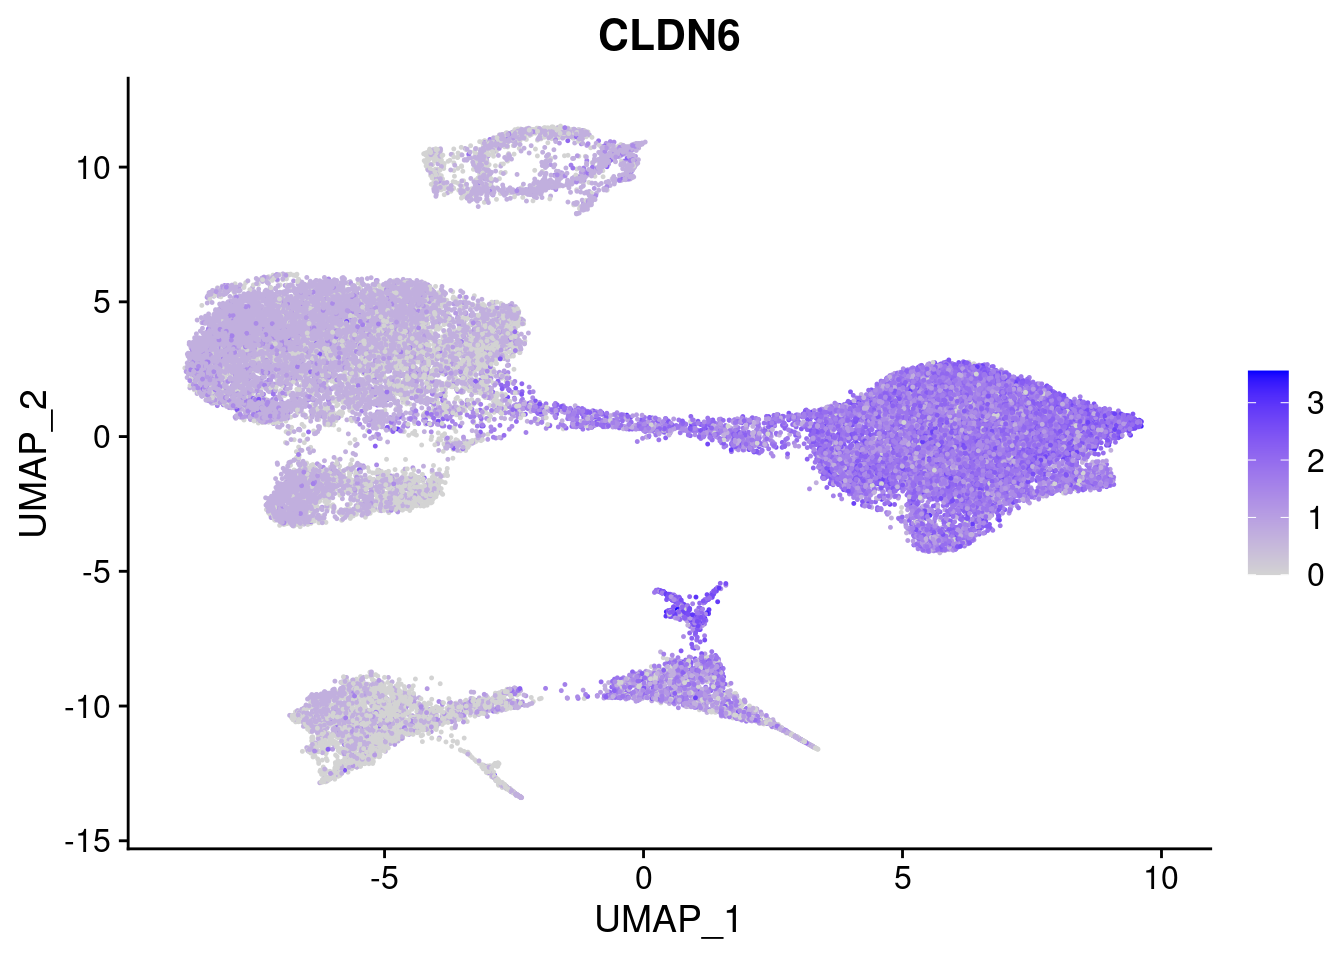
| Version | Author | Date |
|---|---|---|
| 421a225 | KLRhodes | 2020-08-10 |
[[3]]
| Version | Author | Date |
|---|---|---|
| 421a225 | KLRhodes | 2020-08-10 |
[[4]]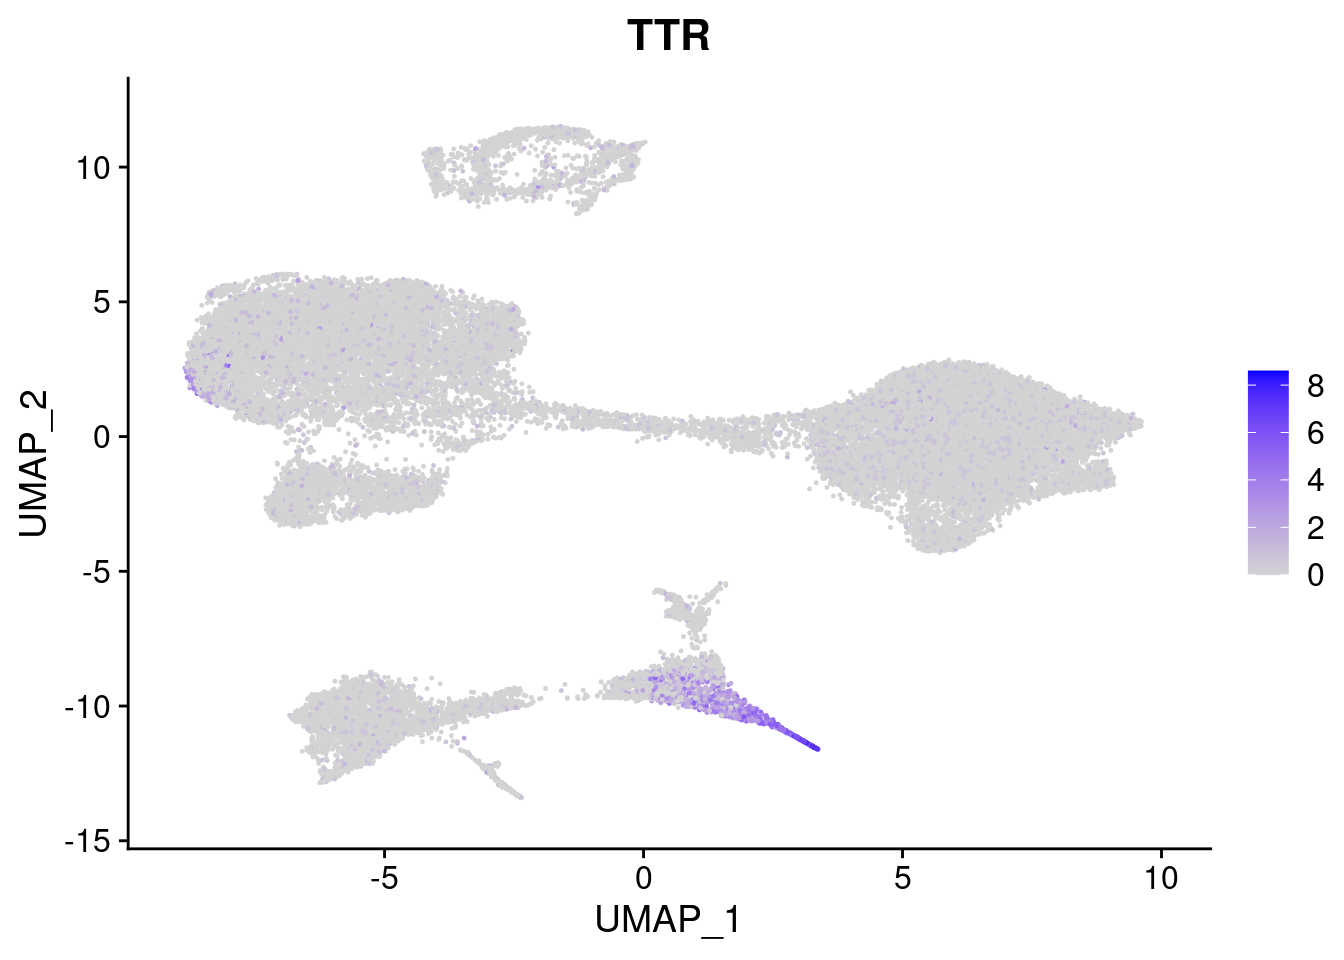
| Version | Author | Date |
|---|---|---|
| 421a225 | KLRhodes | 2020-08-10 |
[[5]]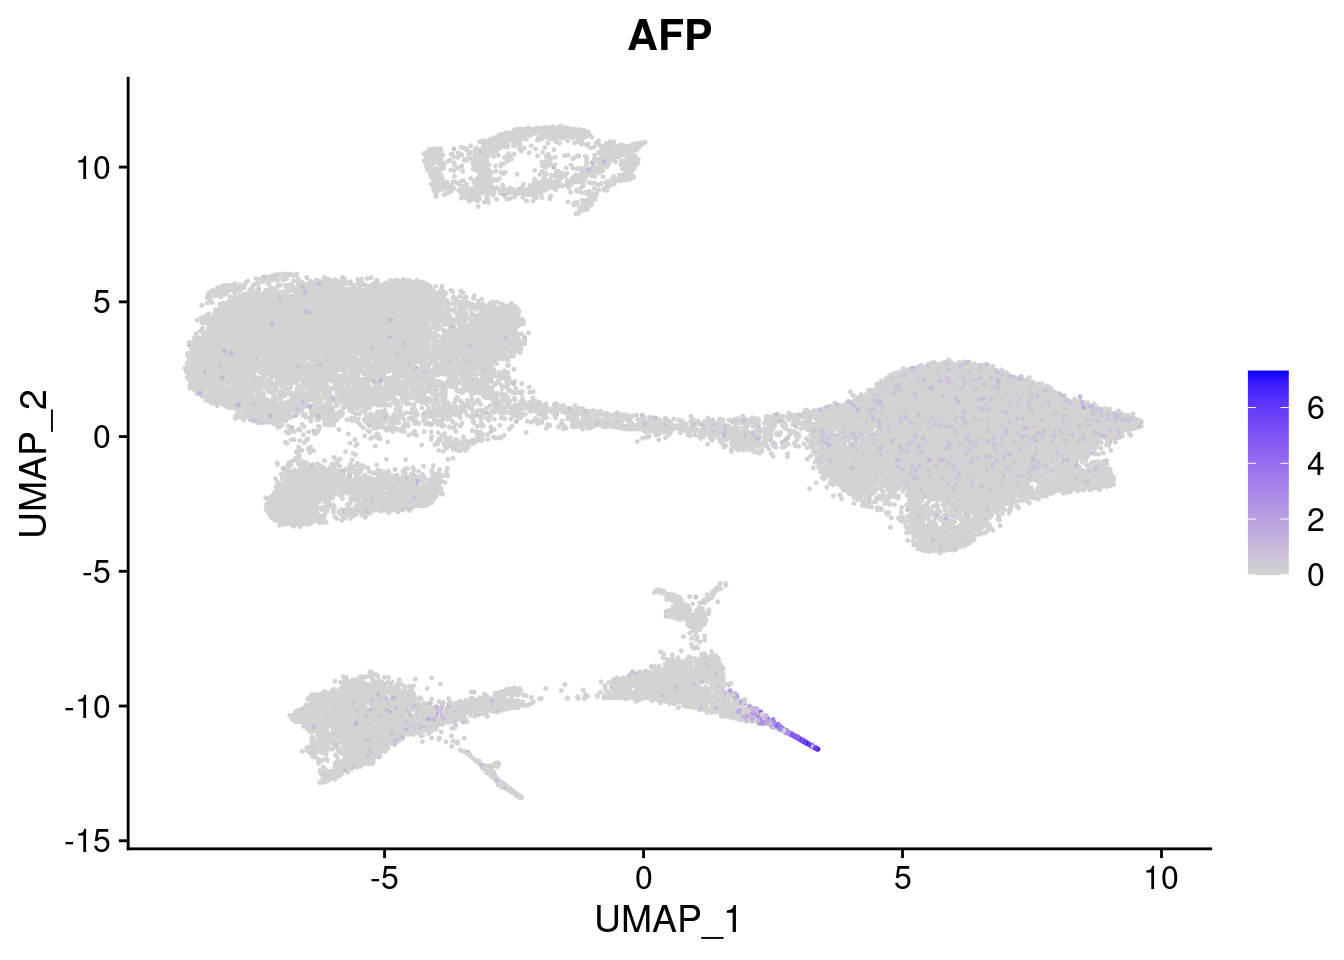
| Version | Author | Date |
|---|---|---|
| 421a225 | KLRhodes | 2020-08-10 |
[[6]]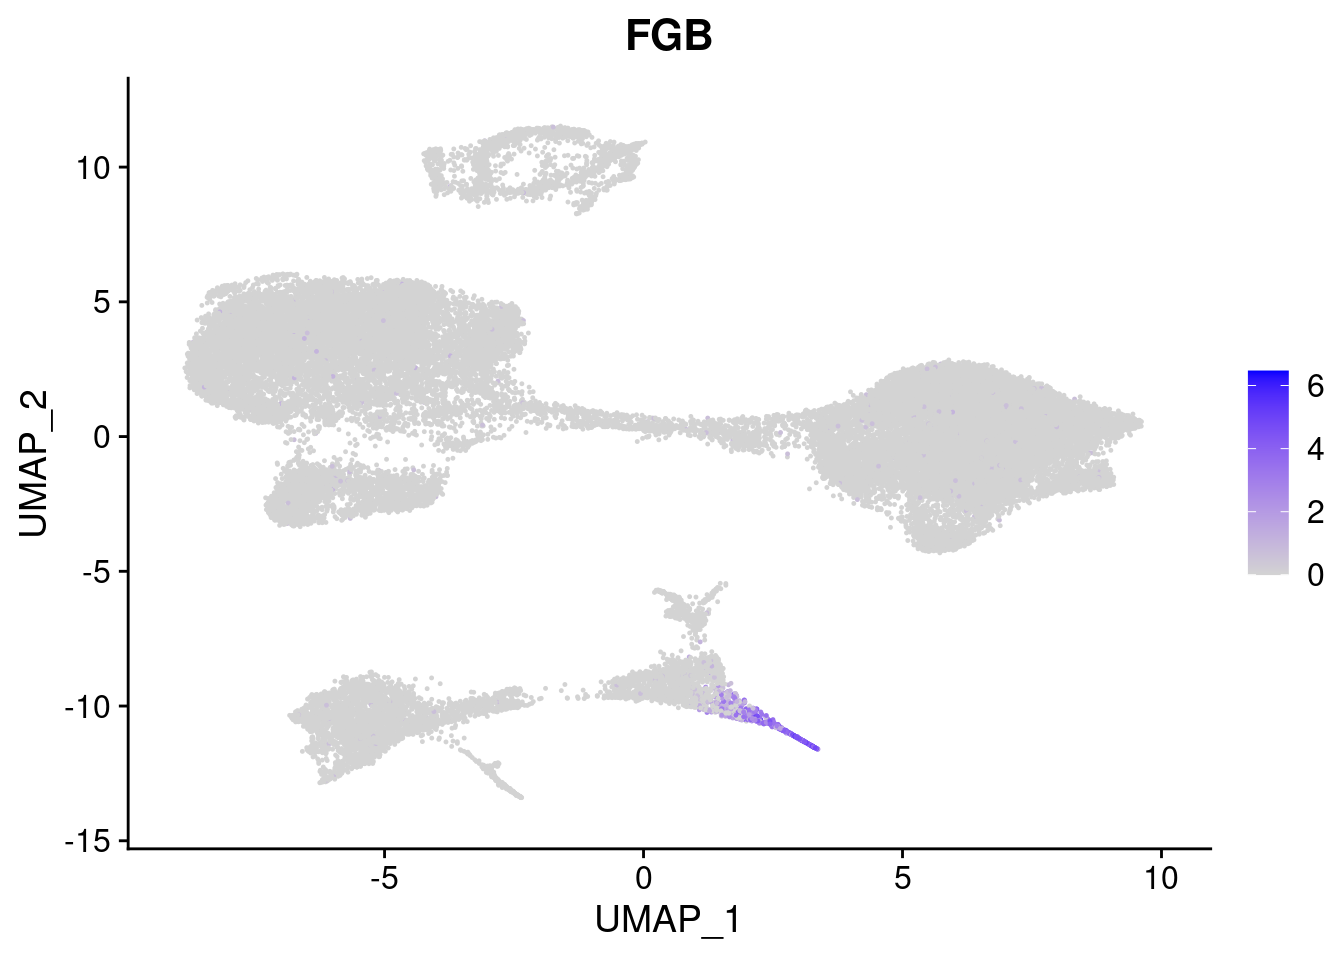
| Version | Author | Date |
|---|---|---|
| 421a225 | KLRhodes | 2020-08-10 |
#Mesoderm Markers (first 3 early meso markers, 4-6 heart markers, 7-9 endothelial markers (which comes from mesoderm), then some other general muscle markers)
FeaturePlot(merged, features = c("HAND1", "BMP4", "TNNT2","KDR", "GNG11", "ECSCR", "COL3A1", "ACTC1"), pt.size = 0.2, combine=F)
[[1]]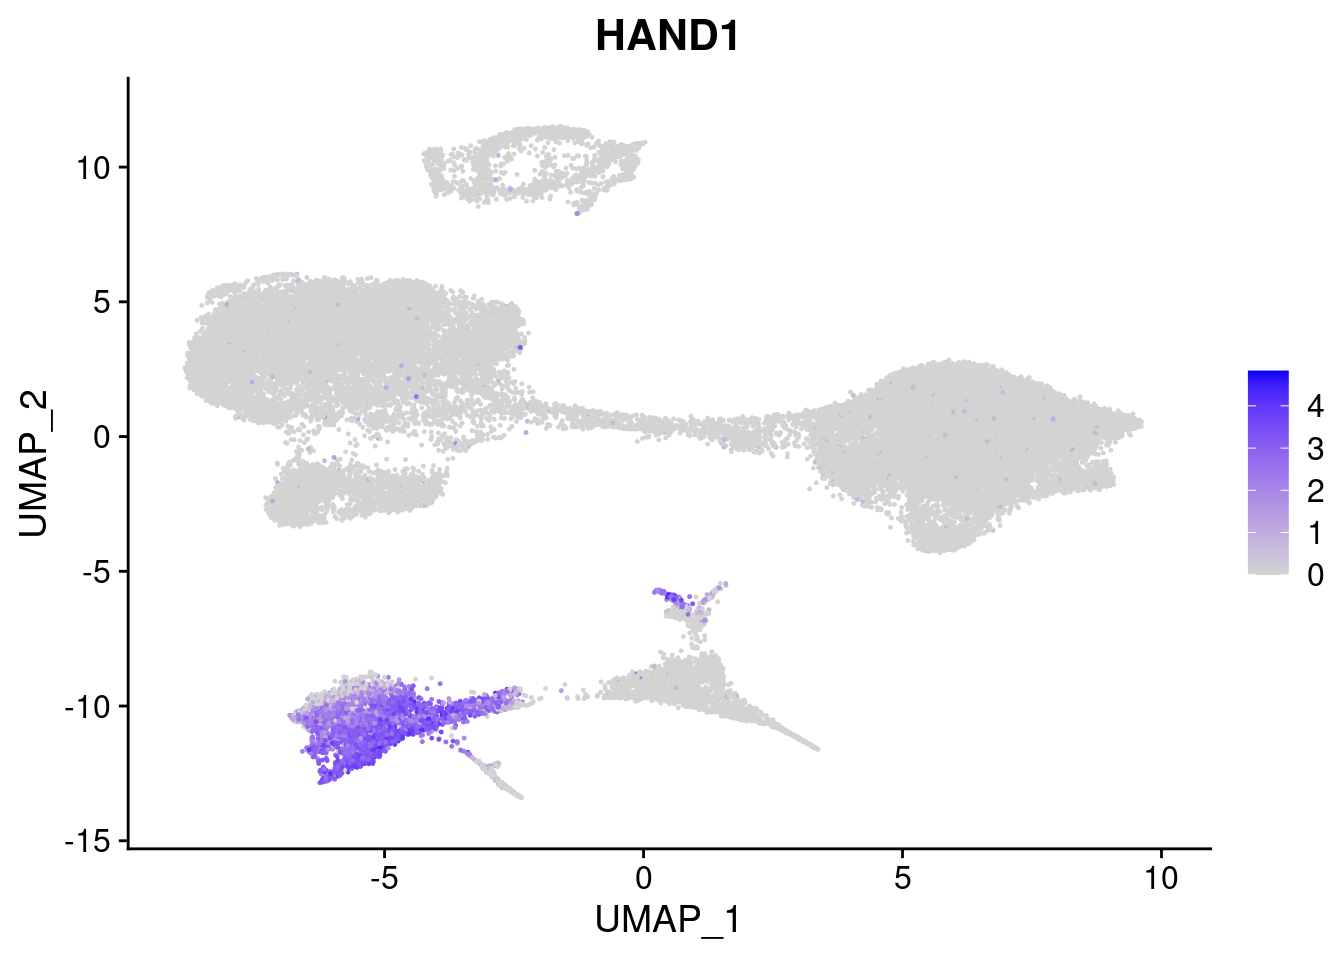
| Version | Author | Date |
|---|---|---|
| 421a225 | KLRhodes | 2020-08-10 |
[[2]]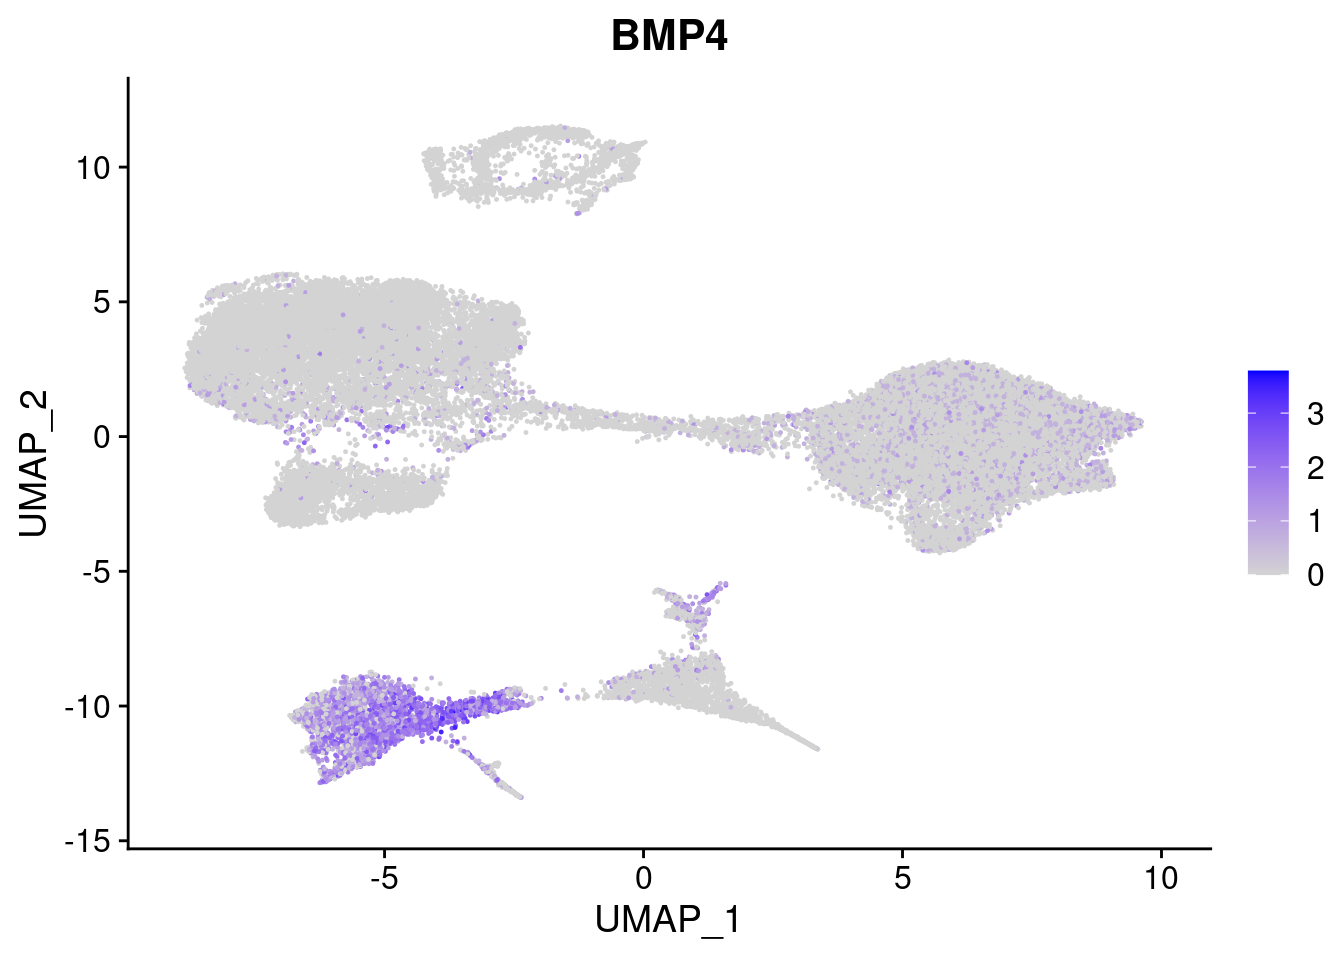
| Version | Author | Date |
|---|---|---|
| 421a225 | KLRhodes | 2020-08-10 |
[[3]]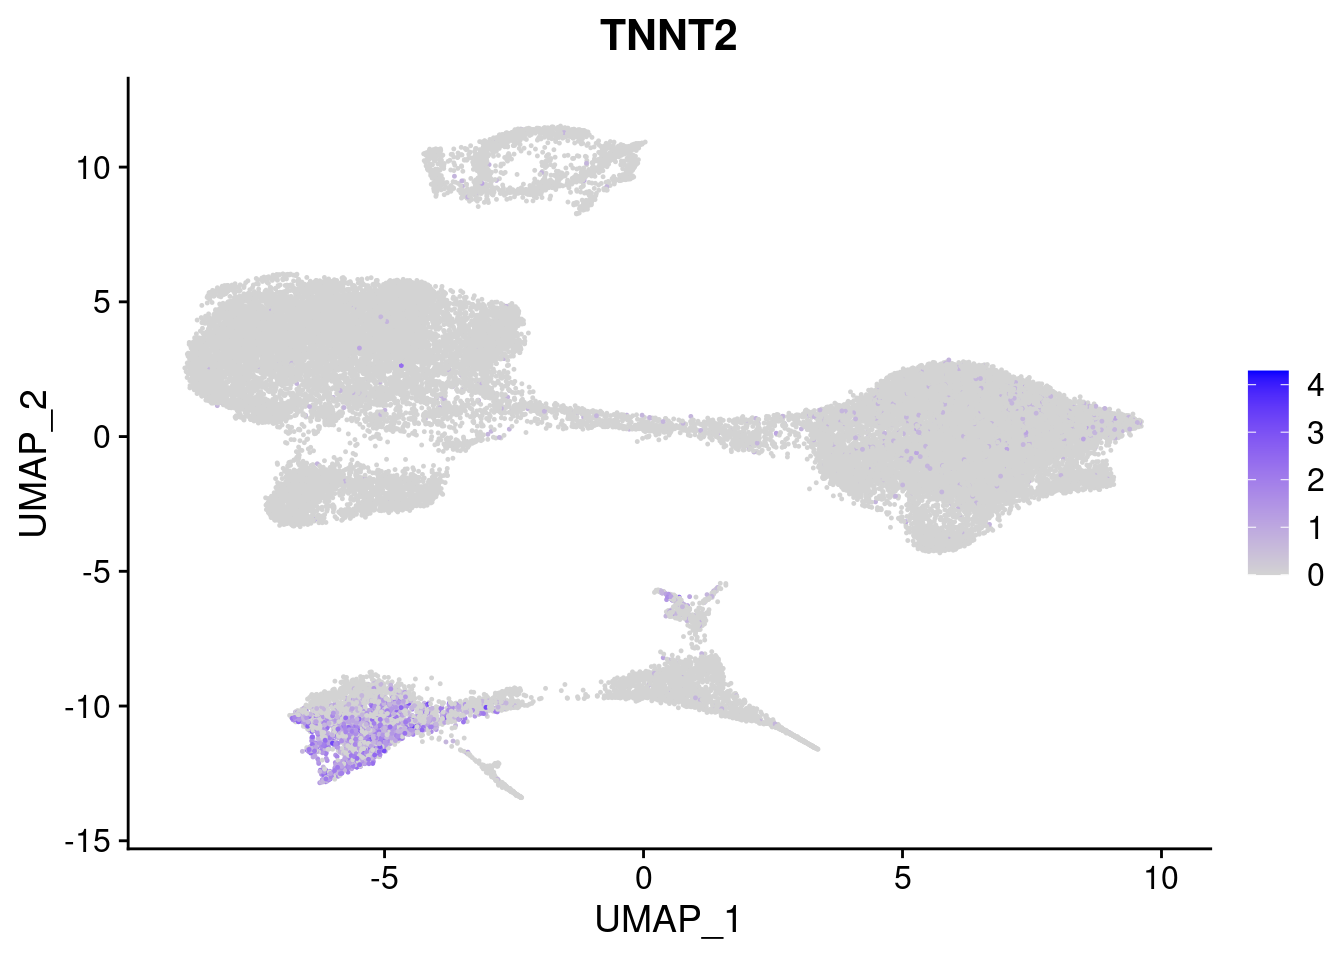
| Version | Author | Date |
|---|---|---|
| 421a225 | KLRhodes | 2020-08-10 |
[[4]]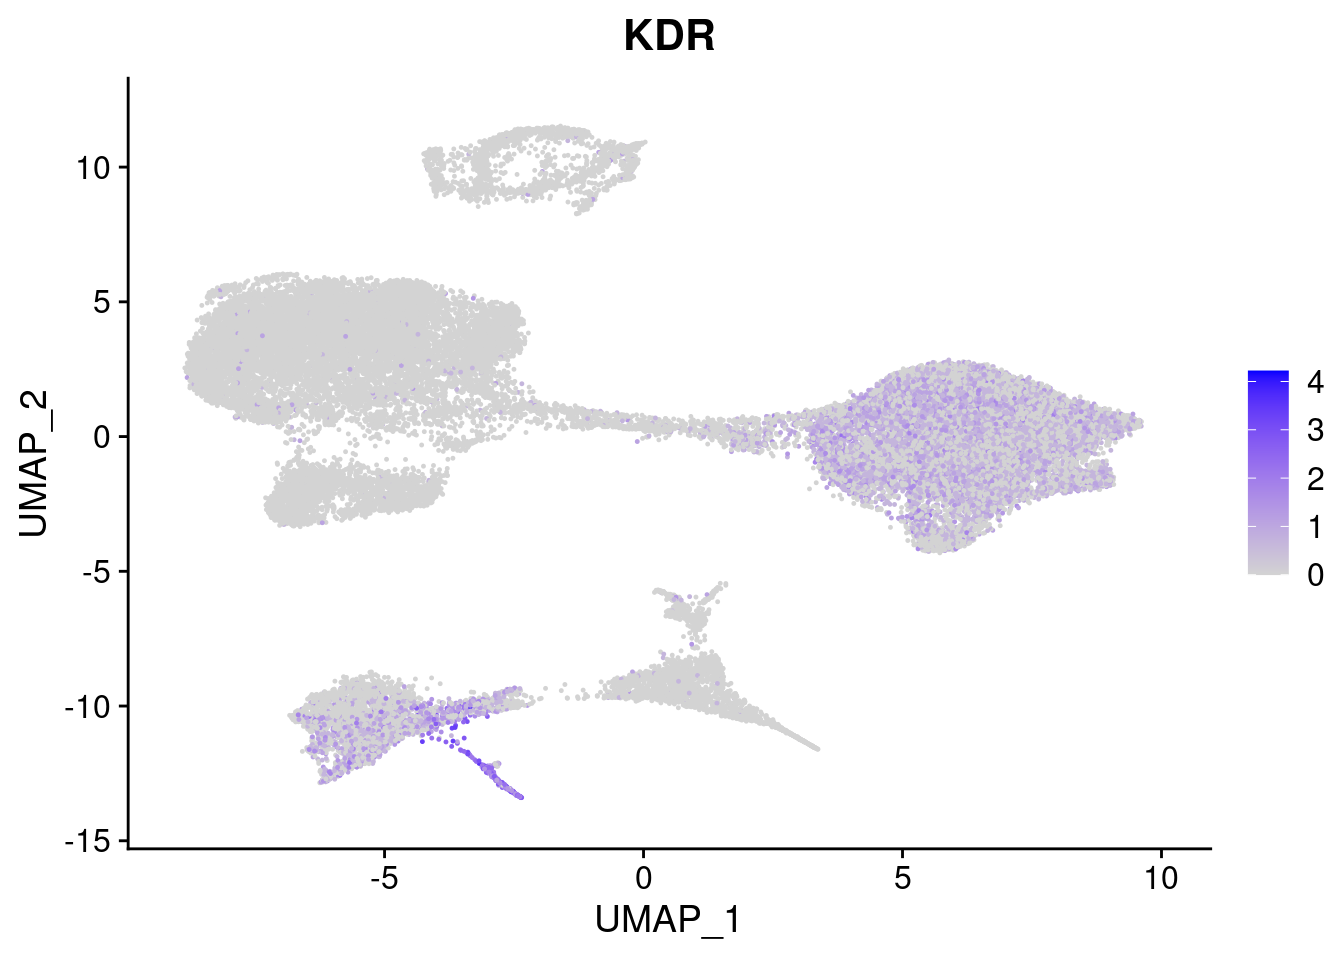
| Version | Author | Date |
|---|---|---|
| 421a225 | KLRhodes | 2020-08-10 |
[[5]]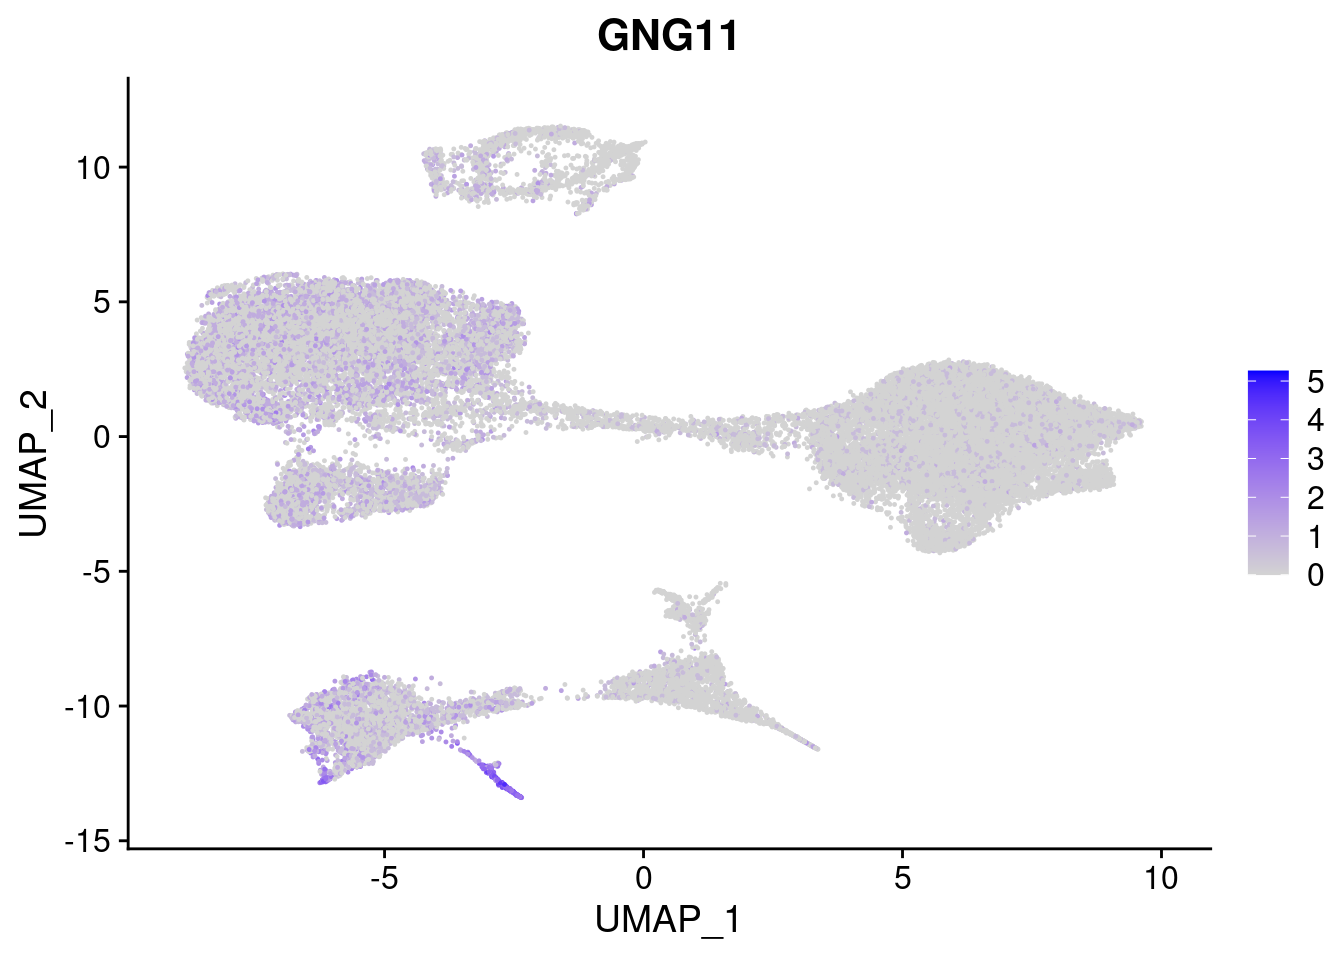
| Version | Author | Date |
|---|---|---|
| 421a225 | KLRhodes | 2020-08-10 |
[[6]]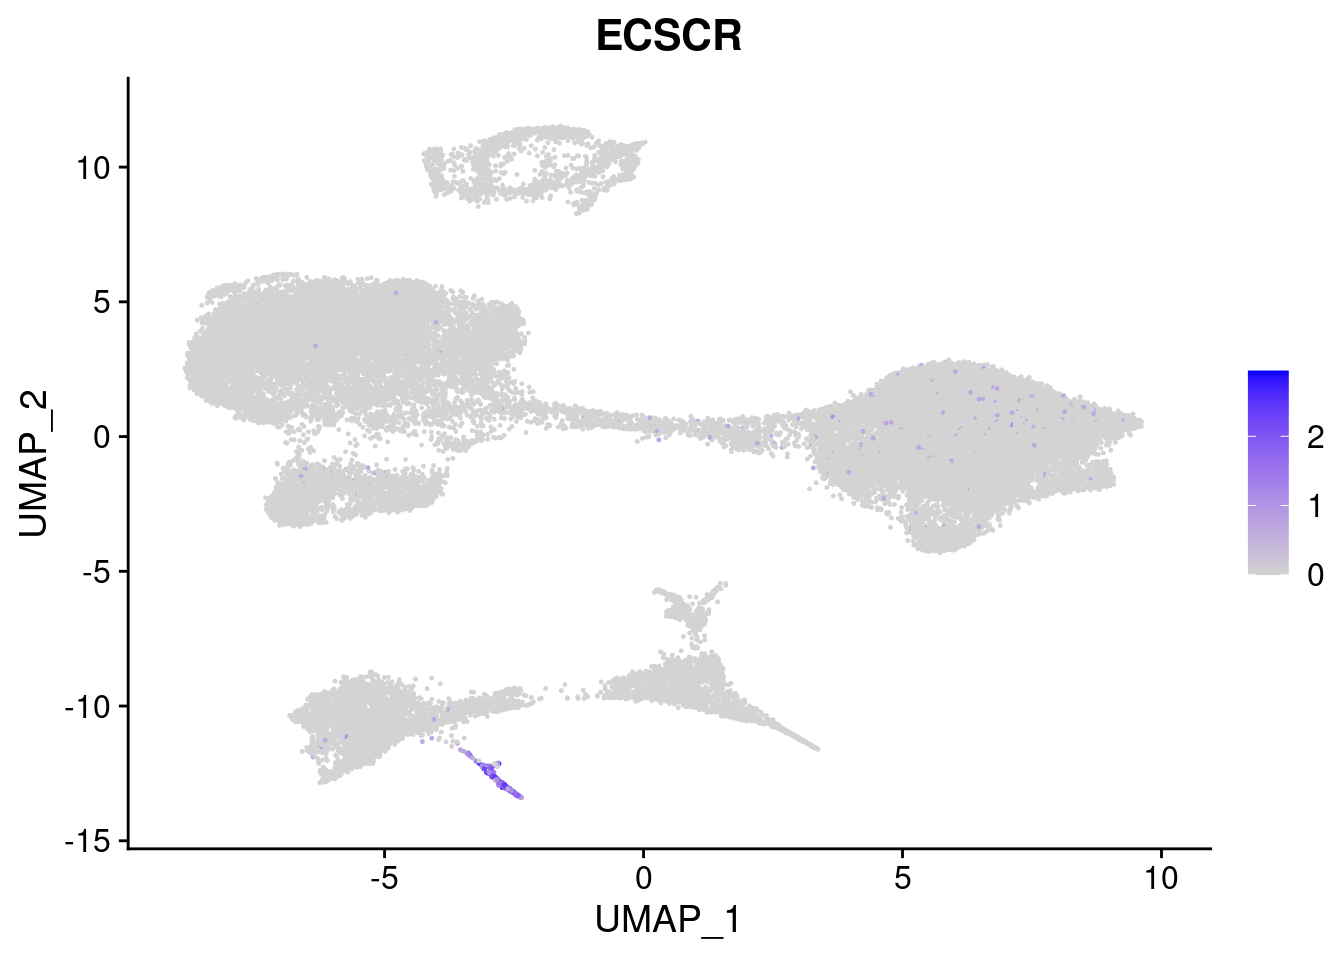
| Version | Author | Date |
|---|---|---|
| 421a225 | KLRhodes | 2020-08-10 |
[[7]]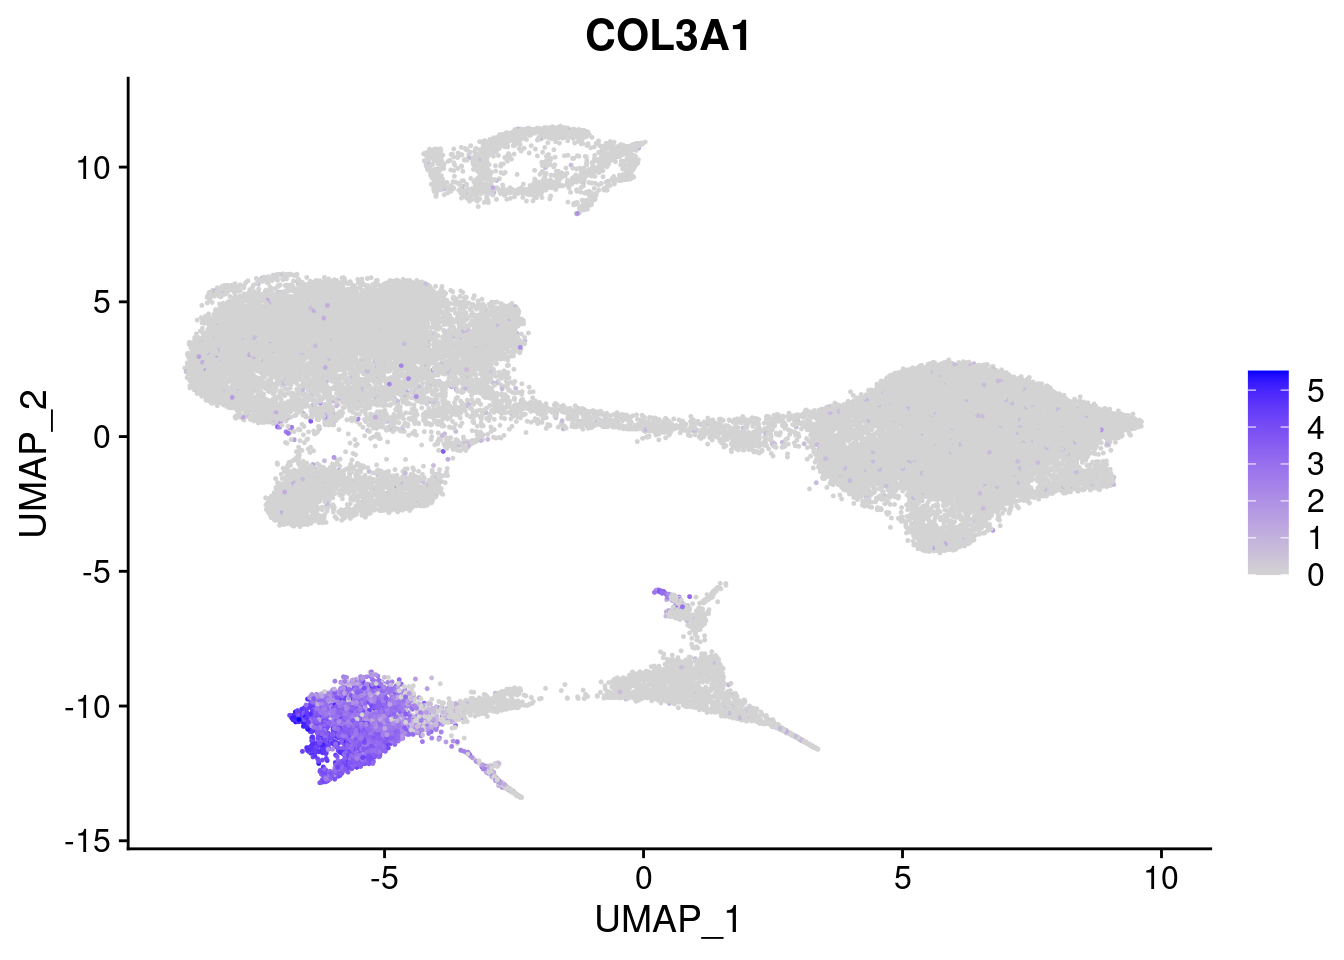
| Version | Author | Date |
|---|---|---|
| 421a225 | KLRhodes | 2020-08-10 |
[[8]]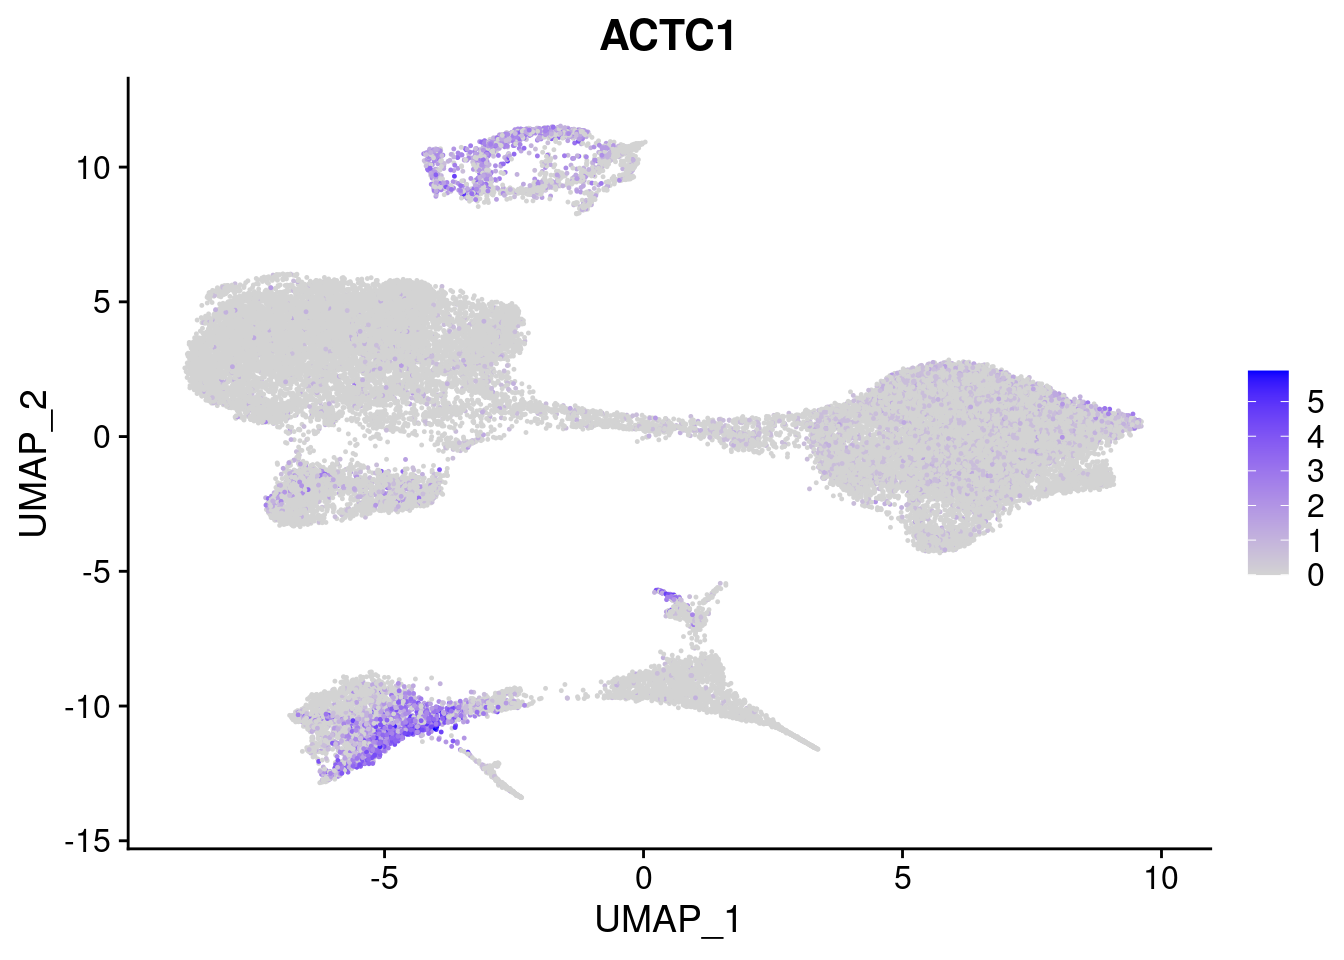
| Version | Author | Date |
|---|---|---|
| 421a225 | KLRhodes | 2020-08-10 |
#Ectoderm Markers (3-1 early ectoderm markers, 4-6schwann cell (myelinating, non myelinating, or precursor), 7-8 oligodendrocytes, 9-10 radial glia)
FeaturePlot(merged, features = c("PAX6", "GBX2",  "NES", "MPZ", "SOX10","GAP43", "OLIG1", "OLIG2", "VIM", "HES5"), pt.size = 0.2, ncol=3, combine=F)
[[1]]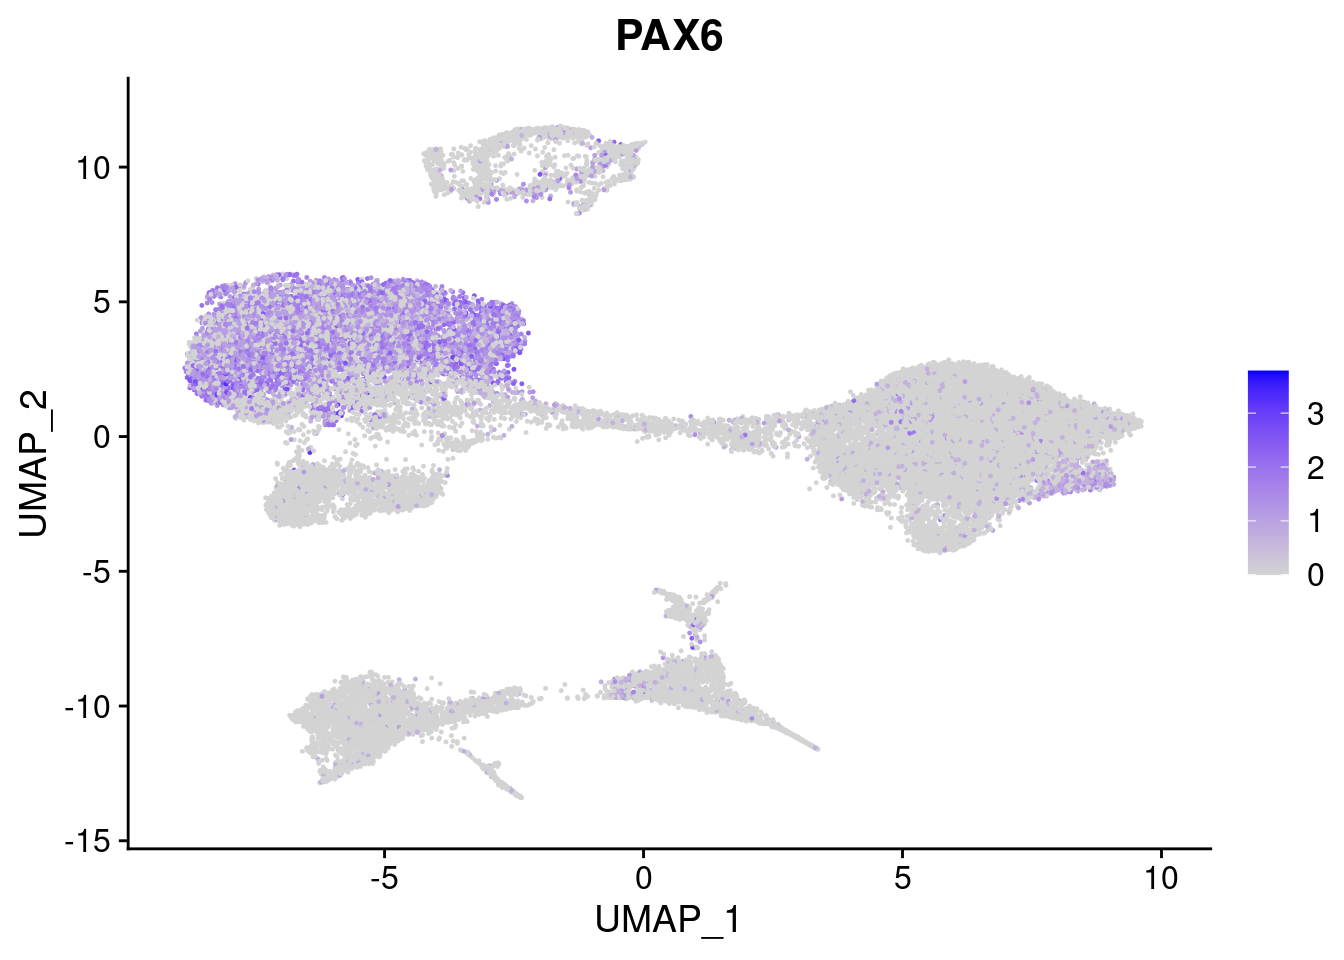
| Version | Author | Date |
|---|---|---|
| 421a225 | KLRhodes | 2020-08-10 |
[[2]]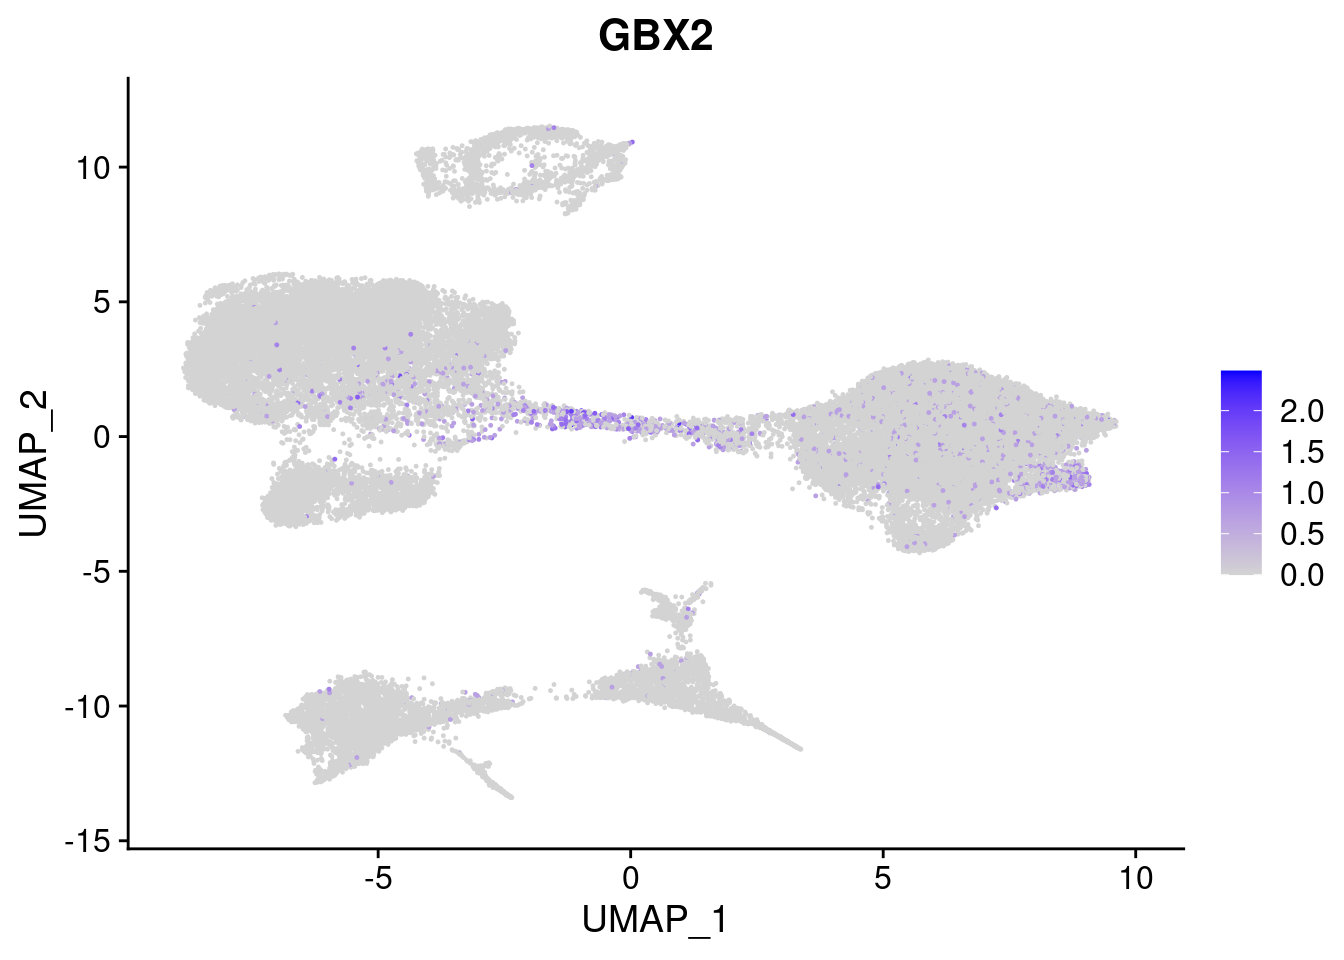
| Version | Author | Date |
|---|---|---|
| 421a225 | KLRhodes | 2020-08-10 |
[[3]]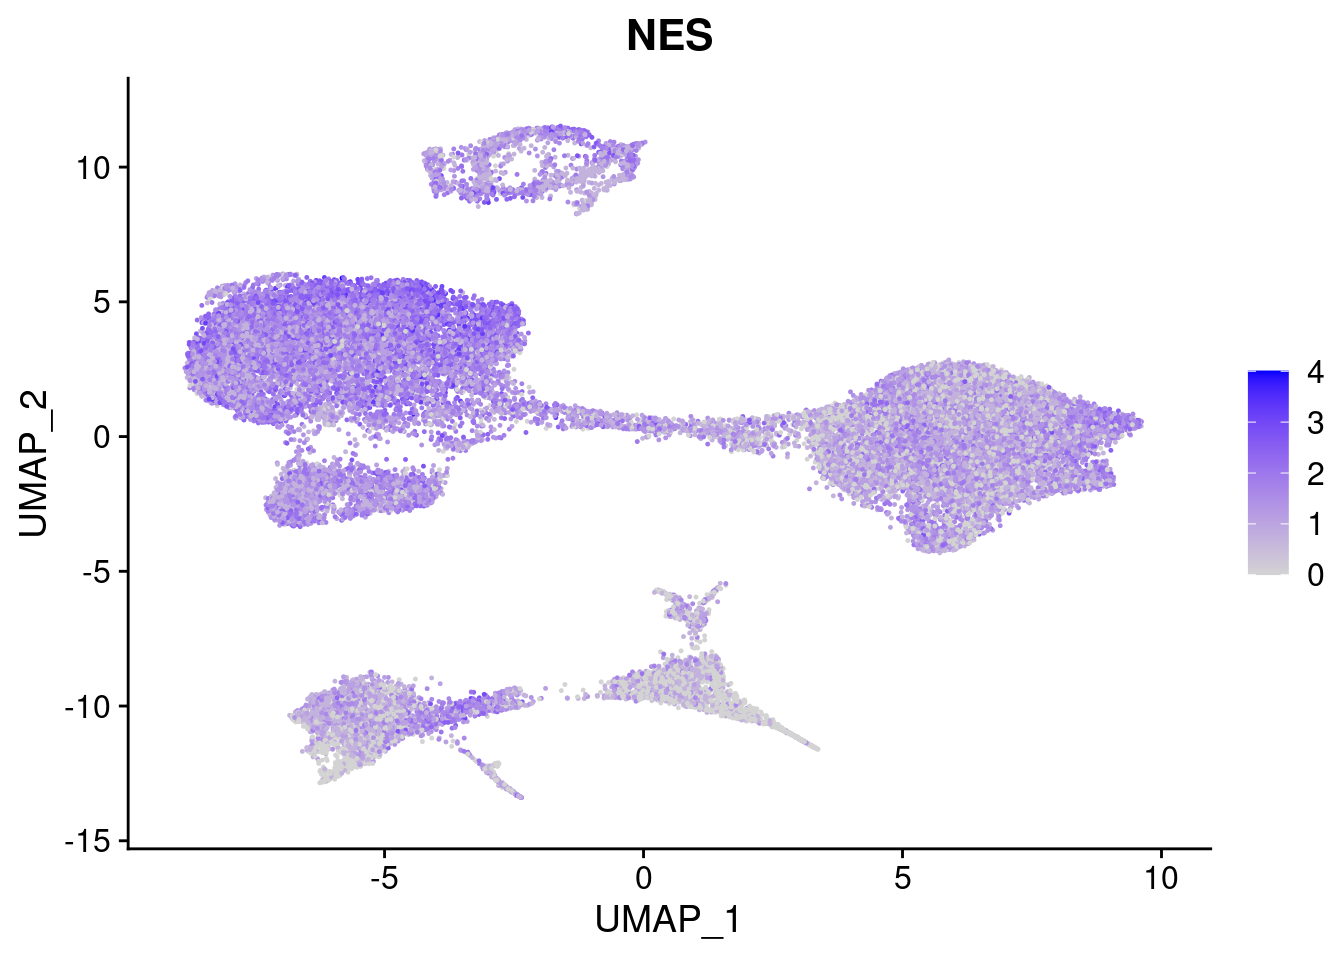
| Version | Author | Date |
|---|---|---|
| 421a225 | KLRhodes | 2020-08-10 |
[[4]]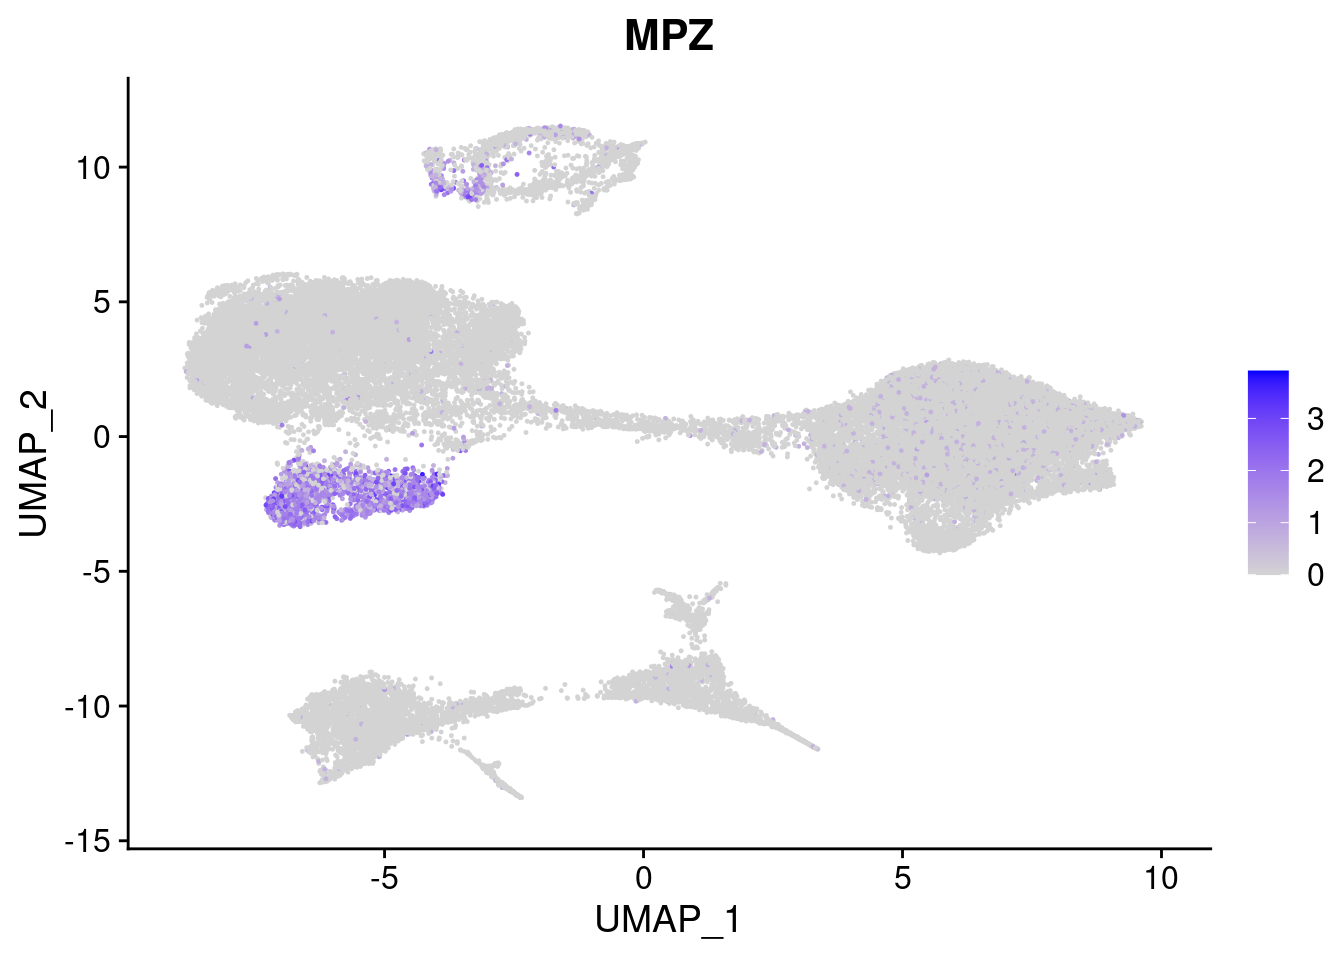
| Version | Author | Date |
|---|---|---|
| 421a225 | KLRhodes | 2020-08-10 |
[[5]]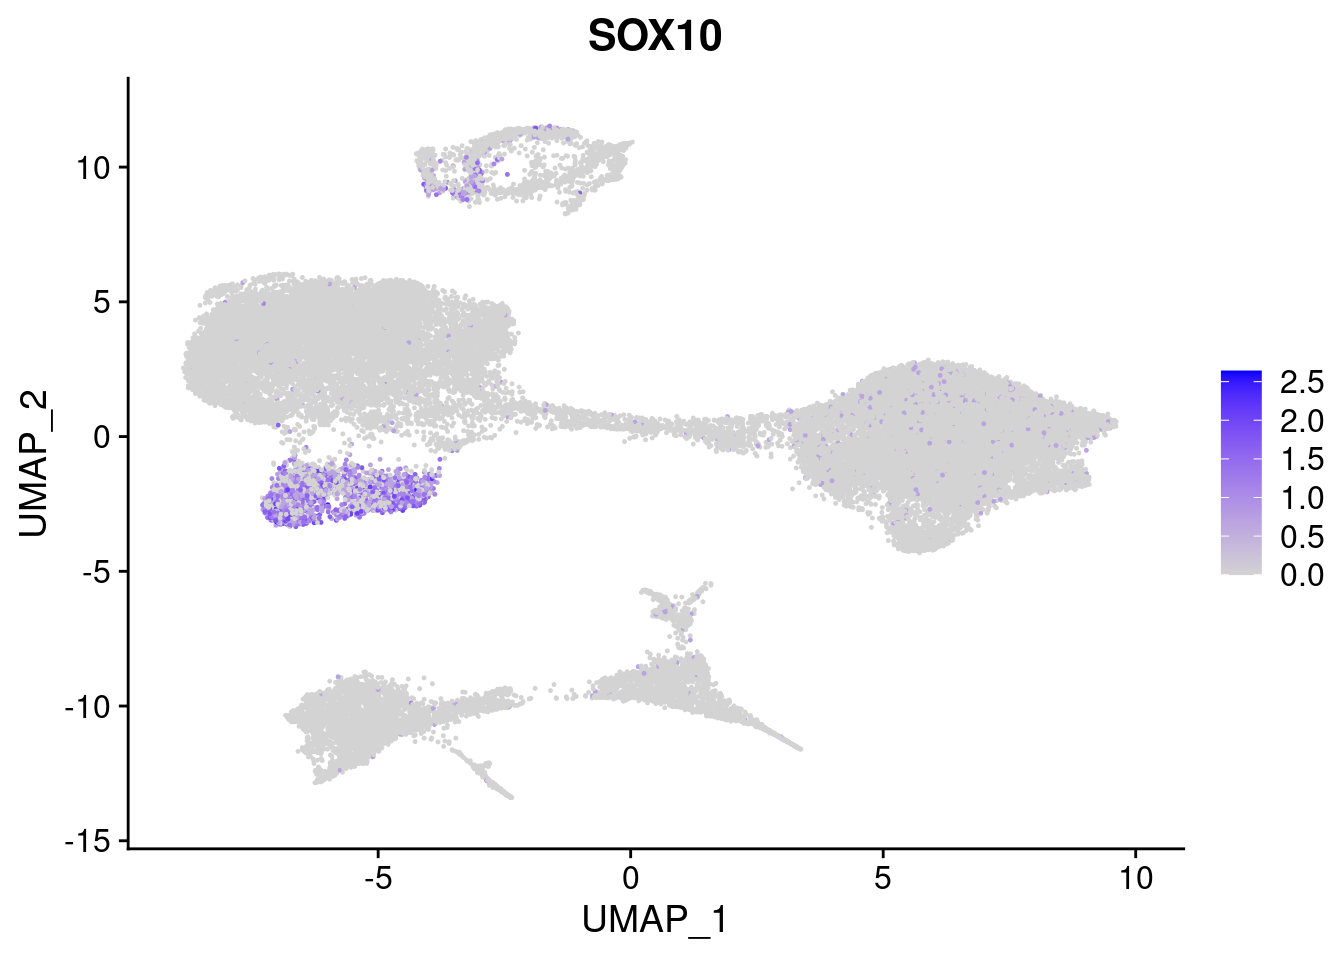
| Version | Author | Date |
|---|---|---|
| 421a225 | KLRhodes | 2020-08-10 |
[[6]]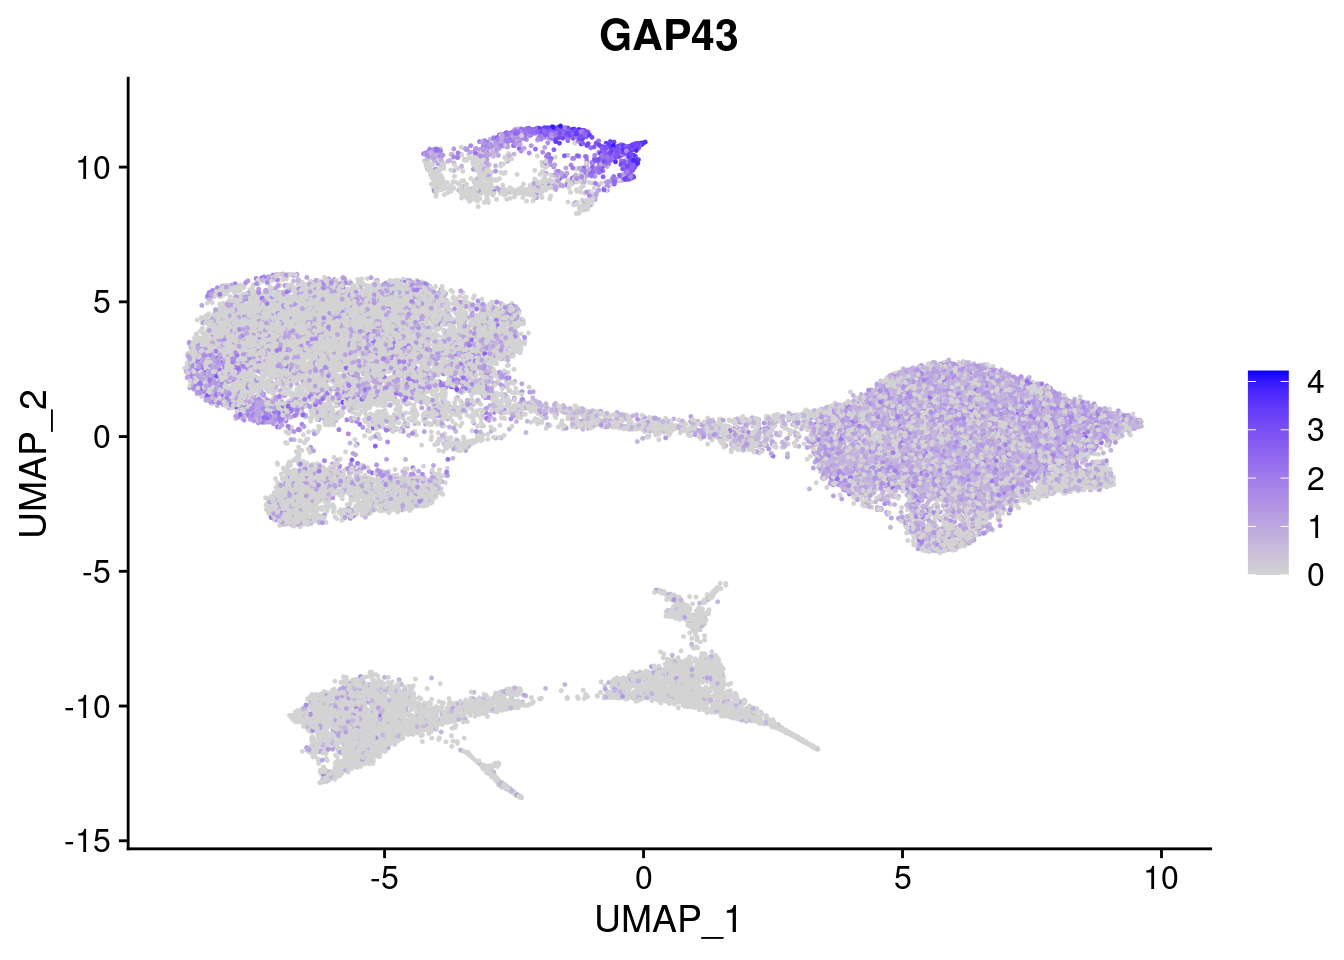
| Version | Author | Date |
|---|---|---|
| 421a225 | KLRhodes | 2020-08-10 |
[[7]]
| Version | Author | Date |
|---|---|---|
| 421a225 | KLRhodes | 2020-08-10 |
[[8]]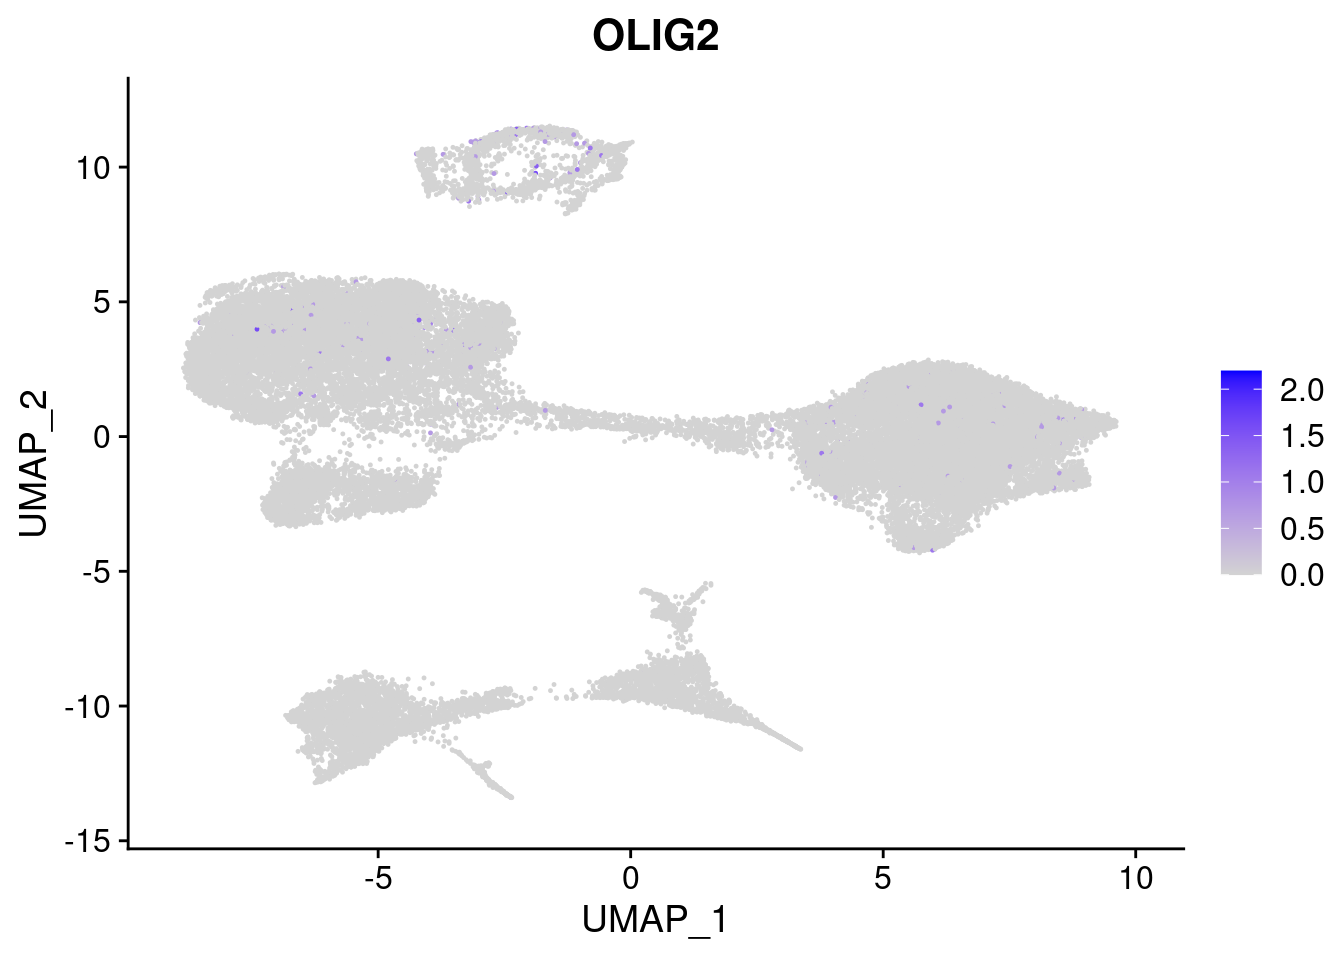
| Version | Author | Date |
|---|---|---|
| 421a225 | KLRhodes | 2020-08-10 |
[[9]]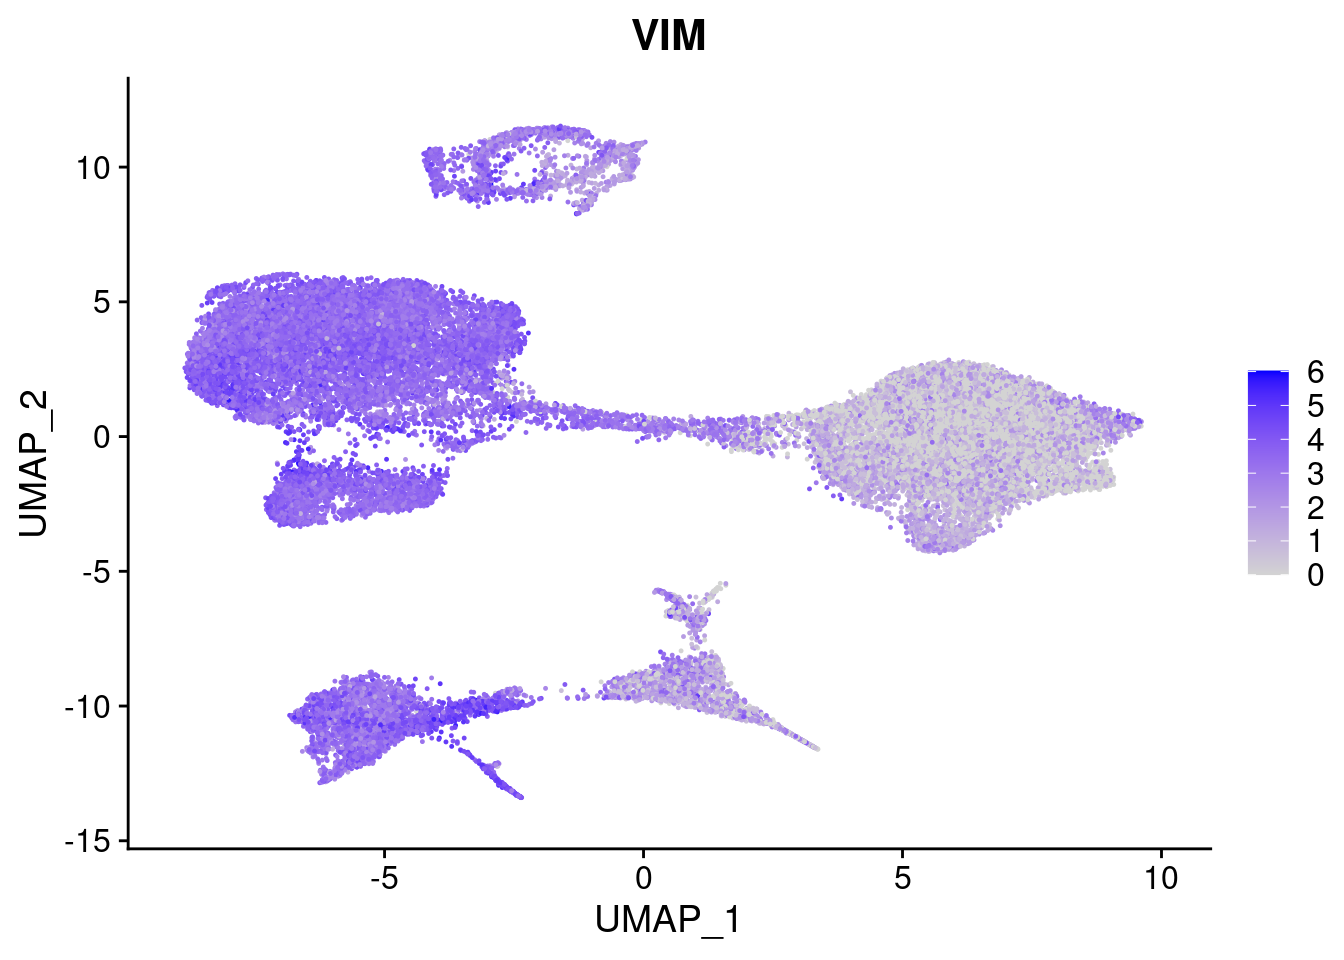
| Version | Author | Date |
|---|---|---|
| 421a225 | KLRhodes | 2020-08-10 |
[[10]]
| Version | Author | Date |
|---|---|---|
| 421a225 | KLRhodes | 2020-08-10 |
#More ectoderm, specifically neurons
#immature neurons: NEUROD1
#Mature Neurons: MAP2, SYP
#dopaminergic: TH, FOXA2,
FeaturePlot(merged, features = c("MAP2", "SYP","NEUROD1", "TH" ), pt.size = 0.2, ncol=3)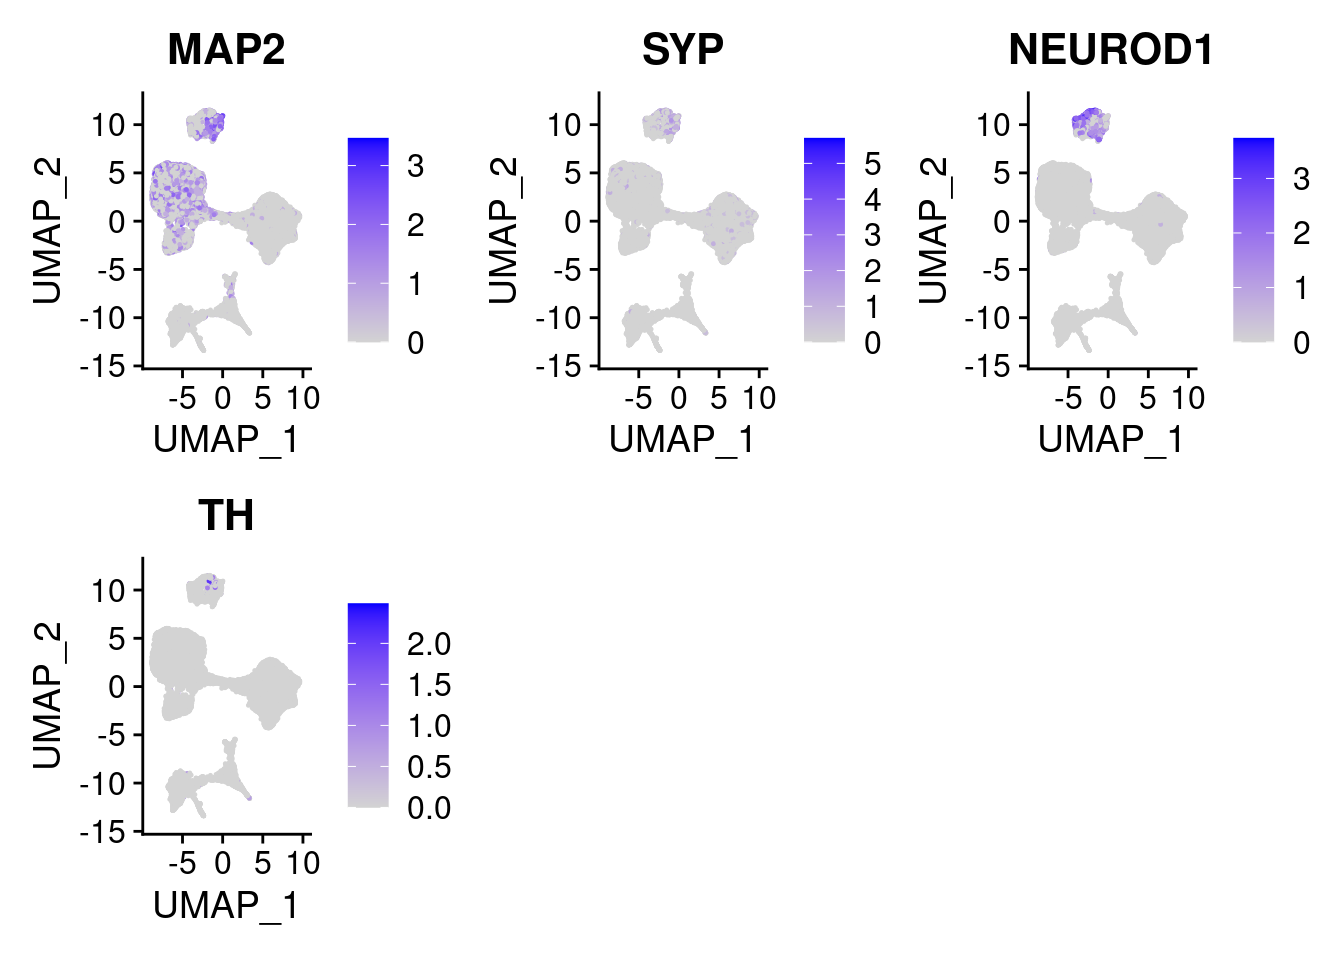
| Version | Author | Date |
|---|---|---|
| 421a225 | KLRhodes | 2020-08-10 |
Identify cluster markers
#how many cells per cluster?
t1<-table(merged@meta.data$SCT_snn_res.1, merged@meta.data$Batch)
t1
     Batch1 Batch2 Batch3
  0    2377   1416   2350
  1    2128   1191   1821
  2    2014   1306   1157
  3    1708    721    878
  4    1361    435    871
  5     406    855    741
  6     412    512   1075
  7     687    258    647
  8     778    221    526
  9     550    490    442
  10    249    273    859
  11    445    410    309
  12    615    207    329
  13    416    141    540
  14    443    190    404
  15    332    203    320
  16     36     92    592
  17    256    245    207
  18     11     55    633
  19    105    120    369
  20    289    255     43
  21    568      3      0
  22     82     75    252
  23    238     64     94
  24    103     60    134
  25     83     38     99
  26    101     19     29
  27     80     10     29
#how many cells per cluster from each individual?
t2<-table(merged@meta.data$SCT_snn_res.1, merged@meta.data$individual)
t2
     SNG-NA18511 SNG-NA18858 SNG-NA19160
  0          363        5633         147
  1          199        4859          82
  2         3005         237        1235
  3         1575         154        1578
  4          831          31        1805
  5          113        1741         148
  6          871         289         839
  7           84        1466          42
  8          155          34        1336
  9          971         103         408
  10         524          38         819
  11         106         965          93
  12         139          19         993
  13          89          11         997
  14         135           7         895
  15         581          37         237
  16         411          16         293
  17         416          56         236
  18         450           5         244
  19         155          15         424
  20         133         435          19
  21         328          33         210
  22         108           6         295
  23          83         135         178
  24          90           3         204
  25          18         193           9
  26           0         149           0
  27          16           0         103
Reclustering with less resolution, check if everything is robust
#reassign idents
Idents(merged)<- 'SCT_snn_res.0.5'
DimPlot(merged, reduction = "umap")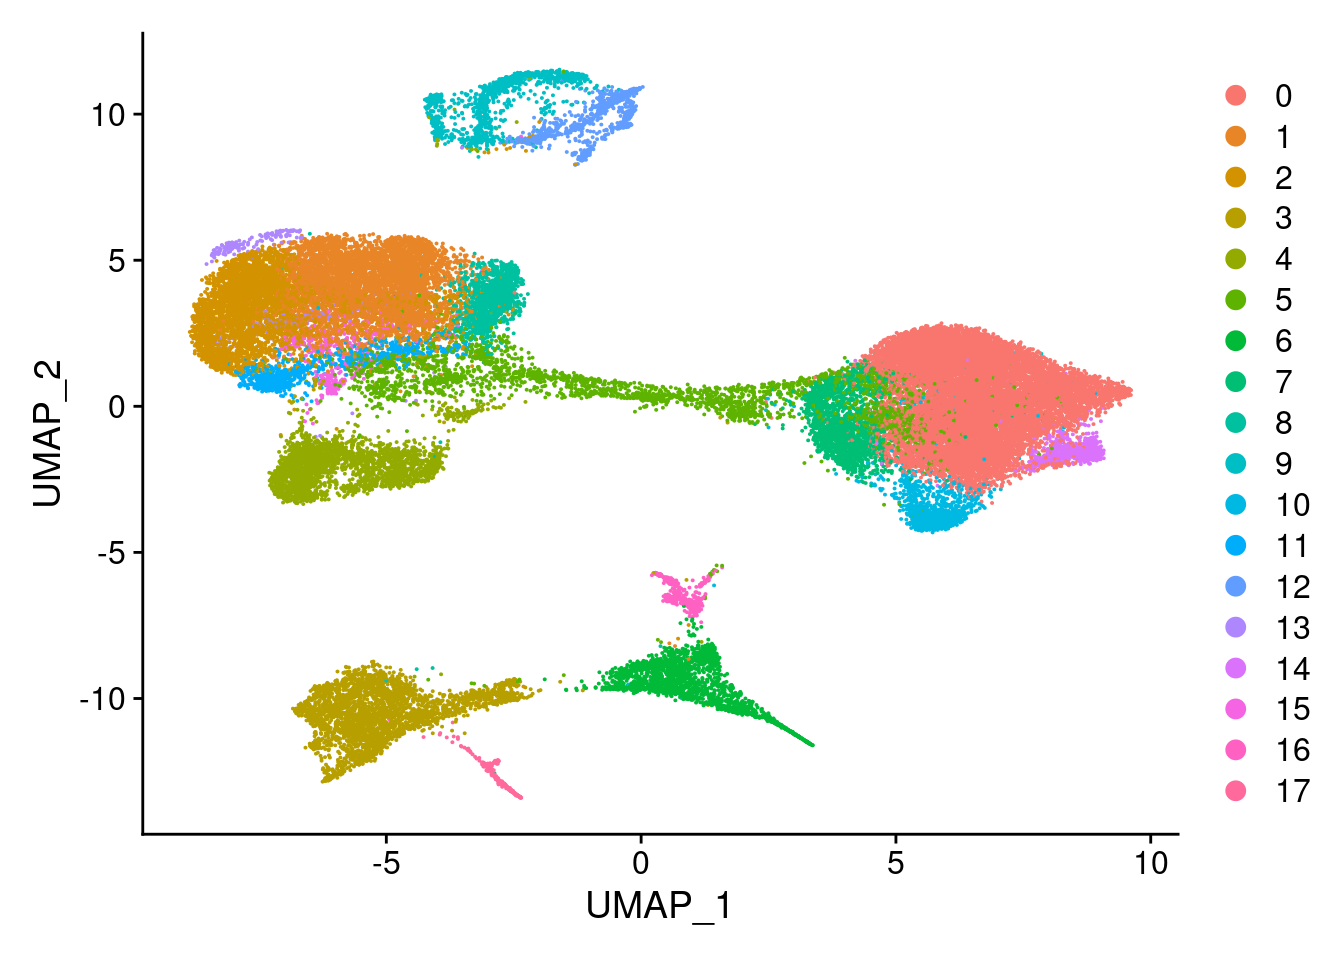
DimPlot(merged, reduction = "umap", group.by = "Batch")
DimPlot(merged, reduction = "umap", group.by = "individual")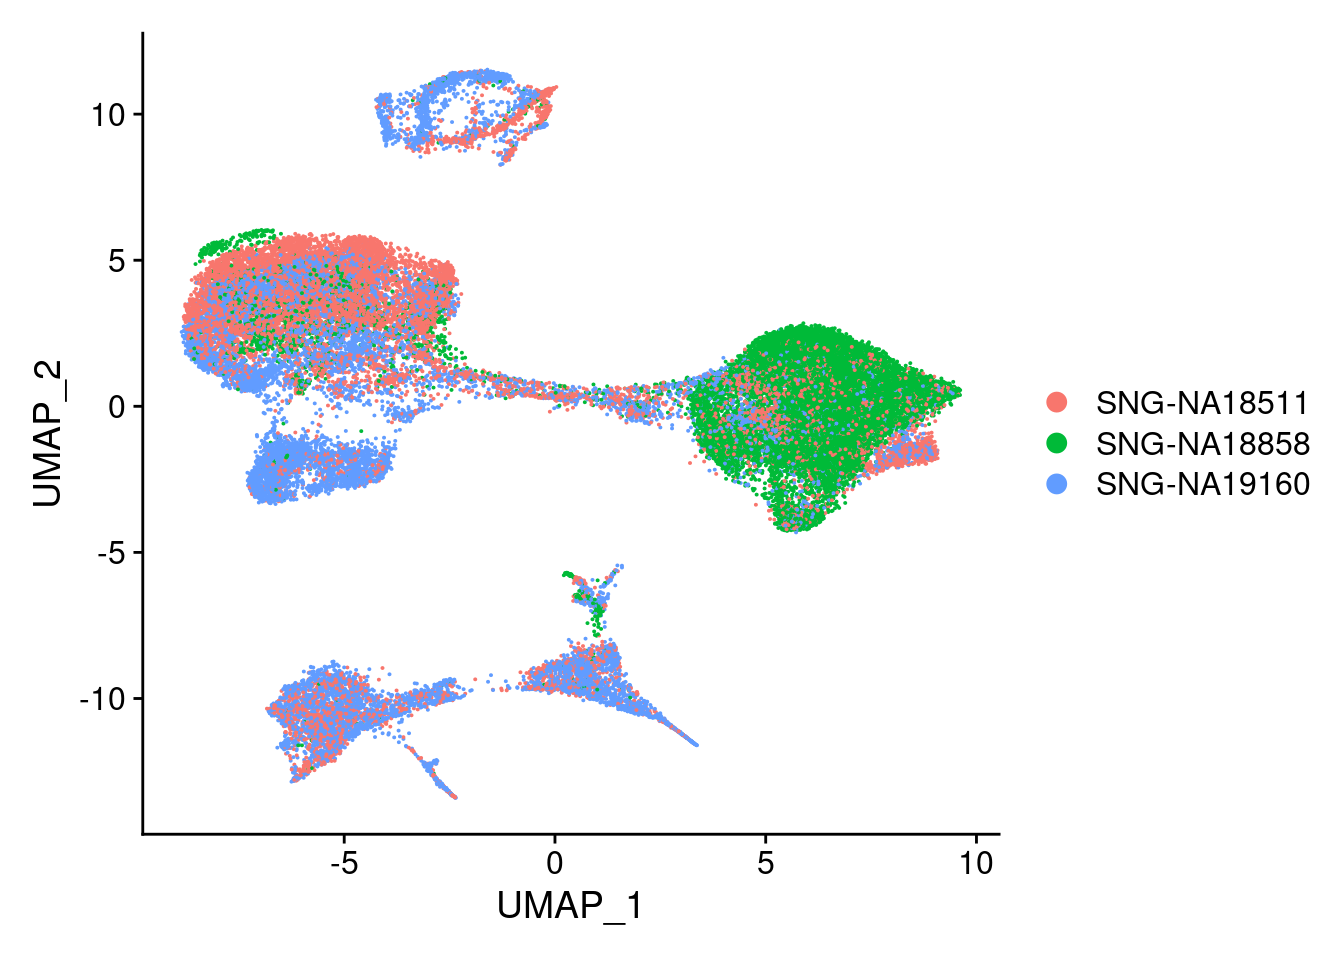
xlim <- c(min(merged@reductions$umap@cell.embeddings[,'UMAP_1']),
          max(merged@reductions$umap@cell.embeddings[,'UMAP_1']))
ylim <- c(min(merged@reductions$umap@cell.embeddings[,'UMAP_2']),
          max(merged@reductions$umap@cell.embeddings[,'UMAP_2']))
for (i in individuals)
{
  print(DimPlot(merged, reduction = "umap",
                cells = WhichCells(merged, expression = individual == i)) +
          xlim(xlim) + ylim(ylim) + ggtitle(i))
}
#reassign idents
Idents(merged)<- 'SCT_snn_res.0.1'
DimPlot(merged, reduction = "umap")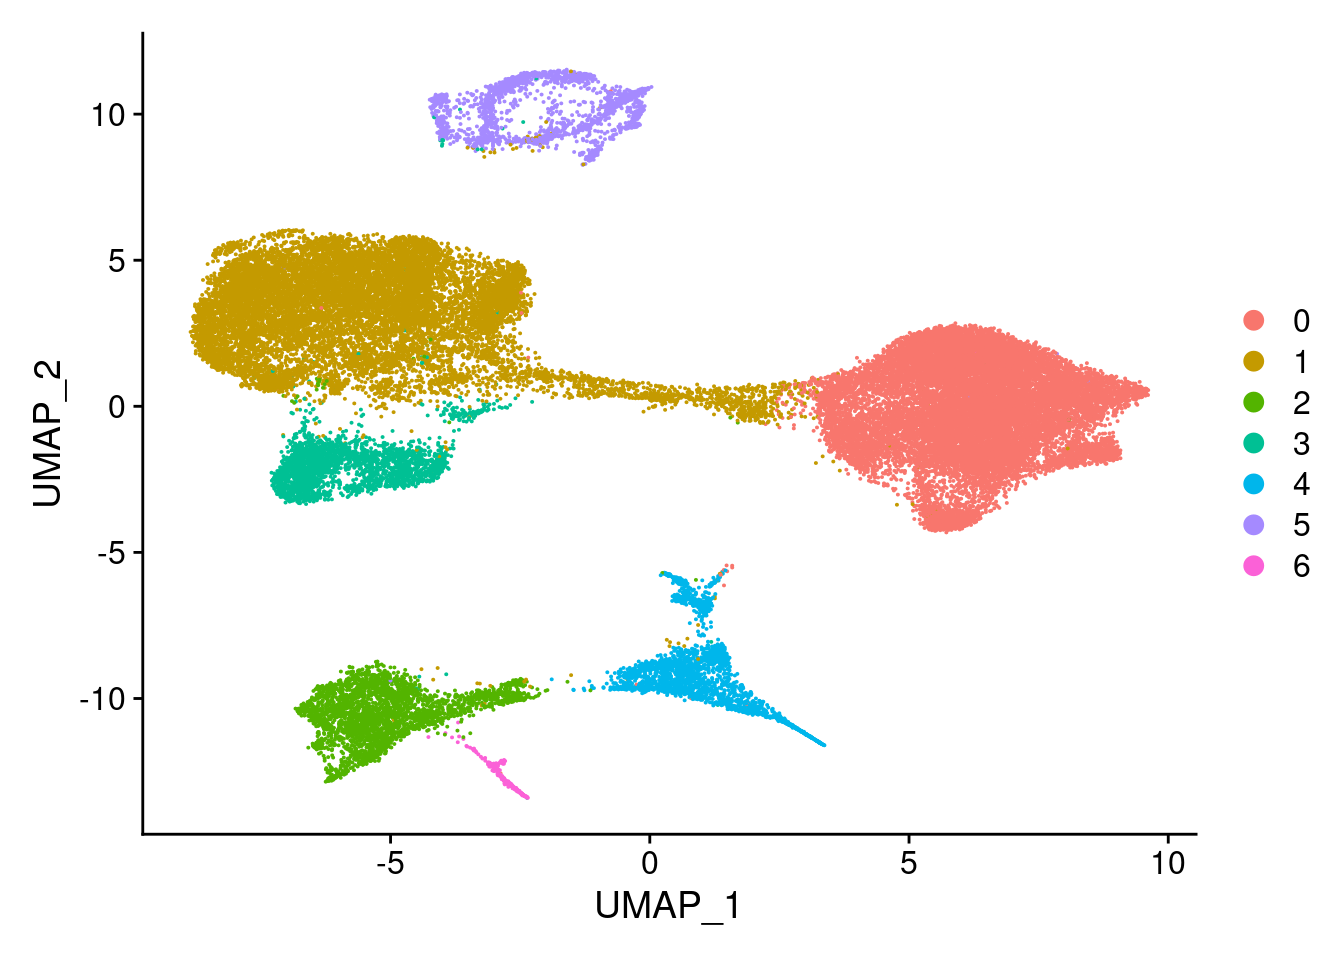
| Version | Author | Date |
|---|---|---|
| 421a225 | KLRhodes | 2020-08-10 |
DimPlot(merged, reduction = "umap", group.by = "Batch")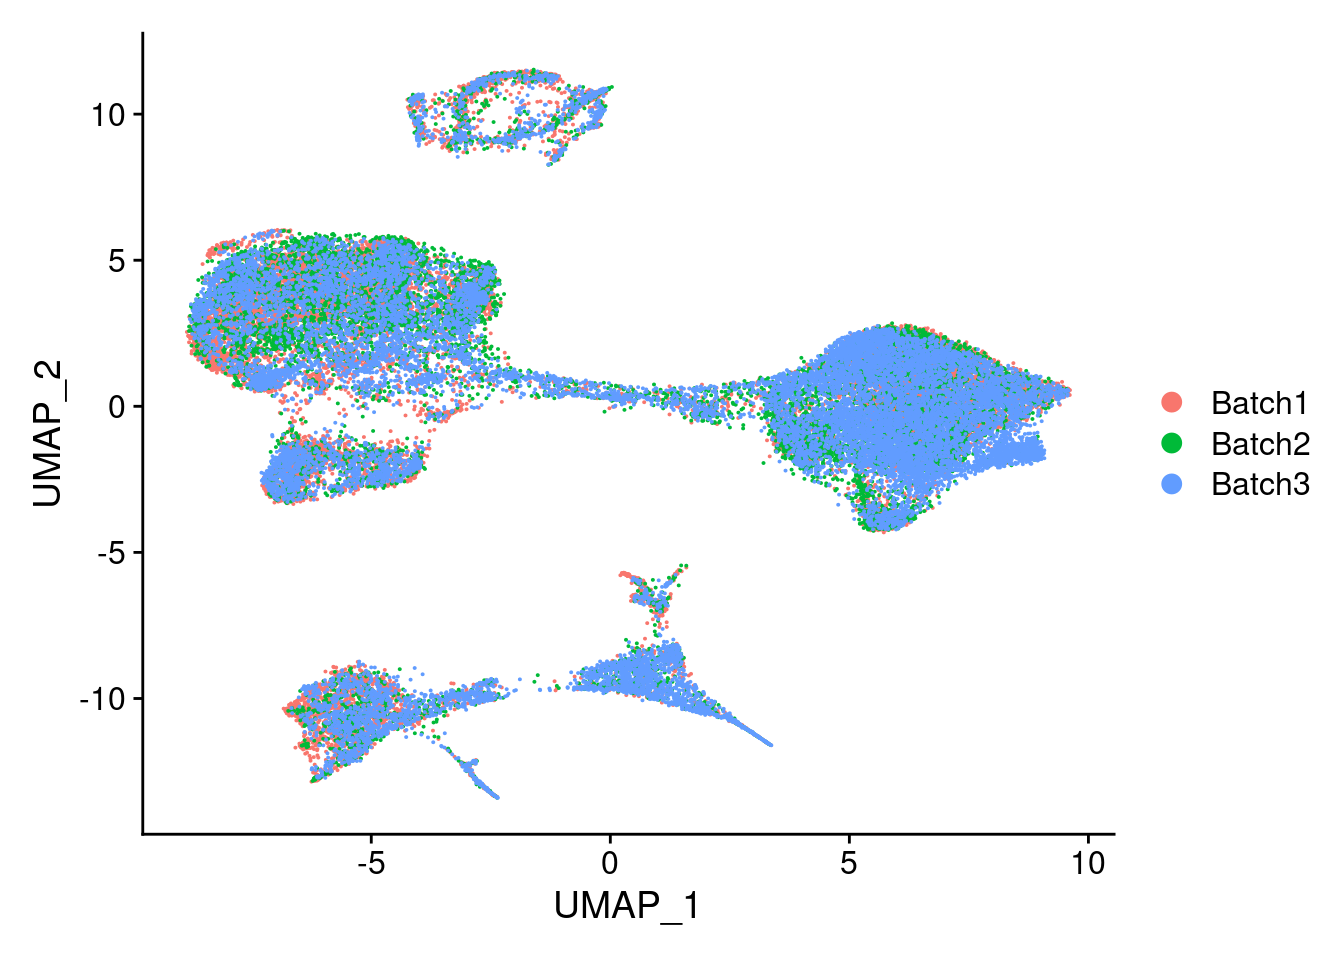
DimPlot(merged, reduction = "umap", group.by = "individual")
xlim <- c(min(merged@reductions$umap@cell.embeddings[,'UMAP_1']),
          max(merged@reductions$umap@cell.embeddings[,'UMAP_1']))
ylim <- c(min(merged@reductions$umap@cell.embeddings[,'UMAP_2']),
          max(merged@reductions$umap@cell.embeddings[,'UMAP_2']))
for (i in individuals)
{
  print(DimPlot(merged, reduction = "umap",
                cells = WhichCells(merged, expression = individual == i)) +
          xlim(xlim) + ylim(ylim) + ggtitle(i))
}
#reassign idents
Idents(merged)<- 'SCT_snn_res.0.8'
DimPlot(merged, reduction = "umap")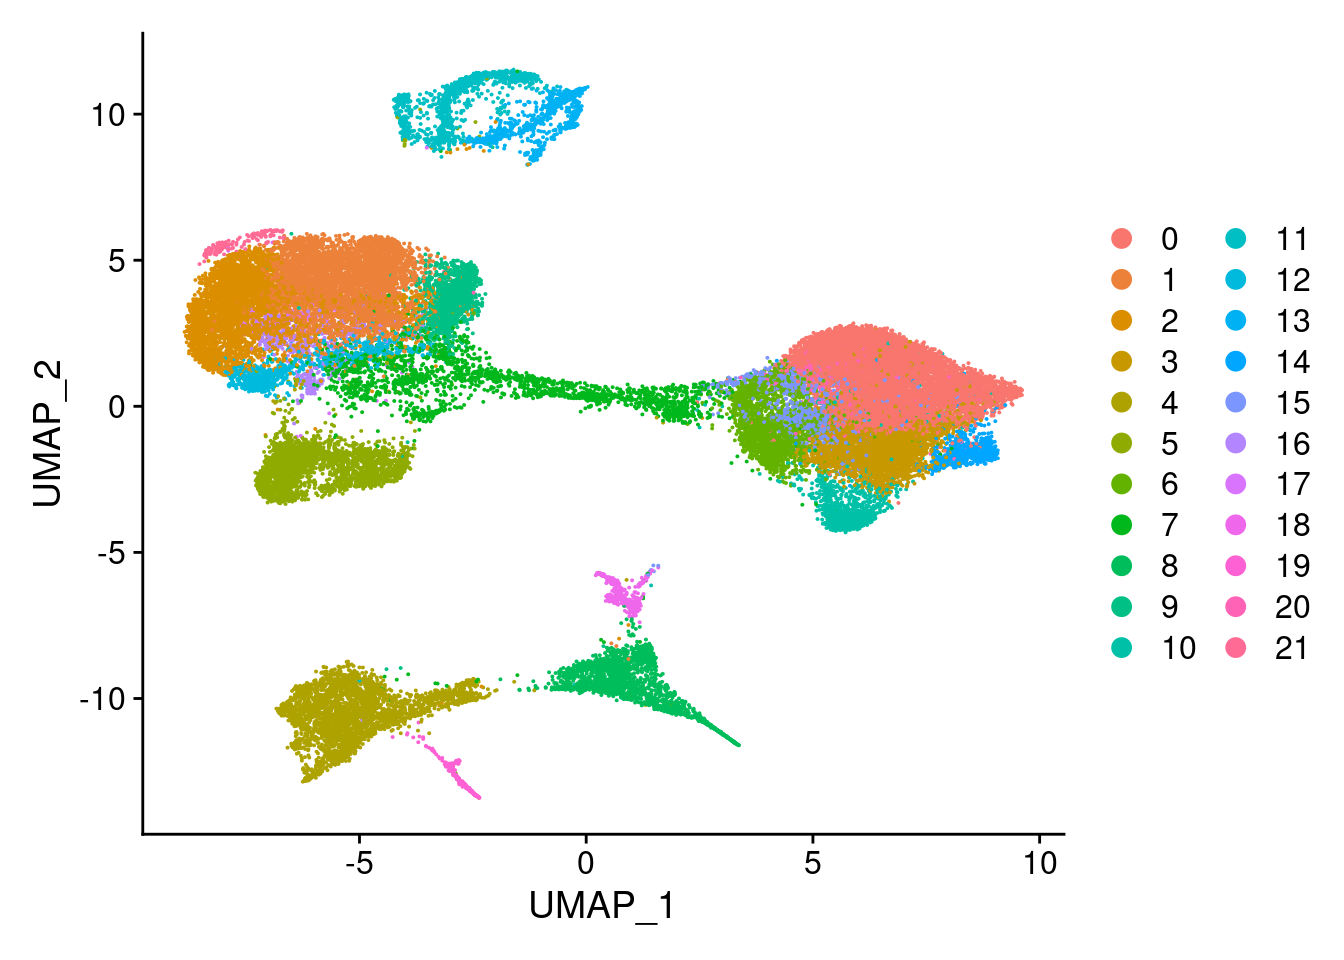
DimPlot(merged, reduction = "umap", group.by = "Batch")
DimPlot(merged, reduction = "umap", group.by = "individual")
xlim <- c(min(merged@reductions$umap@cell.embeddings[,'UMAP_1']),
          max(merged@reductions$umap@cell.embeddings[,'UMAP_1']))
ylim <- c(min(merged@reductions$umap@cell.embeddings[,'UMAP_2']),
          max(merged@reductions$umap@cell.embeddings[,'UMAP_2']))
for (i in individuals)
{
  print(DimPlot(merged, reduction = "umap",
                cells = WhichCells(merged, expression = individual == i)) +
          xlim(xlim) + ylim(ylim) + ggtitle(i))
}
VlnPlot(merged, features= "percent.mt", group.by = "SCT_snn_res.1", pt.size = 0)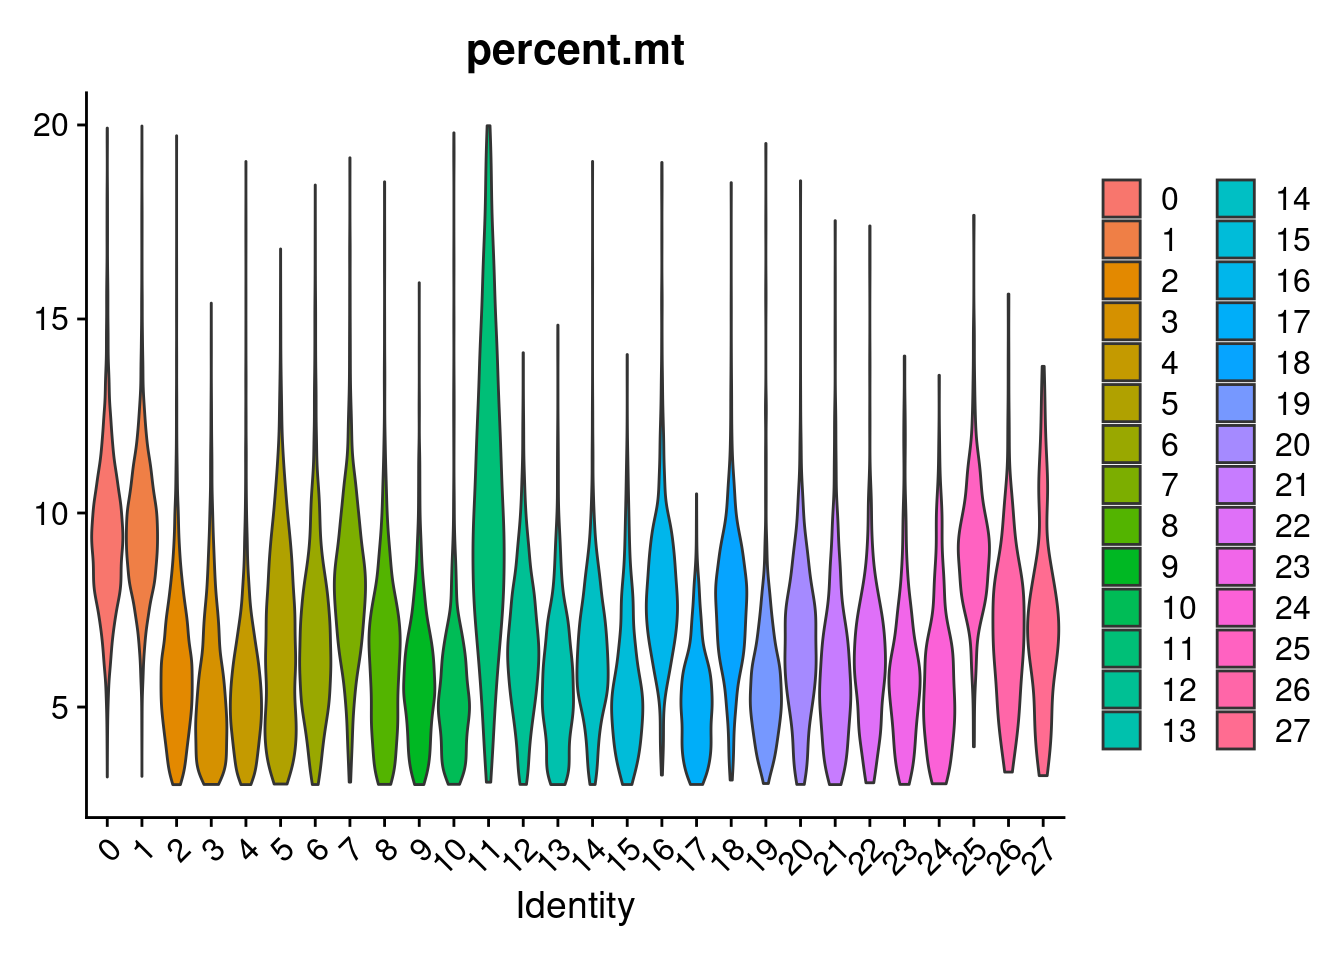
| Version | Author | Date |
|---|---|---|
| 421a225 | KLRhodes | 2020-08-10 |
merged[["percent.rps"]]<- PercentageFeatureSet(merged, pattern = "^RPS")
merged[["percent.rpl"]]<- PercentageFeatureSet(merged, pattern = "^RPL")
merged[["percent.rp"]]<- merged[["percent.rps"]]+merged[["percent.rpl"]]
VlnPlot(merged, features= "percent.rp", group.by = "SCT_snn_res.1", pt.size=0)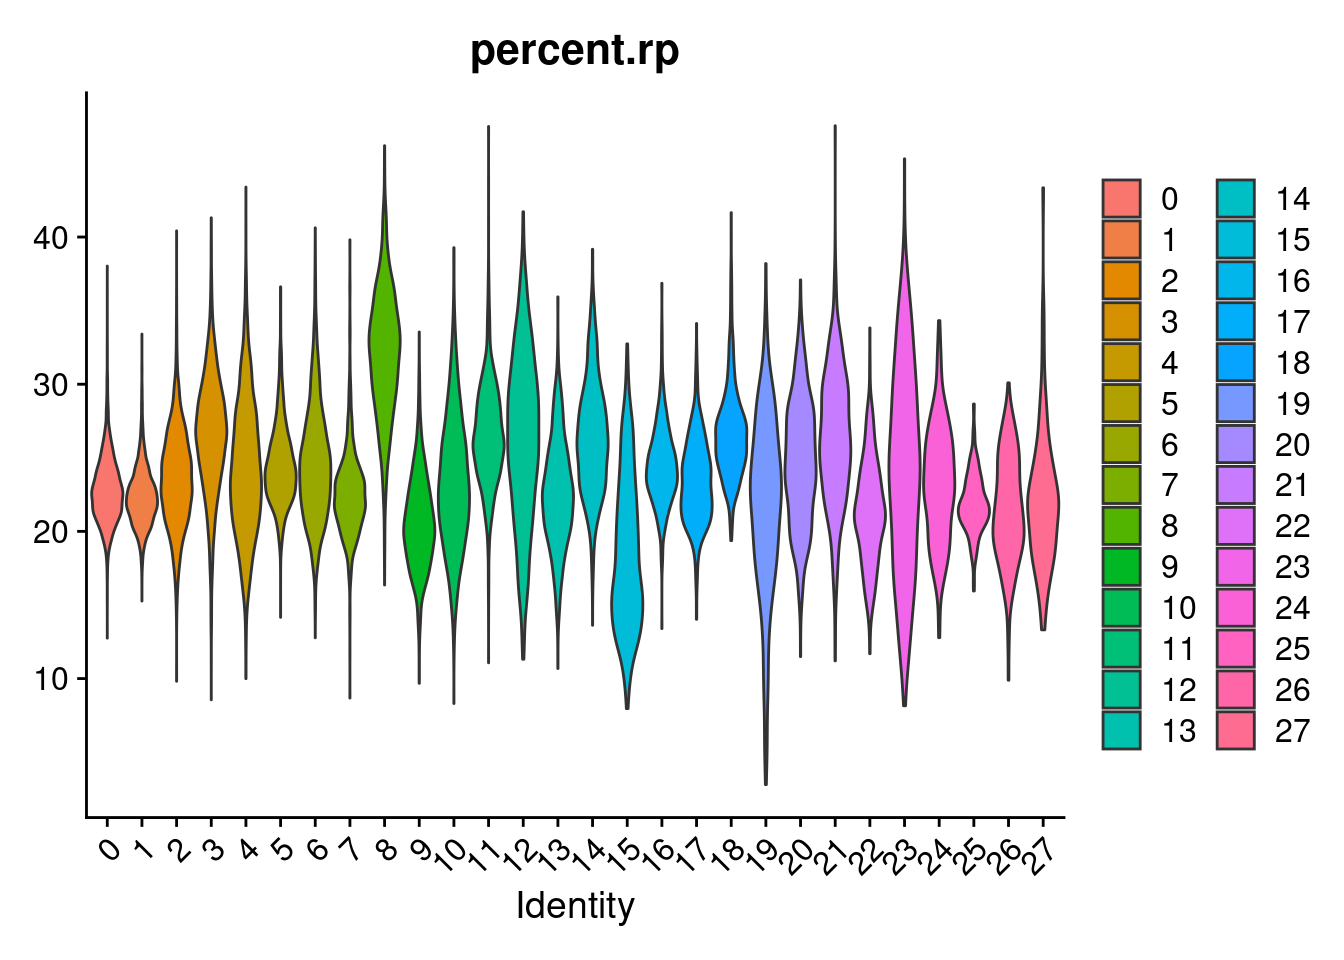
| Version | Author | Date |
|---|---|---|
| 421a225 | KLRhodes | 2020-08-10 |
FeaturePlot(merged, features = "nFeature_RNA")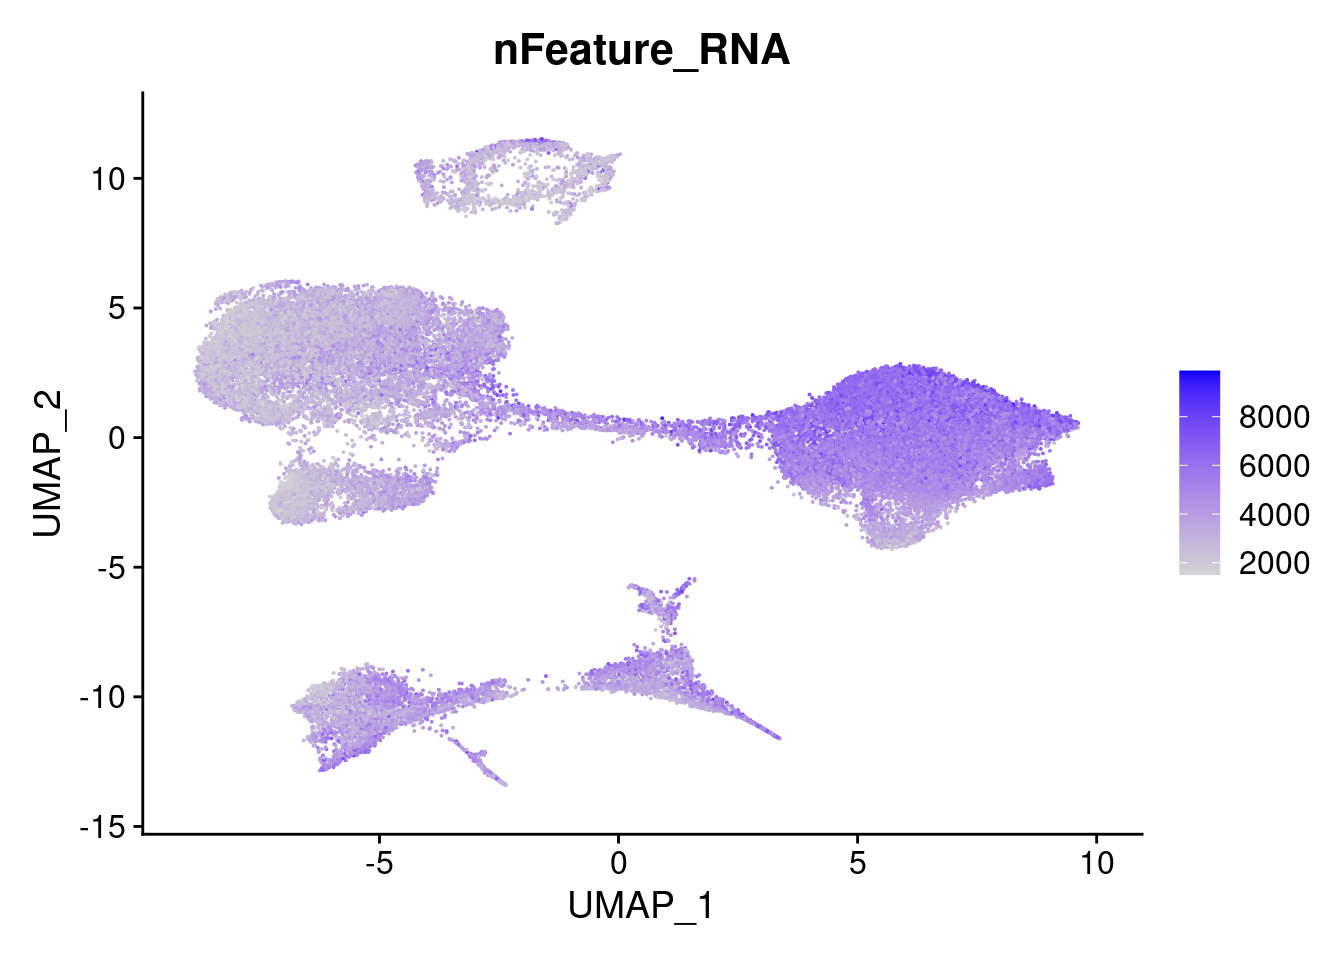
head(merged)An object of class Seurat
2 features across 42488 samples within 2 assays
Active assay: SCT (1 features, 1 variable features)
1 other assay present: RNA
3 dimensional reductions calculated: pca, harmony, umapVlnPlot(merged, features= "nFeature_RNA", group.by = "SCT_snn_res.1", pt.size=0)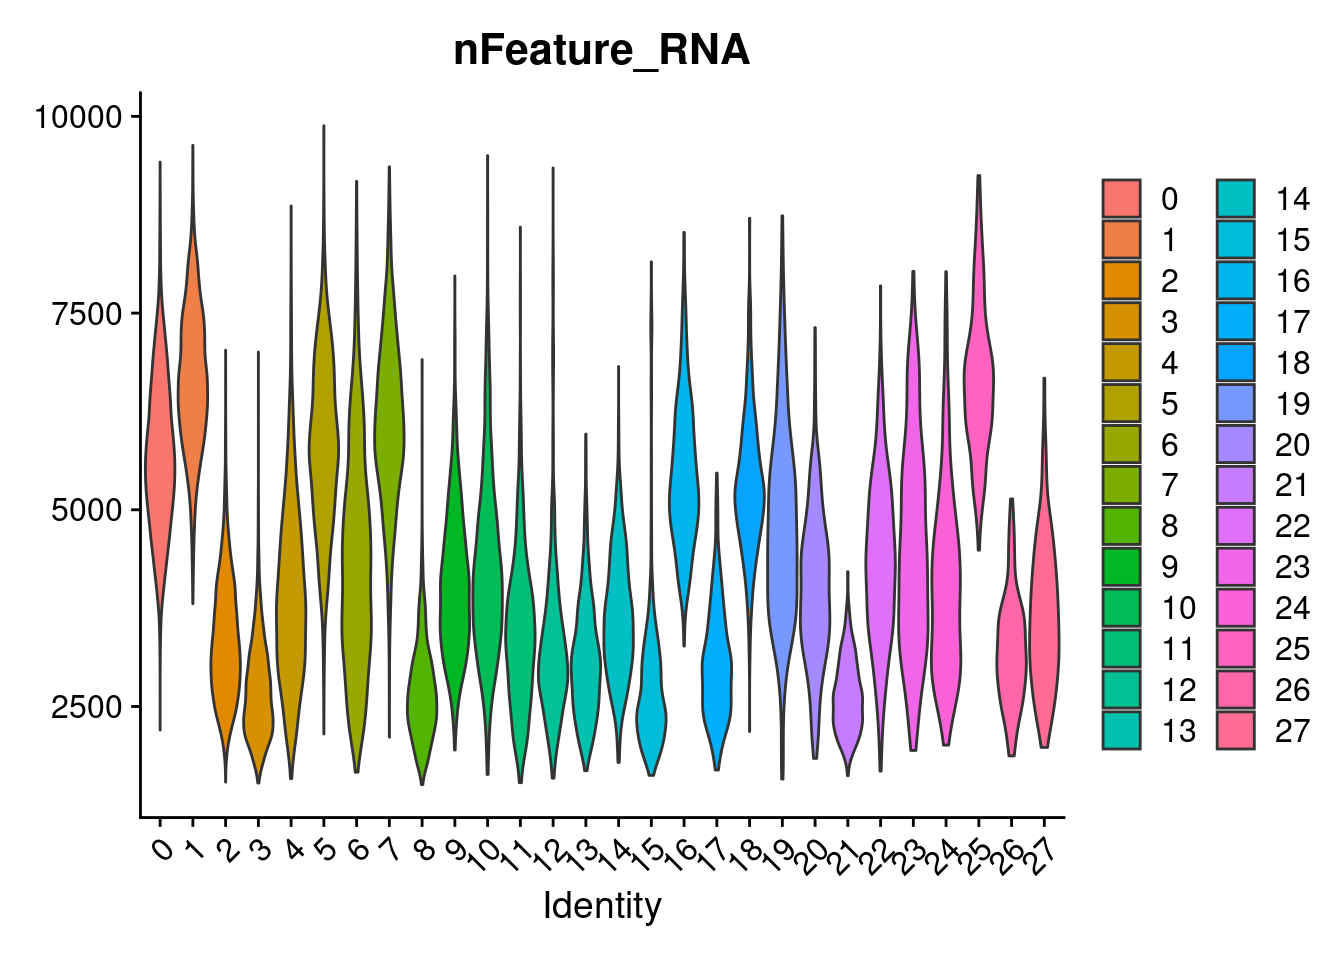
FeaturePlot(merged, features = c("POU5F1", "SOX17", "HAND1", "PAX6"), pt.size = 0.2, ncol=2, combine=T)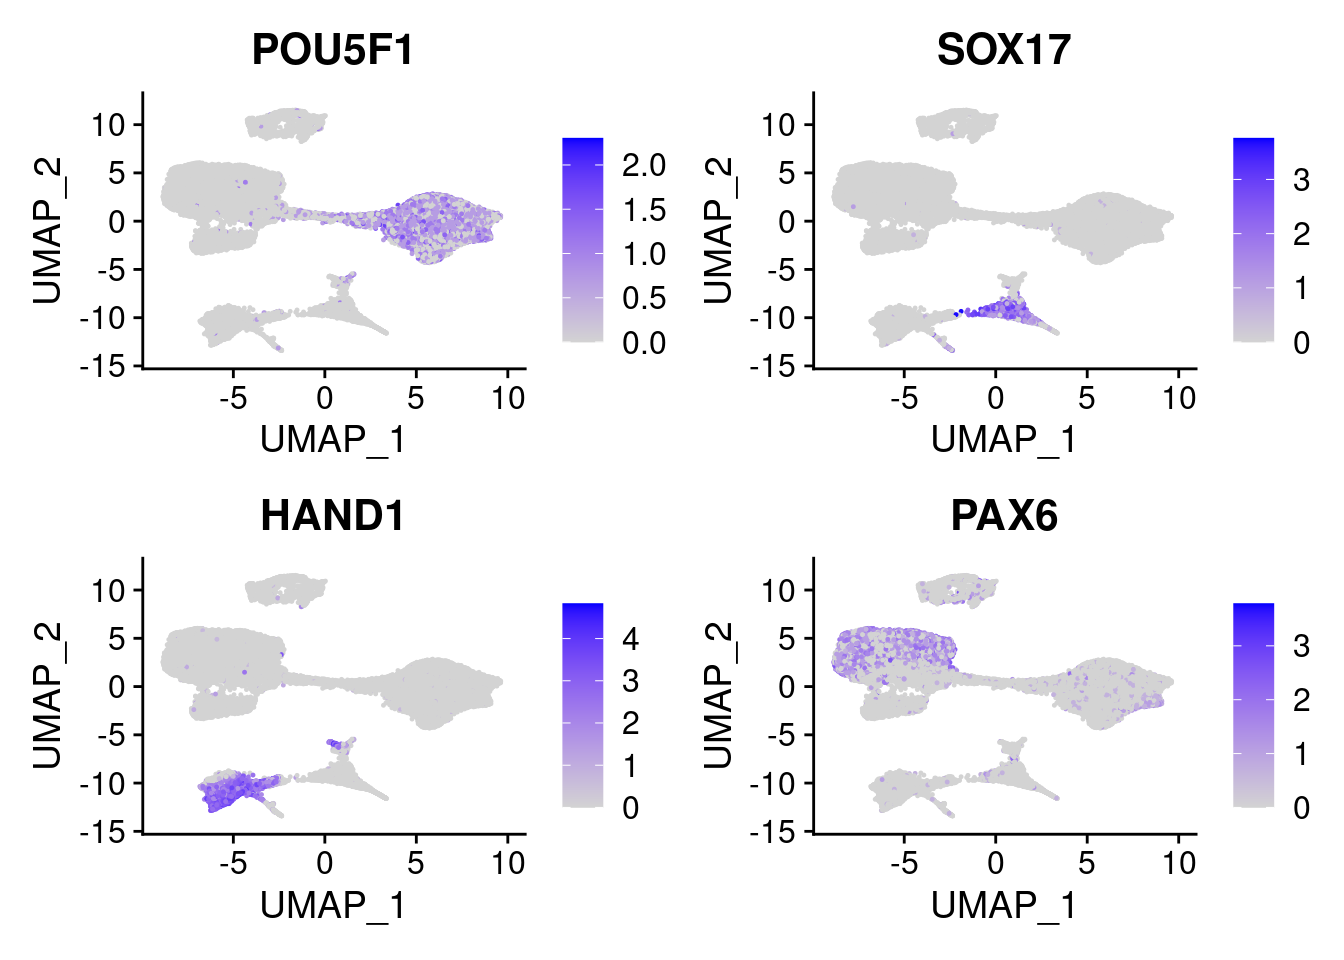
| Version | Author | Date |
|---|---|---|
| 421a225 | KLRhodes | 2020-08-10 |
FeaturePlot(merged, features = c("FGB", "ECSCR", "NEUROD1", "SOX10"), pt.size = 0.2, ncol=2)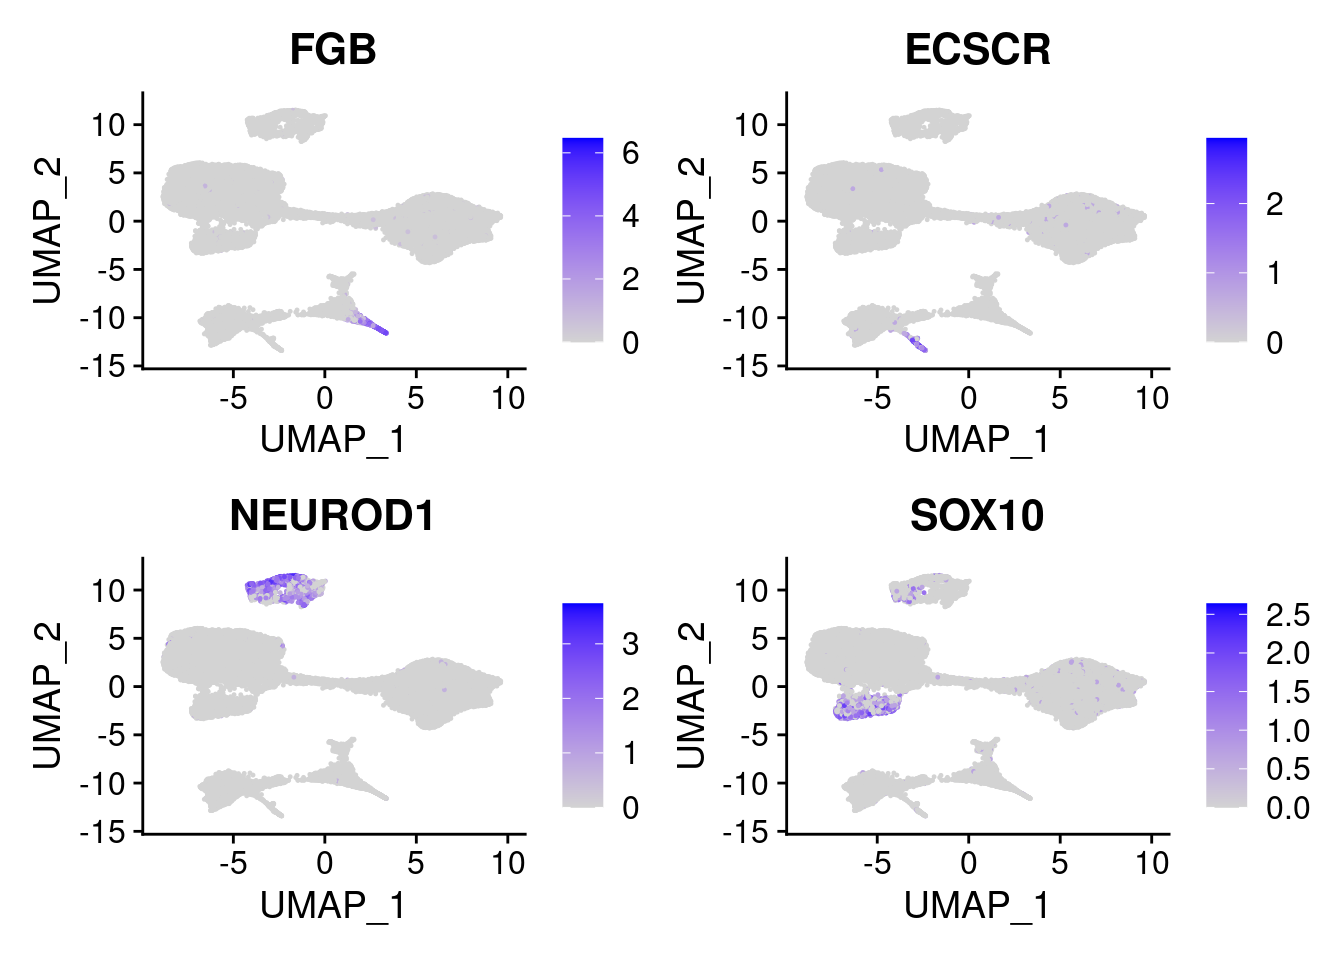
| Version | Author | Date |
|---|---|---|
| 421a225 | KLRhodes | 2020-08-10 |
sessionInfo()R version 3.6.1 (2019-07-05)
Platform: x86_64-pc-linux-gnu (64-bit)
Running under: Scientific Linux 7.4 (Nitrogen)
Matrix products: default
BLAS/LAPACK: /software/openblas-0.2.19-el7-x86_64/lib/libopenblas_haswellp-r0.2.19.so
locale:
[1] C
attached base packages:
[1] stats graphics grDevices utils datasets methods base
other attached packages:
[1] RColorBrewer_1.1-2 here_0.1-11 DataCombine_0.2.21 ggplot2_3.3.3
[5] harmony_1.0 Rcpp_1.0.6 Seurat_3.2.0 workflowr_1.6.2
loaded via a namespace (and not attached):
[1] Rtsne_0.15 colorspace_2.0-0 deldir_0.1-28
[4] ellipsis_0.3.1 ggridges_0.5.2 rprojroot_2.0.2
[7] fs_1.4.2 spatstat.data_1.4-3 farver_2.0.3
[10] leiden_0.3.3 listenv_0.8.0 npsurv_0.4-0
[13] ggrepel_0.9.0 RSpectra_0.16-0 codetools_0.2-16
[16] splines_3.6.1 lsei_1.2-0 knitr_1.29
[19] polyclip_1.10-0 jsonlite_1.7.2 ica_1.0-2
[22] cluster_2.1.0 png_0.1-7 uwot_0.1.10
[25] shiny_1.5.0 sctransform_0.2.1 compiler_3.6.1
[28] httr_1.4.2 Matrix_1.2-18 fastmap_1.0.1
[31] lazyeval_0.2.2 later_1.1.0.1 htmltools_0.5.0
[34] tools_3.6.1 rsvd_1.0.3 igraph_1.2.6
[37] gtable_0.3.0 glue_1.4.2 RANN_2.6.1
[40] reshape2_1.4.4 dplyr_1.0.2 rappdirs_0.3.3
[43] spatstat_1.64-1 vctrs_0.3.6 gdata_2.18.0
[46] ape_5.4-1 nlme_3.1-140 lmtest_0.9-37
[49] xfun_0.16 stringr_1.4.0 globals_0.12.5
[52] mime_0.9 miniUI_0.1.1.1 lifecycle_0.2.0
[55] irlba_2.3.3 gtools_3.8.2 goftest_1.2-2
[58] future_1.18.0 MASS_7.3-51.4 zoo_1.8-8
[61] scales_1.1.1 promises_1.1.1 spatstat.utils_1.17-0
[64] parallel_3.6.1 yaml_2.2.1 reticulate_1.20
[67] pbapply_1.4-2 gridExtra_2.3 rpart_4.1-15
[70] stringi_1.5.3 caTools_1.18.0 rlang_0.4.10
[73] pkgconfig_2.0.3 bitops_1.0-6 evaluate_0.14
[76] lattice_0.20-38 ROCR_1.0-7 purrr_0.3.4
[79] tensor_1.5 labeling_0.4.2 patchwork_1.1.1
[82] htmlwidgets_1.5.1 cowplot_1.1.1 tidyselect_1.1.0
[85] RcppAnnoy_0.0.18 plyr_1.8.6 magrittr_2.0.1
[88] R6_2.5.0 gplots_3.0.4 generics_0.1.0
[91] pillar_1.4.7 whisker_0.4 withr_2.4.2
[94] mgcv_1.8-28 fitdistrplus_1.0-14 survival_3.2-3
[97] abind_1.4-5 tibble_3.0.4 future.apply_1.6.0
[100] crayon_1.3.4 KernSmooth_2.23-15 plotly_4.9.2.1
[103] rmarkdown_2.3 grid_3.6.1 data.table_1.13.4
[106] git2r_0.26.1 digest_0.6.27 xtable_1.8-4
[109] tidyr_1.1.0 httpuv_1.5.4 munsell_0.5.0
[112] viridisLite_0.3.0