SampleFilteringandSCT_Batch1Lane1
klrhodes
8/4/2020
Last updated: 2021-07-05
Checks: 7 0
Knit directory: Embryoid_Body_Pilot_Workflowr/analysis/
This reproducible R Markdown analysis was created with workflowr (version 1.6.2). The Checks tab describes the reproducibility checks that were applied when the results were created. The Past versions tab lists the development history.
Great! Since the R Markdown file has been committed to the Git repository, you know the exact version of the code that produced these results.
Great job! The global environment was empty. Objects defined in the global environment can affect the analysis in your R Markdown file in unknown ways. For reproduciblity it's best to always run the code in an empty environment.
The command set.seed(20200804) was run prior to running the code in the R Markdown file. Setting a seed ensures that any results that rely on randomness, e.g. subsampling or permutations, are reproducible.
Great job! Recording the operating system, R version, and package versions is critical for reproducibility.
Nice! There were no cached chunks for this analysis, so you can be confident that you successfully produced the results during this run.
Great job! Using relative paths to the files within your workflowr project makes it easier to run your code on other machines.
Great! You are using Git for version control. Tracking code development and connecting the code version to the results is critical for reproducibility.
The results in this page were generated with repository version c8767ac. See the Past versions tab to see a history of the changes made to the R Markdown and HTML files.
Note that you need to be careful to ensure that all relevant files for the analysis have been committed to Git prior to generating the results (you can use wflow_publish or wflow_git_commit). workflowr only checks the R Markdown file, but you know if there are other scripts or data files that it depends on. Below is the status of the Git repository when the results were generated:
Ignored files:
    Ignored:    .Rhistory
    Ignored:    .Rproj.user/
    Ignored:    analysis/.Rhistory
    Ignored:    output/.Rhistory

Untracked files:
    Untracked:  GSE122380_raw_counts.txt.gz
    Untracked:  UTF1_plots.Rmd
    Untracked:  analysis/IntegrateReference_SCTregressCaoPlusScHCL_JustEarlyEcto.Rmd
    Untracked:  analysis/IntegrateReference_SCTregressCaoPlusScHCL_JustEndo.Rmd
    Untracked:  analysis/IntegrateReference_SCTregressCaoPlusScHCL_JustMeso.Rmd
    Untracked:  analysis/IntegrateReference_SCTregressCaoPlusScHCL_JustNeuralCrest.Rmd
    Untracked:  analysis/IntegrateReference_SCTregressCaoPlusScHCL_JustNeuron.Rmd
    Untracked:  analysis/IntegrateReference_SCTregressCaoPlusScHCL_JustPluri.Rmd
    Untracked:  analysis/OLD/
    Untracked:  analysis/Pseudobulk_Limma_Harmony.BatchIndividual_ClusterRes0.8_minPCT0.2.Rmd
    Untracked:  analysis/Pseudobulk_Limma_Harmony.BatchIndividual_ClusterRes1_minPCT0.2.Rmd
    Untracked:  analysis/Pseudobulk_VariancePartition_Harmony.Batchindividual_ClusterRes0.1_byCluster.Rmd
    Untracked:  analysis/RefInt_ComparingFulltoPartialIntegrationAnnotations.Rmd
    Untracked:  analysis/ReferenceAnn_DE.Rmd
    Untracked:  analysis/SingleCell_HierarchicalClustering_NoGeneFilter.Rmd
    Untracked:  analysis/SingleCell_VariancePartitionByCluster_Harmony.Batchindividual_ClusterRes0.1_minPCT0.2.Rmd
    Untracked:  analysis/VarPartPlots_res0.1_SCT.Rmd
    Untracked:  analysis/VarPart_SC_res0.1_SCT.Rmd
    Untracked:  analysis/child/
    Untracked:  analysis/k10topics_Explore.Rmd
    Untracked:  analysis/k6topics_Explore.Rmd
    Untracked:  build_refint_scale.R
    Untracked:  build_refint_sct.R
    Untracked:  build_stuff.R
    Untracked:  build_varpart_sc.R
    Untracked:  code/.ipynb_checkpoints/
    Untracked:  code/CellRangerPreprocess.Rmd
    Untracked:  code/ConvertToDGE.Rmd
    Untracked:  code/ConvertToDGE_PseudoBulk.Rmd
    Untracked:  code/ConvertToDGE_SingleCellRes_minPCT0.2.Rmd
    Untracked:  code/EB.getHumanMetadata.Rmd
    Untracked:  code/GEO_processed_data.Rmd
    Untracked:  code/PowerAnalysis_NoiseRatio.ipynb
    Untracked:  code/Untitled.ipynb
    Untracked:  code/Untitled1.ipynb
    Untracked:  code/compile_fits.Rmd
    Untracked:  code/fit_all_models.sh
    Untracked:  code/fit_poisson_nmf.R
    Untracked:  code/fit_poisson_nmf.sbatch
    Untracked:  code/functions_for_fit_comparison.Rmd
    Untracked:  code/get_genelist_byPCTthresh.Rmd
    Untracked:  code/prefit_poisson_nmf.R
    Untracked:  code/prefit_poisson_nmf.sbatch
    Untracked:  code/prepare_data_for_fastTopics.Rmd
    Untracked:  data/HCL_Fig1_adata.h5ad
    Untracked:  data/HCL_Fig1_adata.h5seurat
    Untracked:  data/dge/
    Untracked:  data/dge_raw_data.tar.gz
    Untracked:  data/ref.expr.rda
    Untracked:  figure/
    Untracked:  output/CR_sampleQCrds/
    Untracked:  output/CaoEtAl.Obj.CellsOfAllClusters.ProteinCodingGenes.rds
    Untracked:  output/CaoEtAl.Obj.rds
    Untracked:  output/ClusterInfo_res0.1.csv
    Untracked:  output/DGELists/
    Untracked:  output/DownSampleVarPart.rds
    Untracked:  output/Frequency.MostCommonAnnotation.FiveNearestRefCells.csv
    Untracked:  output/GEOsubmissionProcessedFiles/
    Untracked:  output/GeneLists_by_minPCT/
    Untracked:  output/MostCommonAnnotation.FiveNearestRefCells.csv
    Untracked:  output/NearestReferenceCell.Cao.hESC.EuclideanDistanceinHarmonySpace.csv
    Untracked:  output/NearestReferenceCell.Cao.hESC.FrequencyofEachAnnotation.csv
    Untracked:  output/NearestReferenceCell.SCTregressRNAassay.Cao.hESC.EuclideanDistanceinHarmonySpace.csv
    Untracked:  output/NearestReferenceCell.SCTregressRNAassay.Cao.hESC.FrequencyofEachAnnotation.csv
    Untracked:  output/Pseudobulk_Limma_res0.1_OnevAllTopTables.csv
    Untracked:  output/Pseudobulk_Limma_res0.1_OnevAll_top10Upregby_adjP.csv
    Untracked:  output/Pseudobulk_Limma_res0.1_OnevAll_top10Upregby_logFC.csv
    Untracked:  output/Pseudobulk_Limma_res0.5_OnevAllTopTables.csv
    Untracked:  output/Pseudobulk_Limma_res0.8_OnevAllTopTables.csv
    Untracked:  output/Pseudobulk_Limma_res1_OnevAllTopTables.csv
    Untracked:  output/Pseudobulk_VarPart.ByCluster.Res0.1.rds
    Untracked:  output/ResidualVariances_fromDownSampAnalysis.csv
    Untracked:  output/SingleCell_VariancePartition_RNA_Res0.1_minPCT0.2.rds
    Untracked:  output/SingleCell_VariancePartition_Res0.1_minPCT0.2.rds
    Untracked:  output/SingleCell_VariancePartition_SCT_Res0.1_minPCT0.2.rds
    Untracked:  output/TopicModelling_k10_top10drivergenes.byBeta.csv
    Untracked:  output/TopicModelling_k6_top10drivergenes.byBeta.csv
    Untracked:  output/TopicModelling_k6_top15drivergenes.byZ.csv
    Untracked:  output/TranferredAnnotations_ReferenceInt_JustEarlyEcto.csv
    Untracked:  output/TranferredAnnotations_ReferenceInt_JustEndoderm.csv
    Untracked:  output/TranferredAnnotations_ReferenceInt_JustMeso.csv
    Untracked:  output/TranferredAnnotations_ReferenceInt_JustNeuralCrest.csv
    Untracked:  output/TranferredAnnotations_ReferenceInt_JustNeuron.csv
    Untracked:  output/TranferredAnnotations_ReferenceInt_JustPluripotent.csv
    Untracked:  output/VarPart.ByCluster.Res0.1.rds
    Untracked:  output/azimuth/
    Untracked:  output/downsamp_10800cells_10subreps_medianexplainedbyresiduals_varpart_PsB.rds
    Untracked:  output/downsamp_16200cells_10subreps_medianexplainedbyresiduals_varpart_PsB.rds
    Untracked:  output/downsamp_21600cells_10subreps_medianexplainedbyresiduals_varpart_PsB.rds
    Untracked:  output/downsamp_2700cells_10subreps_medianexplainedbyresiduals_varpart_PsB.rds
    Untracked:  output/downsamp_2700cells_10subreps_medianexplainedbyresiduals_varpart_scres.rds
    Untracked:  output/downsamp_5400cells_10subreps_medianexplainedbyresiduals_varpart_PsB.rds
    Untracked:  output/downsamp_7200cells_10subreps_medianexplainedbyresiduals_varpart_PsB.rds
    Untracked:  output/fasttopics/
    Untracked:  output/figs/
    Untracked:  output/merge.Cao.SCTwRegressOrigIdent.rds
    Untracked:  output/merge.all.SCTwRegressOrigIdent.Harmony.rds
    Untracked:  output/merged.SCT.counts.matrix.rds
    Untracked:  output/merged.raw.counts.matrix.rds
    Untracked:  output/mergedObjects/
    Untracked:  output/pdfs/
    Untracked:  output/sampleQCrds/
    Untracked:  output/splitgpm_gsea_results/
    Untracked:  slurm-12005914.out
    Untracked:  slurm-12005923.out

Unstaged changes:
    Deleted:    analysis/IntegrateAnalysis.afterFilter.HarmonyBatch.Rmd
    Deleted:    analysis/IntegrateAnalysis.afterFilter.HarmonyBatchSampleIDindividual.Rmd
    Modified:   analysis/IntegrateAnalysis.afterFilter.HarmonyBatchindividual.Rmd
    Deleted:    analysis/IntegrateAnalysis.afterFilter.NOHARMONYjustmerge.Rmd
    Deleted:    analysis/IntegrateAnalysis.afterFilter.SCTregressBatchIndividual.Rmd
    Deleted:    analysis/IntegrateAnalysis.afterFilter.SCTregressBatchIndividualHarmonyBatchindividual.Rmd
    Modified:   analysis/Pseudobulk_HierarchicalClustering_Harmony.Batchindividual_ClusterRes0.1_minPCT0.2.Rmd
    Modified:   analysis/Pseudobulk_HierarchicalClustering_Harmony.Batchindividual_ClusterRes0.5_minPCT0.2.Rmd
    Modified:   analysis/Pseudobulk_HierarchicalClustering_Harmony.Batchindividual_ClusterRes0.8_minPCT0.2.Rmd
    Modified:   analysis/Pseudobulk_HierarchicalClustering_Harmony.Batchindividual_ClusterRes1_minPCT0.2.Rmd
    Modified:   analysis/Pseudobulk_Limma_Harmony.BatchIndividual_ClusterRes0.1_minPCT0.2.Rmd
    Modified:   analysis/Pseudobulk_Limma_Harmony.BatchIndividual_ClusterRes0.5_minPCT0.2.Rmd
    Modified:   analysis/Pseudobulk_VariancePartition_Harmony.Batchindividual_ClusterRes0.1_minPCT0.2.Rmd
    Modified:   analysis/Pseudobulk_VariancePartition_Harmony.Batchindividual_ClusterRes0.5_minPCT0.2.Rmd
    Modified:   analysis/Pseudobulk_VariancePartition_Harmony.Batchindividual_ClusterRes0.8_minPCT0.2.Rmd
    Modified:   analysis/Pseudobulk_VariancePartition_Harmony.Batchindividual_ClusterRes1_minPCT0.2.Rmd
    Deleted:    analysis/RunscHCL_HarmonyBatchInd.Rmd
Note that any generated files, e.g. HTML, png, CSS, etc., are not included in this status report because it is ok for generated content to have uncommitted changes.
These are the previous versions of the repository in which changes were made to the R Markdown (analysis/SampleFilteringandSCT_Batch1Lane1.Rmd) and HTML (docs/SampleFilteringandSCT_Batch1Lane1.html) files. If you've configured a remote Git repository (see ?wflow_git_remote), click on the hyperlinks in the table below to view the files as they were in that past version.
| File | Version | Author | Date | Message |
|---|---|---|---|---|
| html | 74badaf | KLRhodes | 2020-08-04 | Build site. |
| Rmd | 6173fef | KLRhodes | 2020-08-04 | test |
| html | 3035ff6 | KLRhodes | 2020-08-04 | Build site. |
| Rmd | 6b4fa36 | KLRhodes | 2020-08-04 | test |
| html | b36135b | KLRhodes | 2020-08-04 | Build site. |
| html | e81b5c7 | KLRhodes | 2020-08-04 | Build site. |
| Rmd | c6c3247 | KLRhodes | 2020-08-04 | testing knit_expand again |
| html | 2626c9b | KLRhodes | 2020-08-04 | Build site. |
| Rmd | 422197b | KLRhodes | 2020-08-04 | testing knit expand |
library(knitr)
library(Seurat)
library(Matrix)
library(DropletUtils)
library(ggplot2)
library(dplyr)
library(here)
load rds
samp.obj<- readRDS('/project2/gilad/katie/Pilot_HumanEBs/HumanEB_QCmetadata/Batch1_Lane1_seurat_NoNorm_QCMetaAdded.rds')qc<- knitr::knit_expand(file = here::here("analysis/child/SampleFilteringAndSCT.Rmd"))load libraries
library(Seurat)
library(Matrix)
library(DropletUtils)
library(ggplot2)
library(dplyr)
options(future.globals.maxSize= 4000*1024^2) # allow global exceeding 4Gb
Note: This gets run after EB.metadata.Rmd (located in code directory), which read star solo output, adds metadata for species, runs emptydrops and adds QC metadata, runs demuxlet and adds individual metadata, and %MT and %ribosomal to the metadata. This facilitates filtering done here.
head(samp.obj)An object of class Seurat
1 features across 4702 samples within 1 assay
Active assay: RNA (1 features, 0 variable features)#remove doublets (and chimp, which are assigned to doublet in this case)
samp.obj<- subset(samp.obj, subset = individual != 'Doublet')
#remove cells assigned to individuals not actually in this sample. presumably these are low quality cells that could not be accurately assigned, so their closest match was another individual in the vcf file.
samp.obj<- subset(samp.obj, subset = individual != 'SNG-SCM-12.variant')
samp.obj<- subset(samp.obj, subset = individual != 'SNG-SCM-13.variant')
samp.obj<- subset(samp.obj, subset = individual != 'SNG-SCM-6.variant')
samp.obj<- subset(samp.obj, subset = individual != 'SNG-SCM-7.variant')
samp.obj<- subset(samp.obj, subset = individual != 'SNG-SCM-8.variant')
#remove non-YRI human individuals (non-YRI humans only included in 1 replicate, so not needed for exploration of bio and tech variance)
samp.obj<- subset(samp.obj, subset = individual != 'SNG-SCM-10.variant')
samp.obj<- subset(samp.obj, subset = individual != 'SNG-SCM-9.variant')head(samp.obj)An object of class Seurat
1 features across 2142 samples within 1 assay
Active assay: RNA (1 features, 0 variable features)samp.obj<- subset(samp.obj, subset = EmptyDrops.FDR < .0001) # very strict, may lose some "good" cells, but limits set to high quality cells and there are enough cells remaining for downstream analyseshead(samp.obj)An object of class Seurat
1 features across 1566 samples within 1 assay
Active assay: RNA (1 features, 0 variable features)VlnPlot(samp.obj, features= "percent.mt", group.by = "individual", pt.size = 0)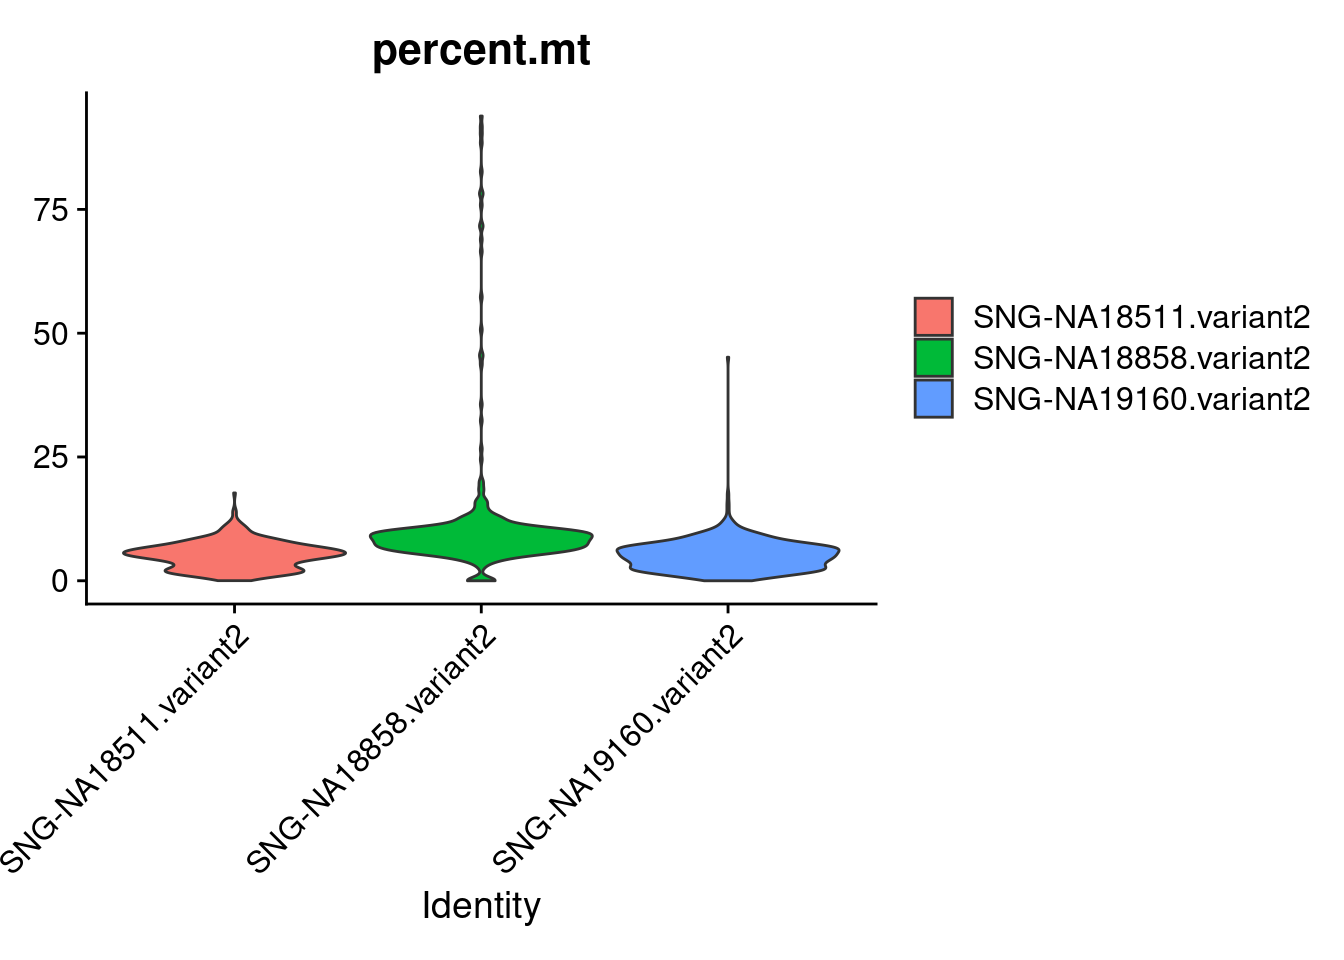
| Version | Author | Date |
|---|---|---|
| 74badaf | KLRhodes | 2020-08-04 |
#visualize feature-feature relationships with FeatureScatter
plot1<- FeatureScatter(samp.obj, feature1 = "nCount_RNA", feature2 = "percent.mt", group.by = "individual")
plot2<- FeatureScatter(samp.obj, feature1 = "nCount_RNA", feature2 = "nFeature_RNA", group.by = "individual")
CombinePlots(plots= list(plot1, plot2), legend = "right")
Warning: CombinePlots is being deprecated. Plots should now be combined using
the patchwork system.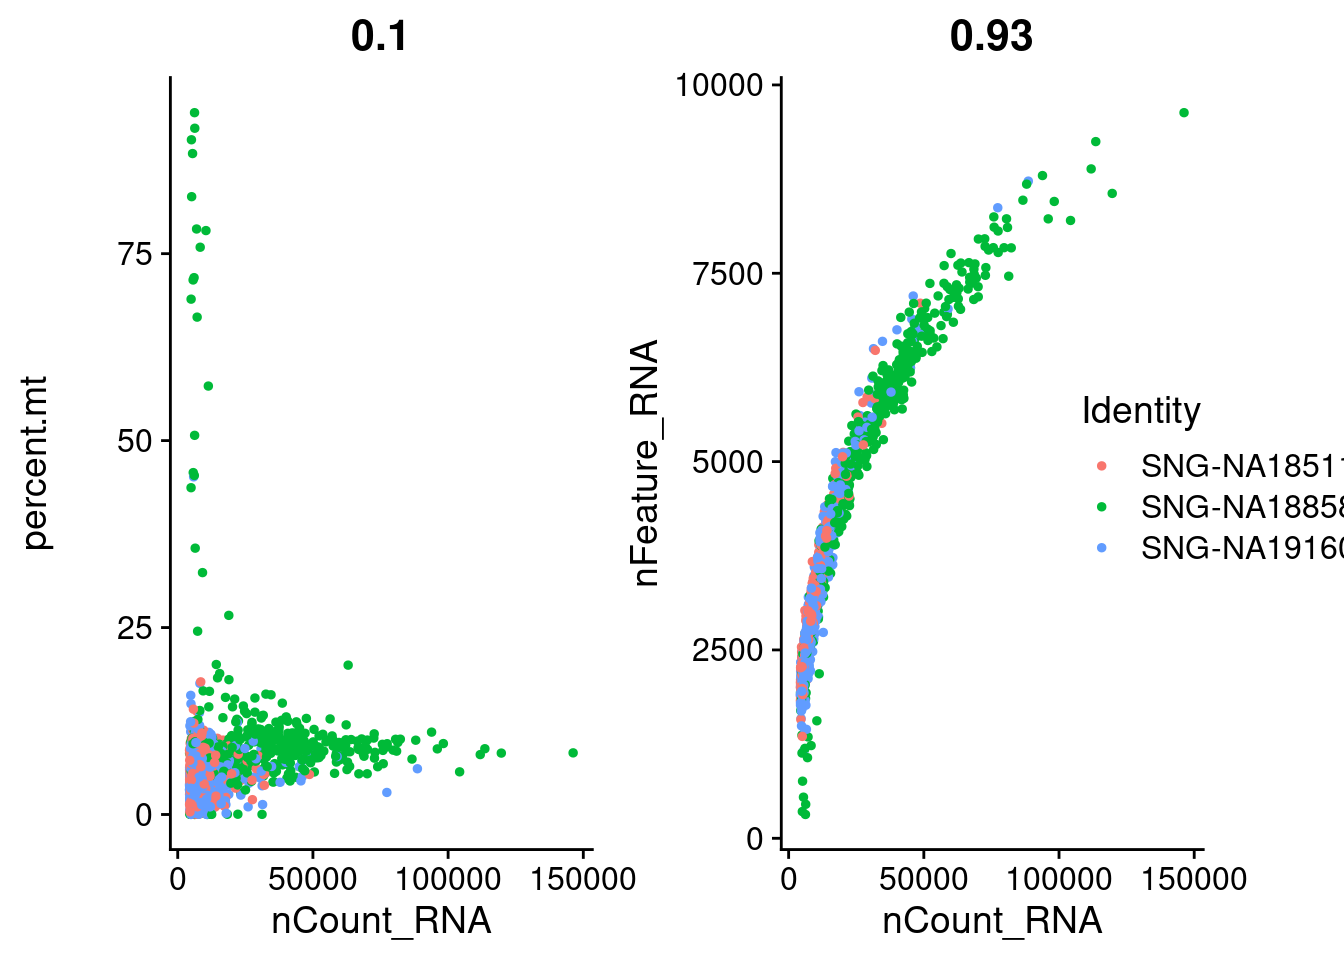
| Version | Author | Date |
|---|---|---|
| 74badaf | KLRhodes | 2020-08-04 |
#filtering out cells with high percent.mt. cutting cells with >20% mt based on the figure above and previous analysis of processed data.
samp.obj<- subset(samp.obj, subset = percent.mt < 20)
samp.obj<- subset(samp.obj, subset = percent.mt > 3) #because low mt cells cluster together into cluster of low quality cells downstream, can eliminate them here. this is very strict and will throw out potentially good cells from "good" clusters too. but those clusters have a range of mt percentage and will not be eliminated entirely like the junk clusters will.head(samp.obj)An object of class Seurat
1 features across 1245 samples within 1 assay
Active assay: RNA (1 features, 0 variable features)VlnPlot(samp.obj, features = "nCount_RNA",group.by = "individual", pt.size = 0)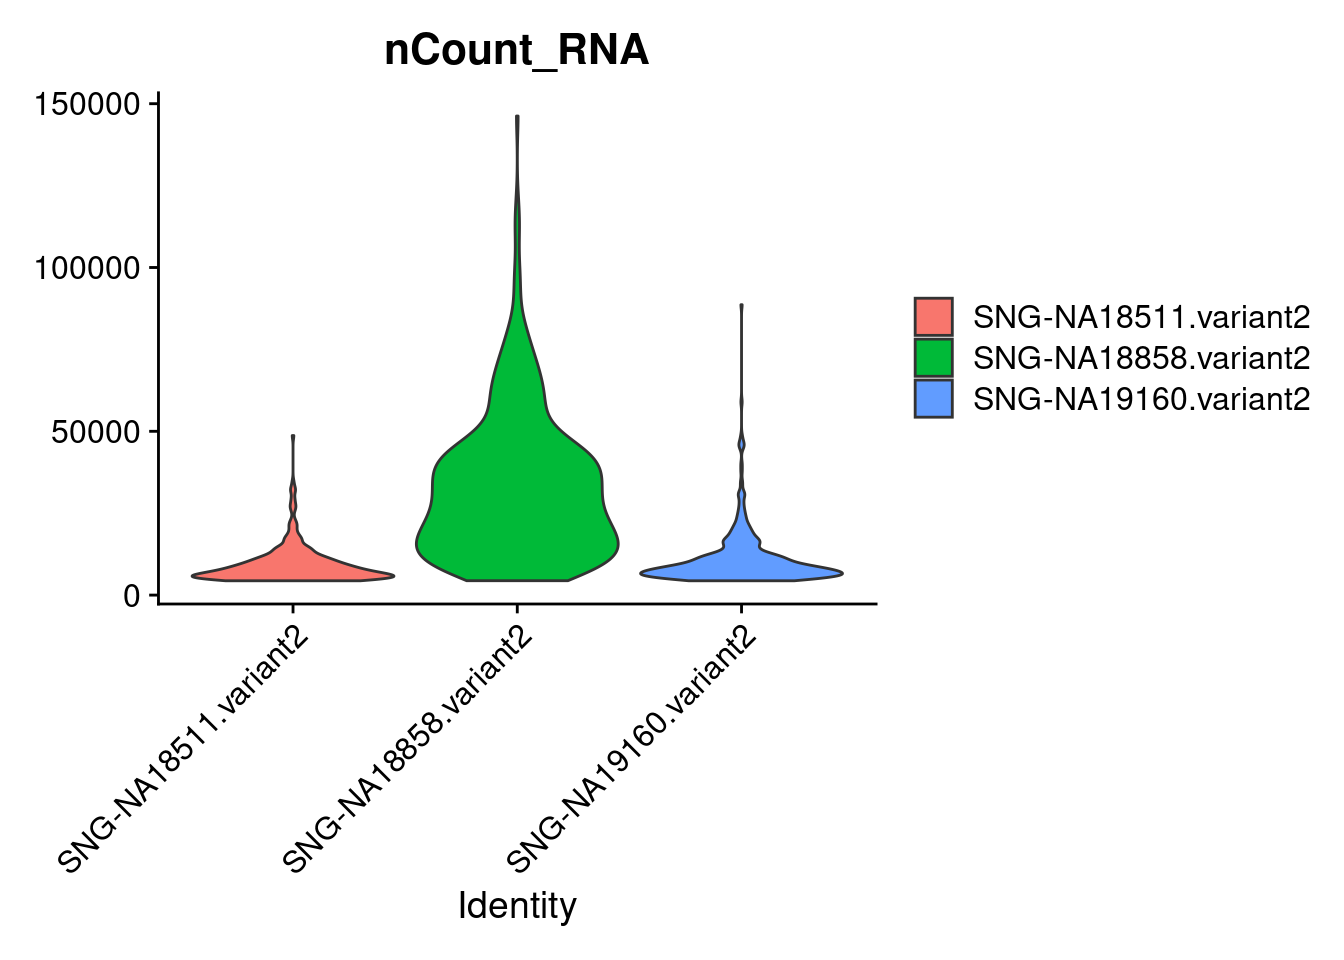
| Version | Author | Date |
|---|---|---|
| 74badaf | KLRhodes | 2020-08-04 |
18858 often has higher count/higher feature count. Based on downstream analyses, lots of 18858 remained in a pluripotent state and iPSCs tend to have higher counts than other cells types.
VlnPlot(samp.obj, features = "nFeature_RNA",group.by = "individual", pt.size = 0)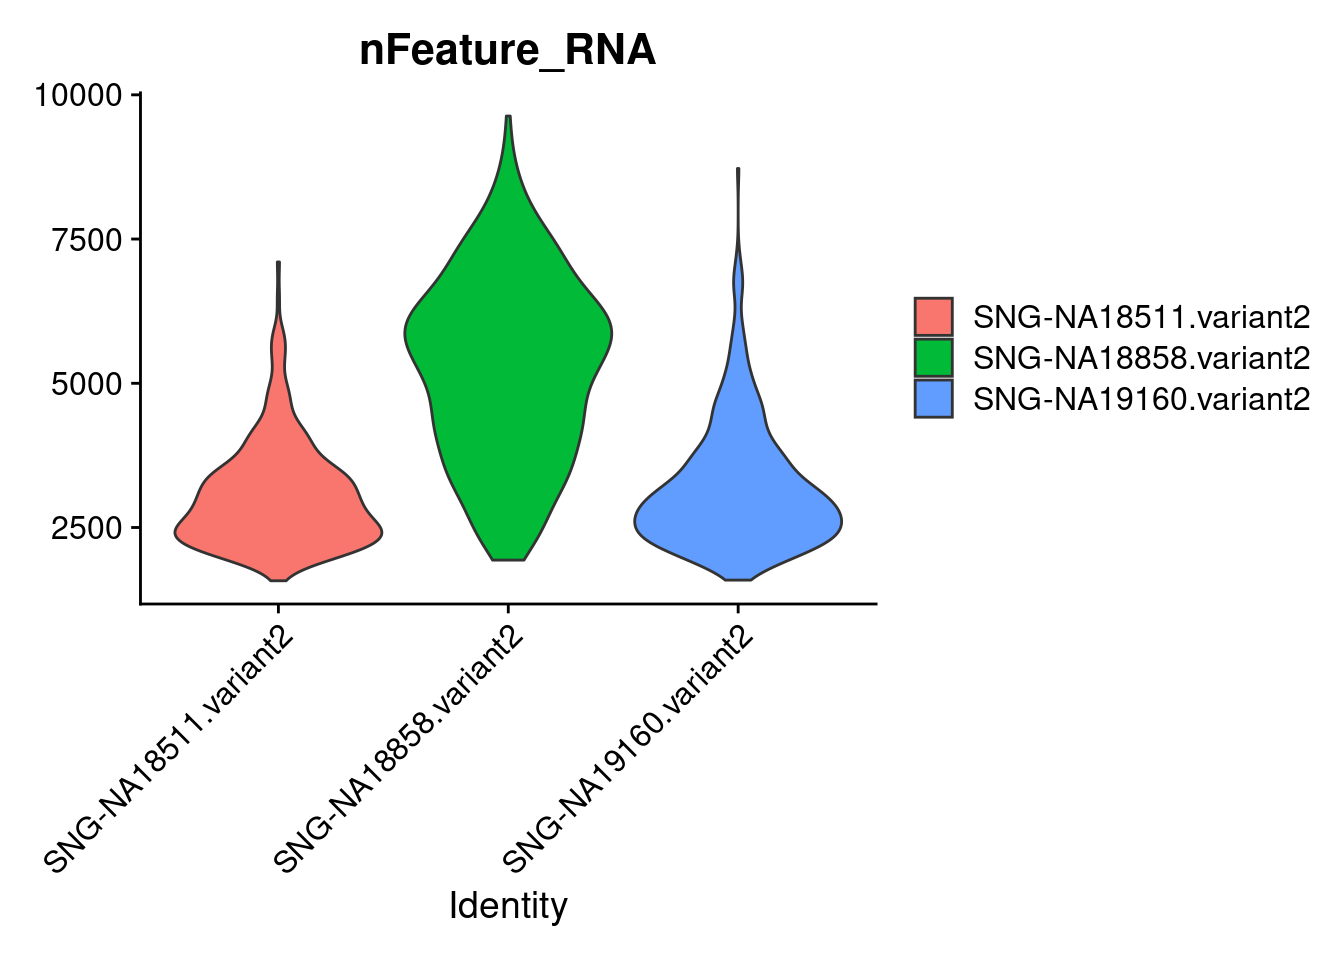
| Version | Author | Date |
|---|---|---|
| 74badaf | KLRhodes | 2020-08-04 |
head(samp.obj)An object of class Seurat
1 features across 1245 samples within 1 assay
Active assay: RNA (1 features, 0 variable features)summary(samp.obj$nFeature_RNA) Min. 1st Qu. Median Mean 3rd Qu. Max.
1577 2614 3411 3903 4957 9632 #set a feature threshold
samp.obj<- subset(samp.obj, subset = nFeature_RNA > 1500) #again, very strict, may lose some "good" cells, but limits set to high quality cells and there are enough cells remaining for downstream analyseshead(samp.obj)An object of class Seurat
1 features across 1245 samples within 1 assay
Active assay: RNA (1 features, 0 variable features)#in seurat SCTransform vignette, they regress out MT percentage, but we don't. Reasoning is that MT percentage probably correlates with cell type for us so its still useful information for clustering.
samp.obj<- suppressWarnings(SCTransform(samp.obj, verbose=F))samp.obj<- RunPCA(samp.obj, npcs= 100, verbose = F)DimPlot(samp.obj, reduction = "pca")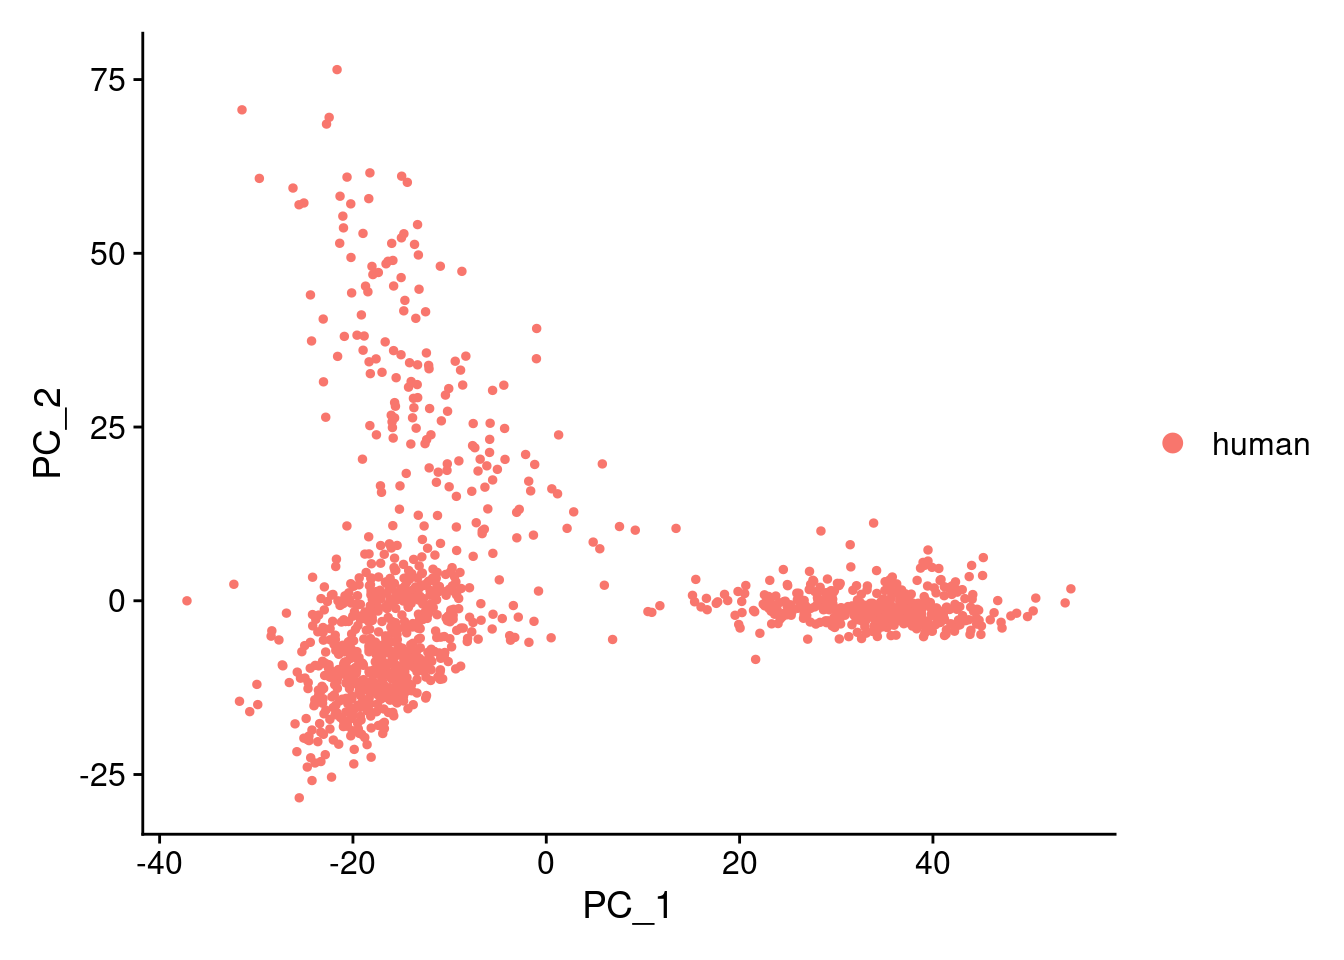
| Version | Author | Date |
|---|---|---|
| 74badaf | KLRhodes | 2020-08-04 |
DimPlot(samp.obj, reduction = "pca", group.by = "individual")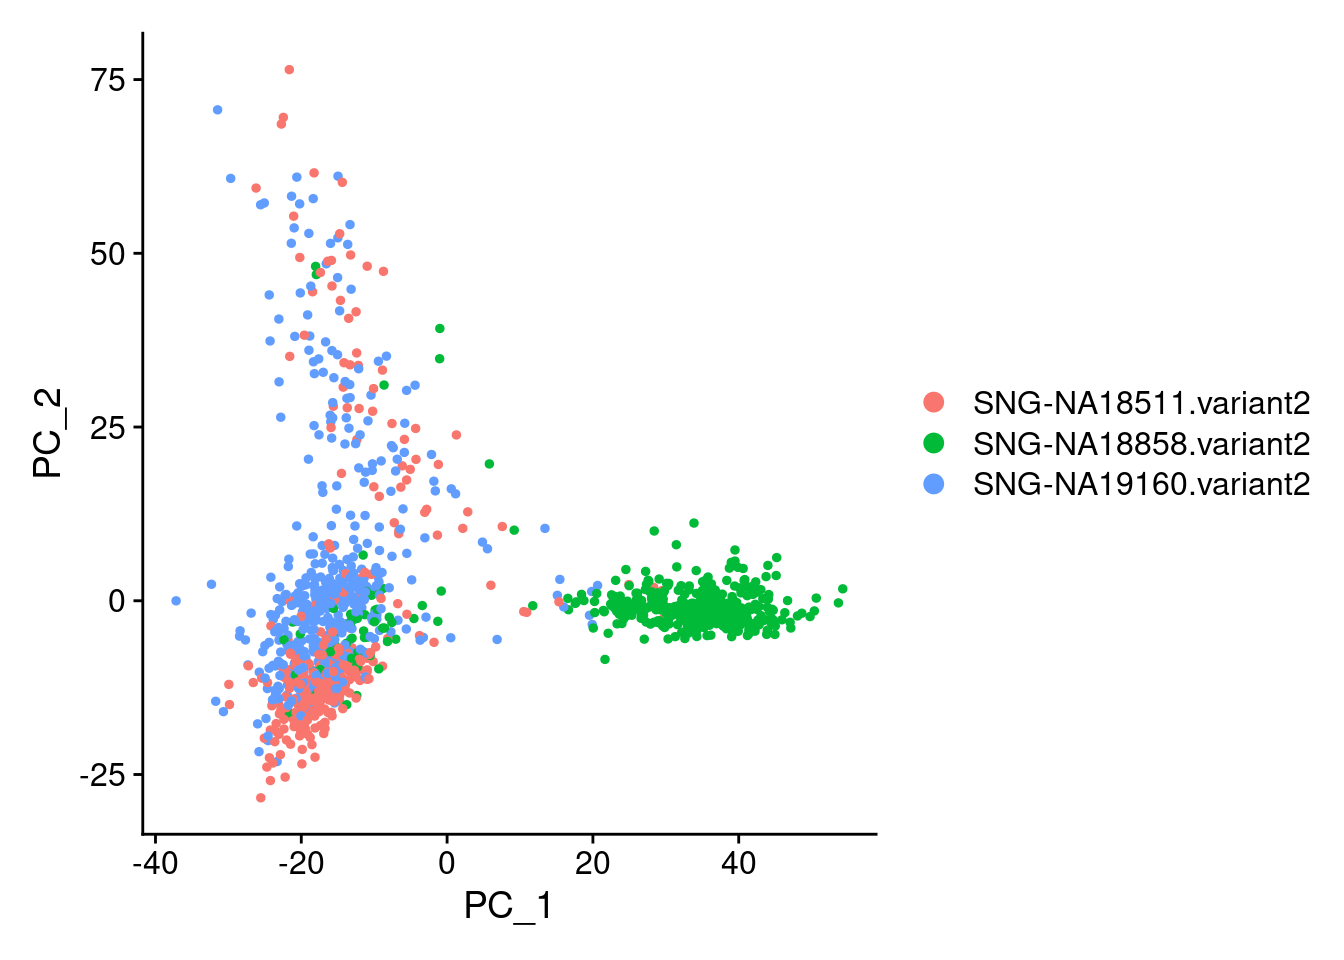
| Version | Author | Date |
|---|---|---|
| 74badaf | KLRhodes | 2020-08-04 |
VizDimLoadings(samp.obj, dims = 1:2, reduction = "pca")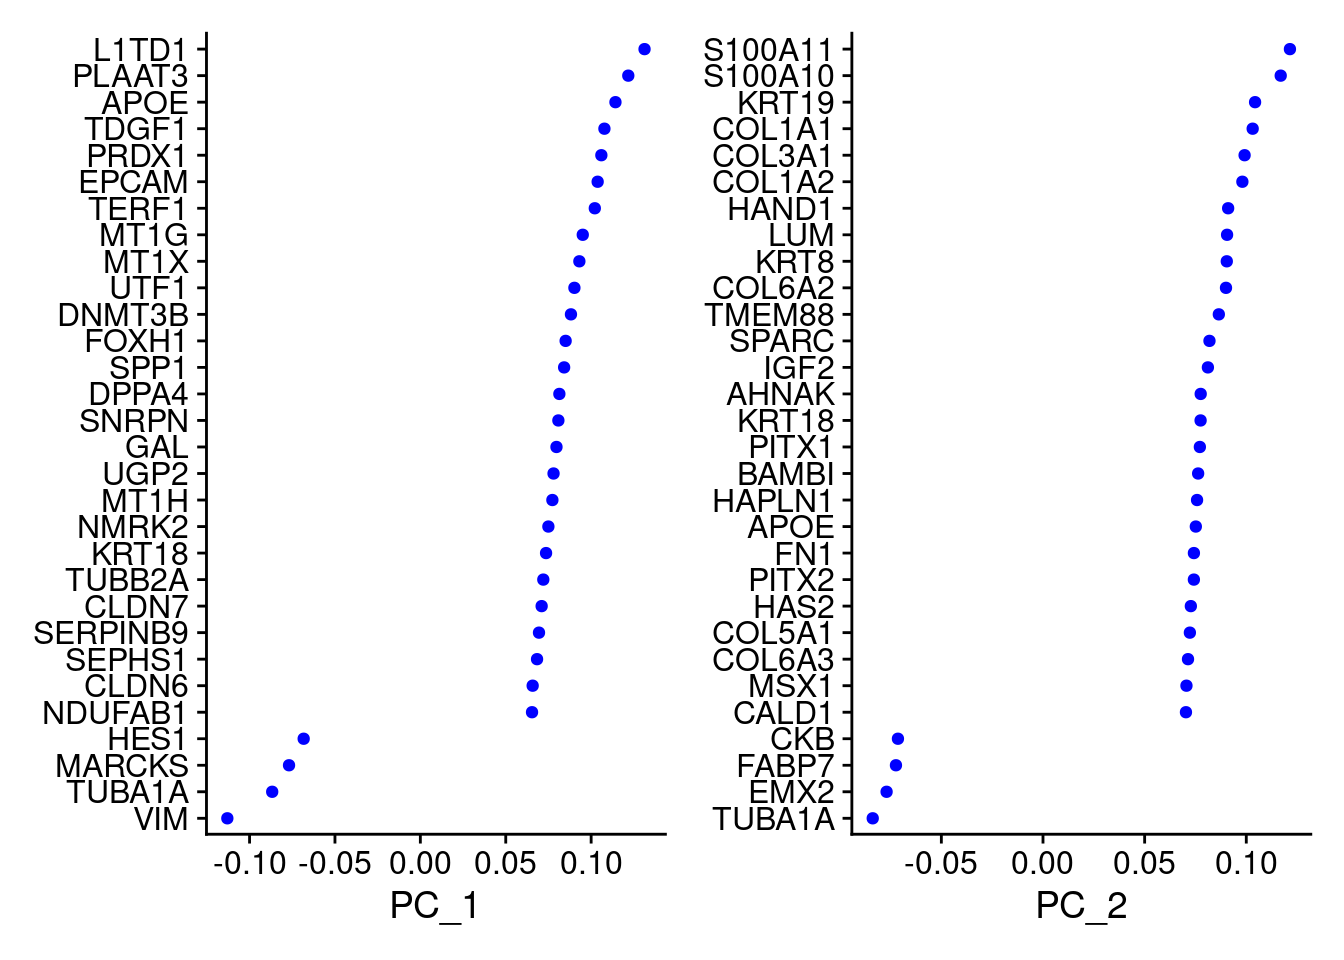
| Version | Author | Date |
|---|---|---|
| 74badaf | KLRhodes | 2020-08-04 |
VizDimLoadings(samp.obj, dims = 3:4, reduction = "pca")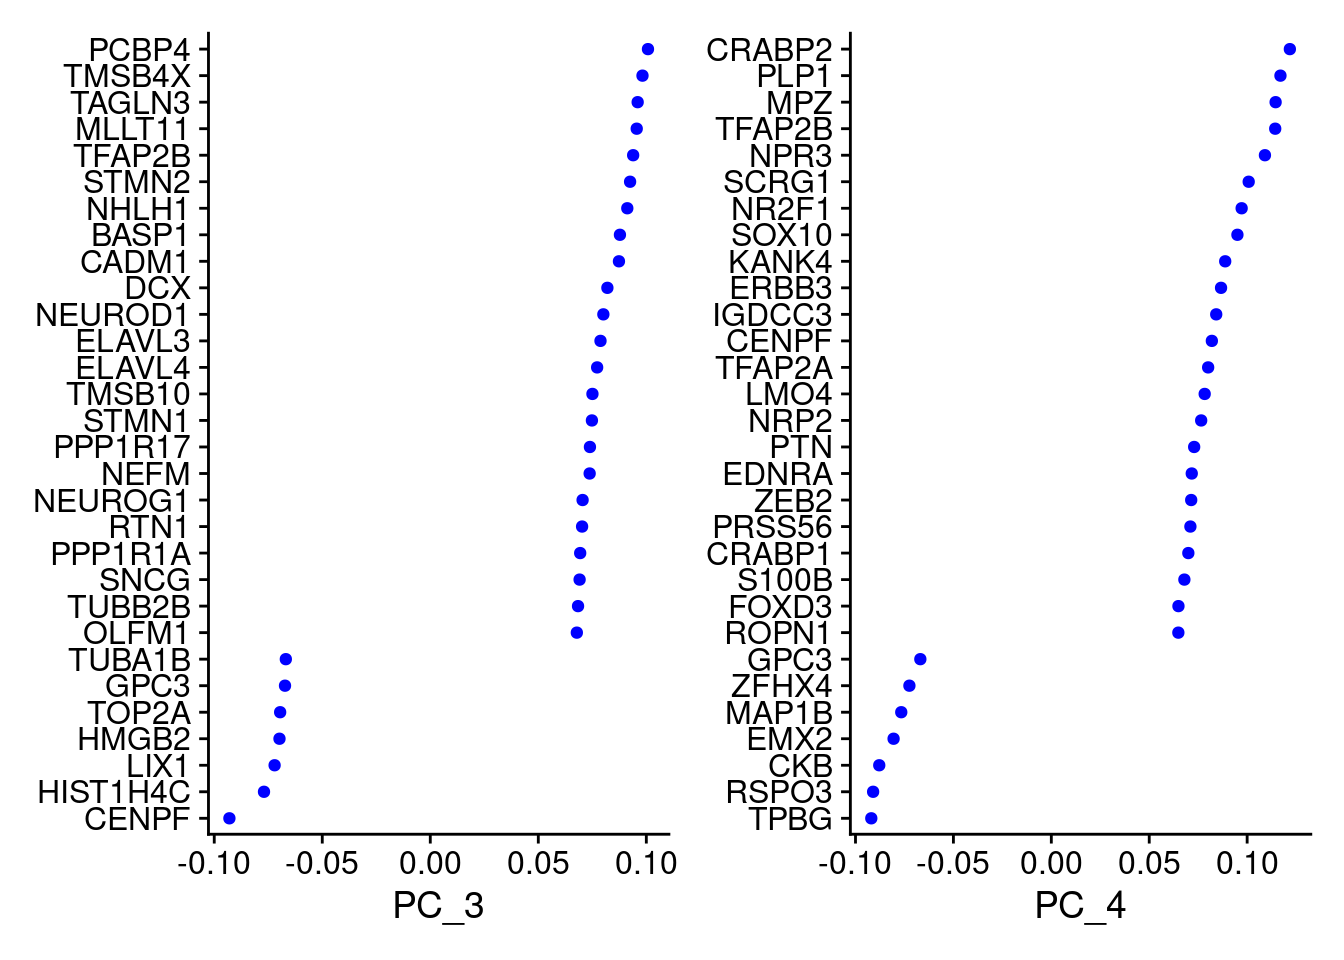
| Version | Author | Date |
|---|---|---|
| 74badaf | KLRhodes | 2020-08-04 |
VizDimLoadings(samp.obj, dims = 5:6, reduction = "pca")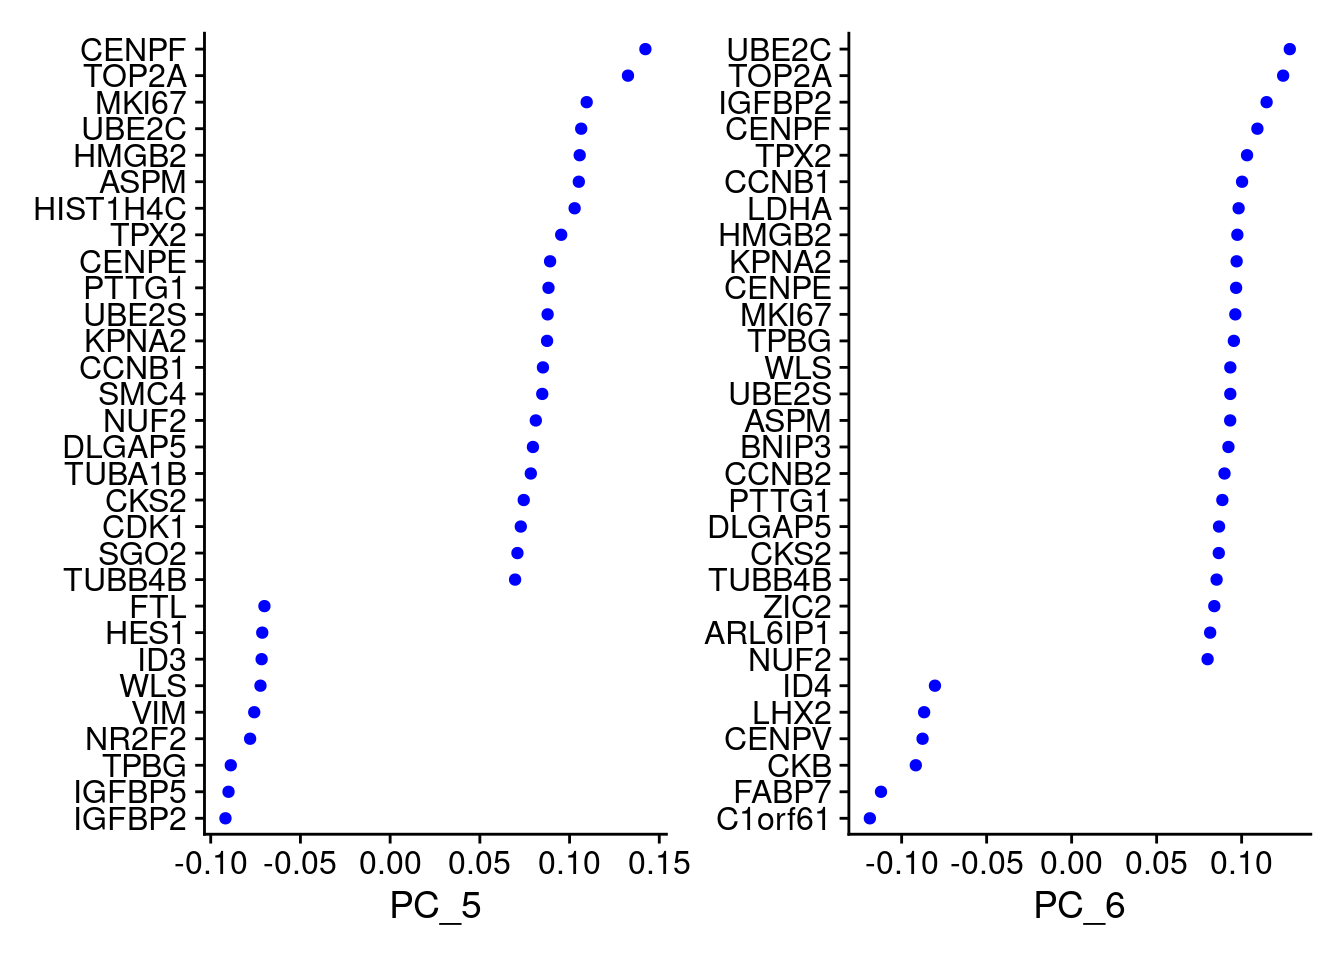
| Version | Author | Date |
|---|---|---|
| 74badaf | KLRhodes | 2020-08-04 |
xlim <- c(min(samp.obj@reductions$pca@cell.embeddings[,'PC_1']),
max(samp.obj@reductions$pca@cell.embeddings[,'PC_1']))
ylim <- c(min(samp.obj@reductions$pca@cell.embeddings[,'PC_2']),
max(samp.obj@reductions$pca@cell.embeddings[,'PC_2']))
individuals <- table(samp.obj$individual)
individuals <- individuals[individuals>50]
individuals <- names(individuals)
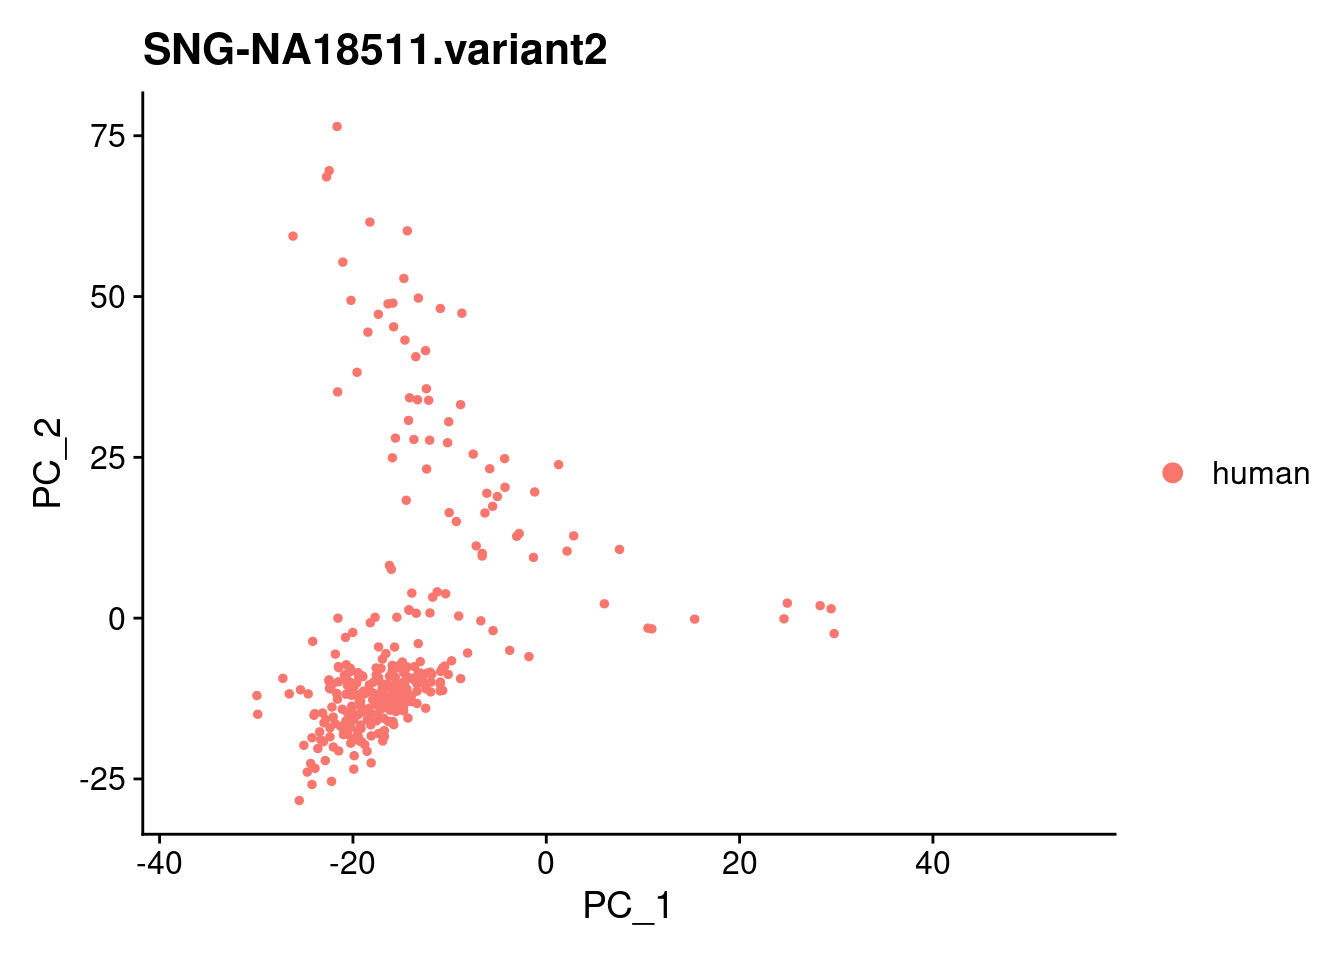
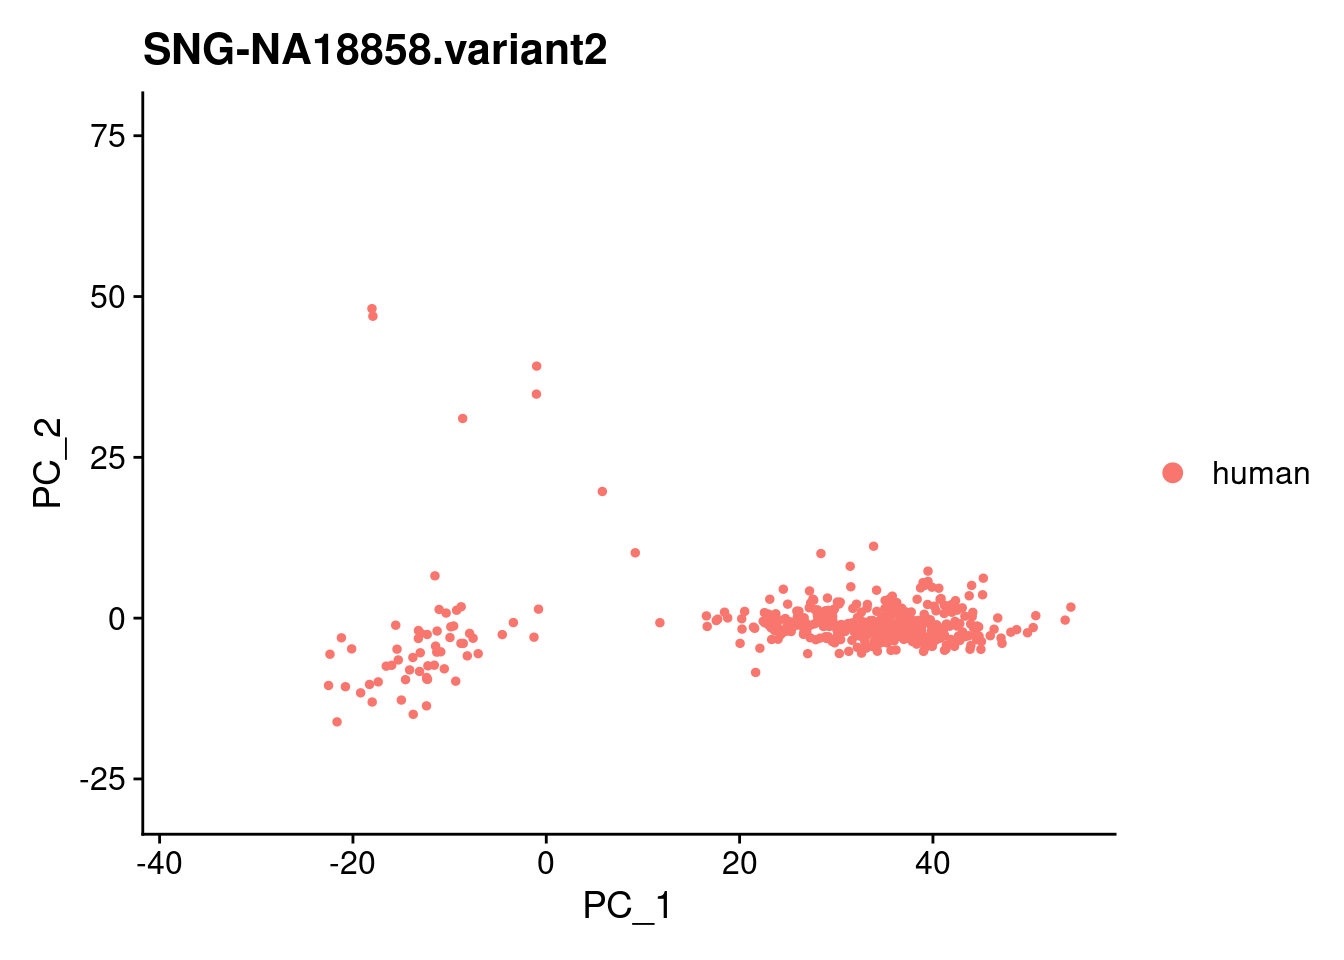
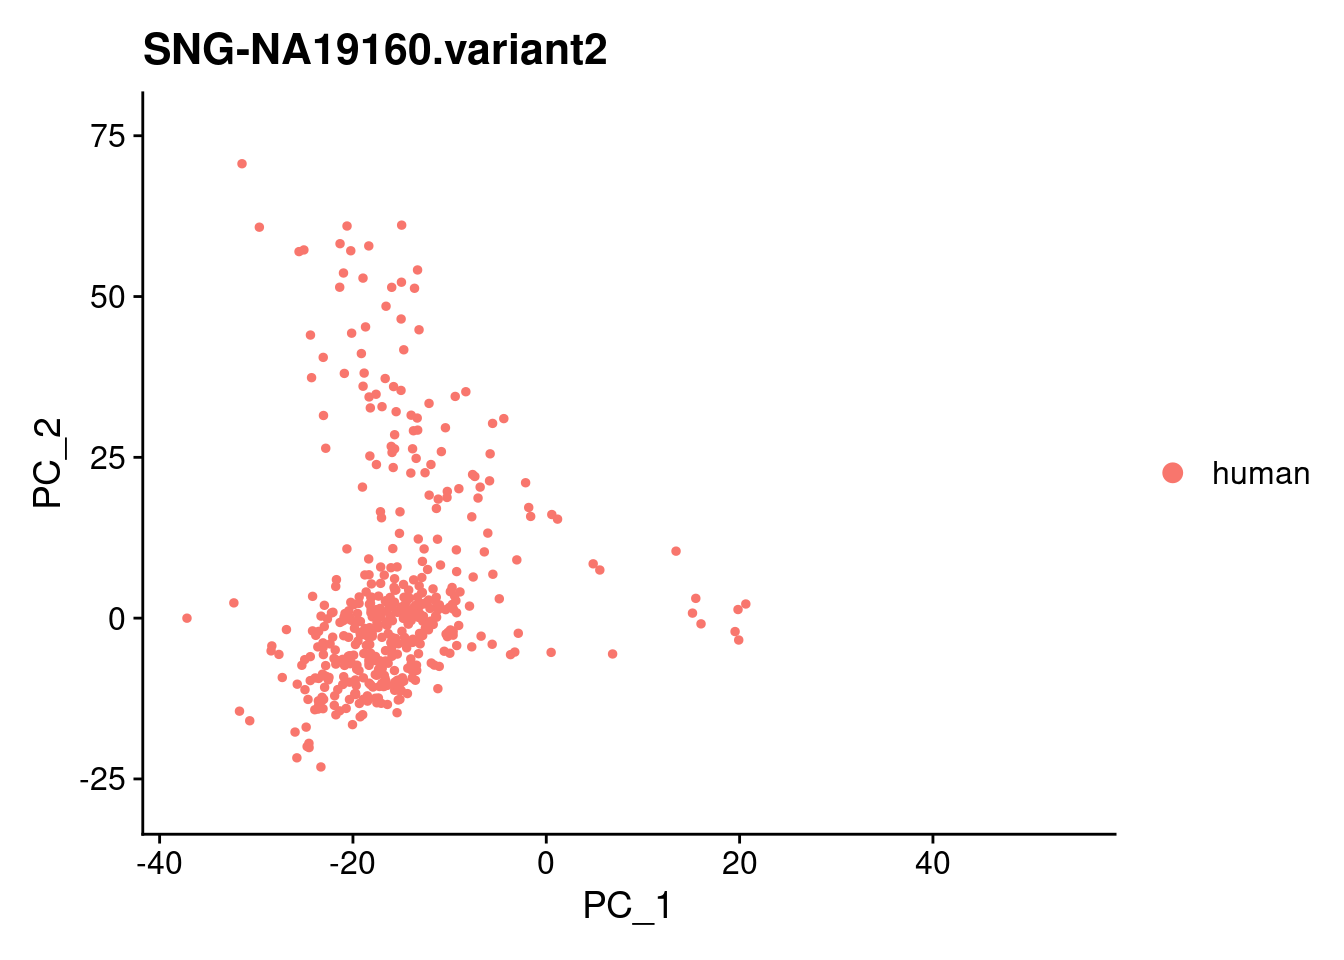
for (i in individuals)
{
print(DimPlot(samp.obj, reduction = "pca",
cells = WhichCells(samp.obj, expression = individual == i)) +
xlim(xlim) + ylim(ylim) + ggtitle(i))
}
| Version | Author | Date |
|---|---|---|
| 74badaf | KLRhodes | 2020-08-04 |
| Version | Author | Date |
|---|---|---|
| 74badaf | KLRhodes | 2020-08-04 |
| Version | Author | Date |
|---|---|---|
| 74badaf | KLRhodes | 2020-08-04 |
#Keep all dims that explain more than 1% of variance
pva<- samp.obj@reductions$pca@stdev^2/samp.obj@reductions$pca@misc$total.variance
ndim <- length(which(pva>=0.01))
ElbowPlot(samp.obj, ndims = ndim*2) + geom_vline(xintercept=ndim, linetype="dashed", color = "red")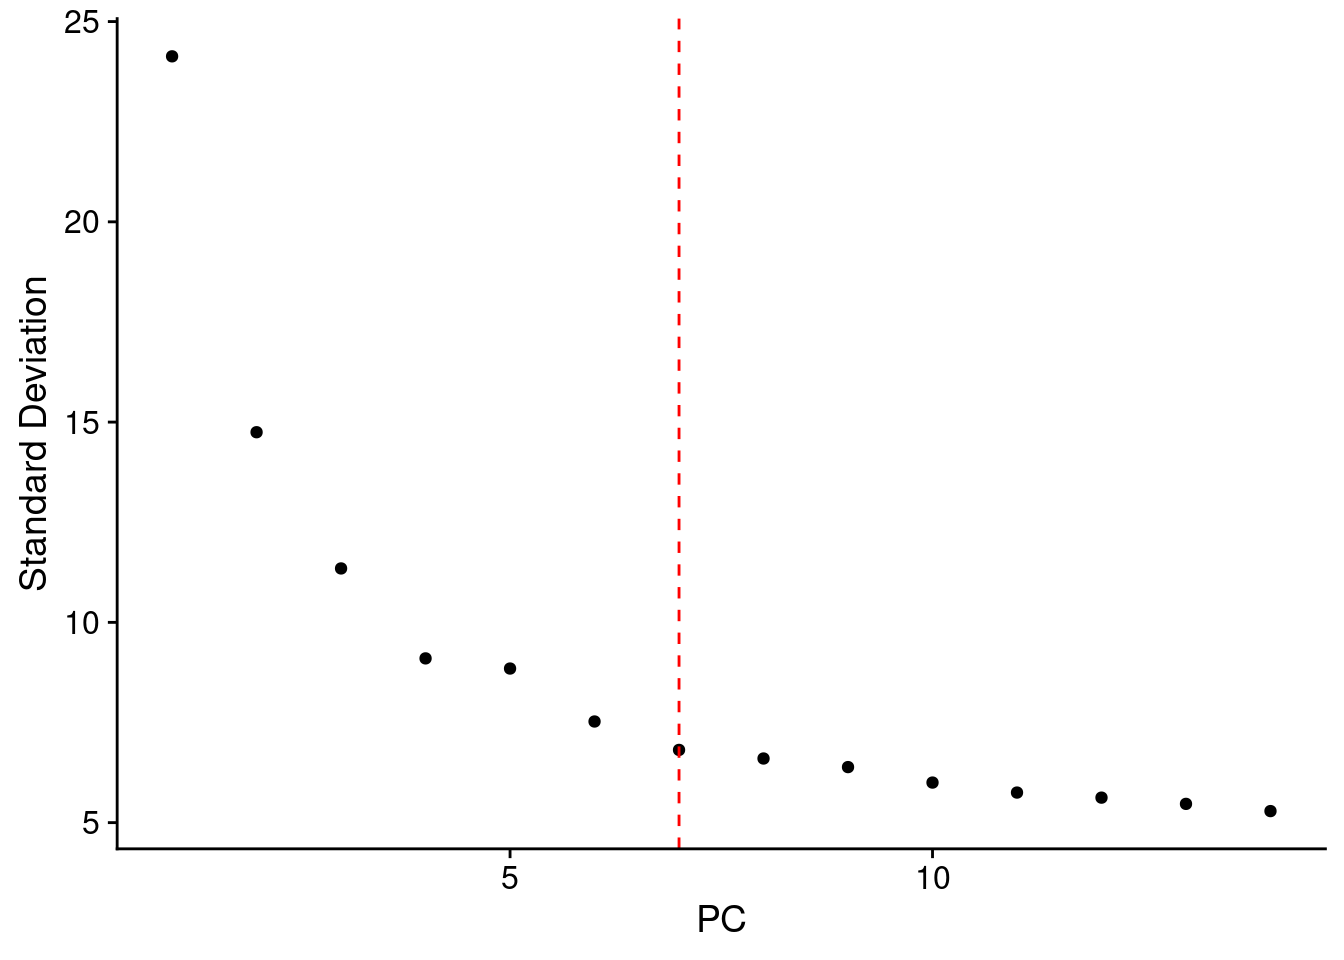
ndim[1] 7samp.clust<- FindNeighbors(samp.obj, dims = 1:ndim, verbose = F)
samp.clust<- FindClusters(samp.clust, verbose = F)samp.clust<- RunUMAP(samp.clust, dims=1:ndim, verbose = F)Warning: The default method for RunUMAP has changed from calling Python UMAP via reticulate to the R-native UWOT using the cosine metric
To use Python UMAP via reticulate, set umap.method to 'umap-learn' and metric to 'correlation'
This message will be shown once per sessionsamp.clust<- RunTSNE(samp.clust, dims=1:ndim, verbose = F)DimPlot(samp.clust, reduction = "umap")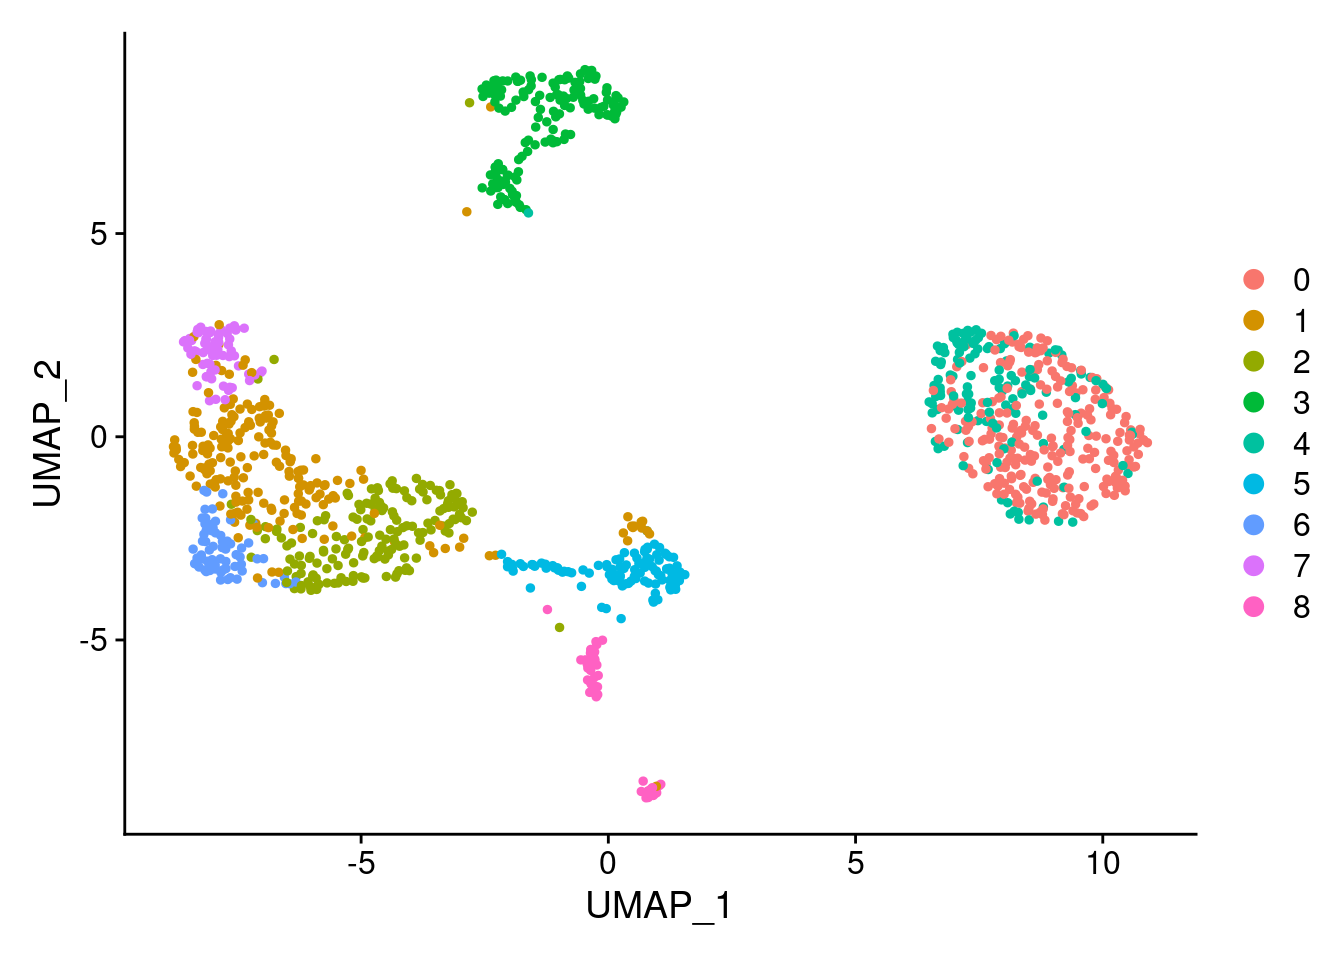
| Version | Author | Date |
|---|---|---|
| 74badaf | KLRhodes | 2020-08-04 |
DimPlot(samp.clust, reduction = "umap", group.by = "orig.ident")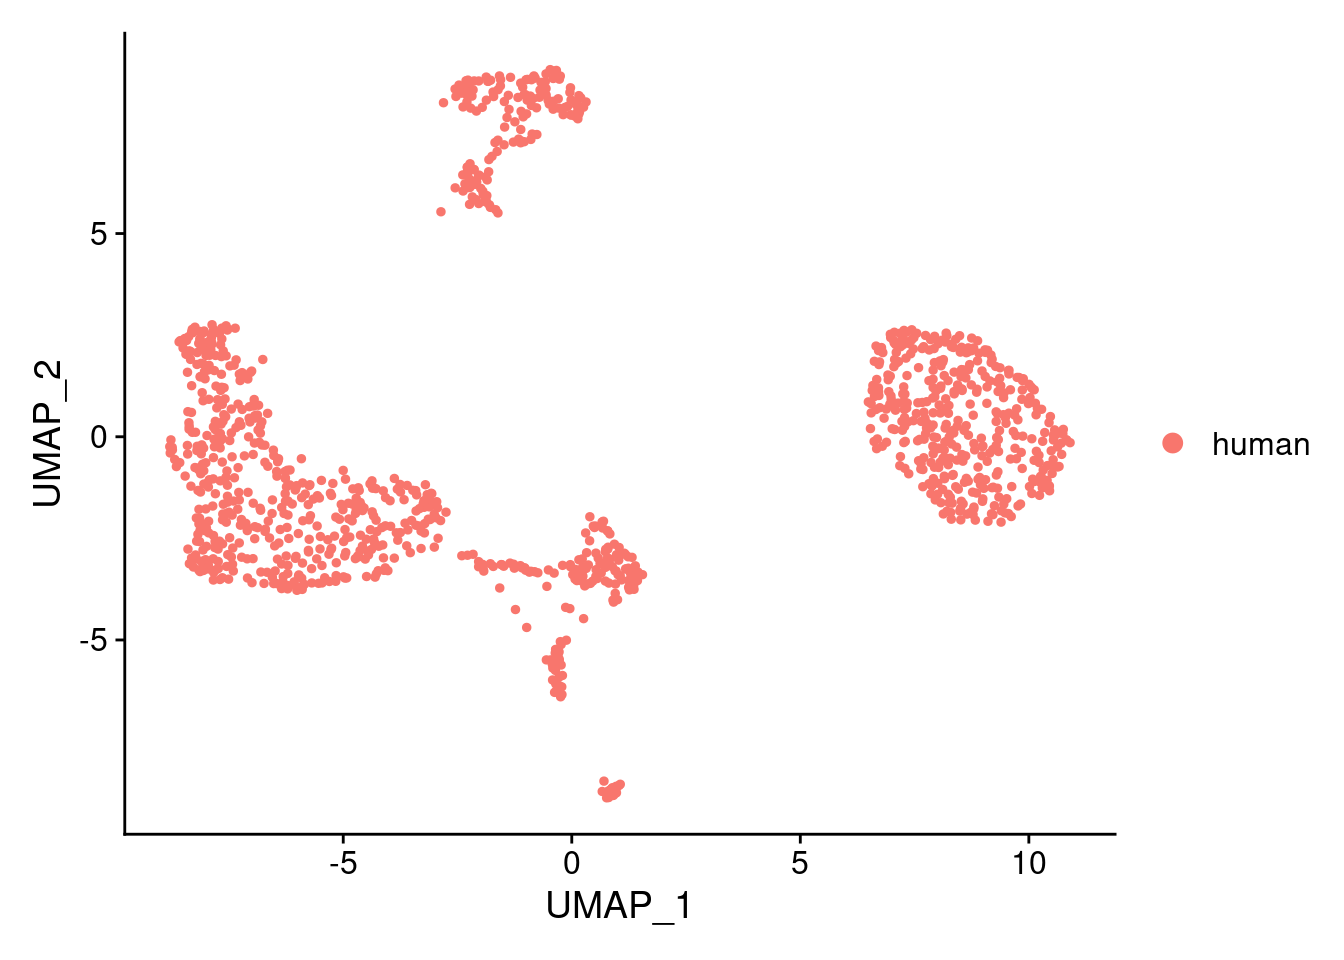
| Version | Author | Date |
|---|---|---|
| 74badaf | KLRhodes | 2020-08-04 |
DimPlot(samp.clust, reduction = "umap", group.by = "individual")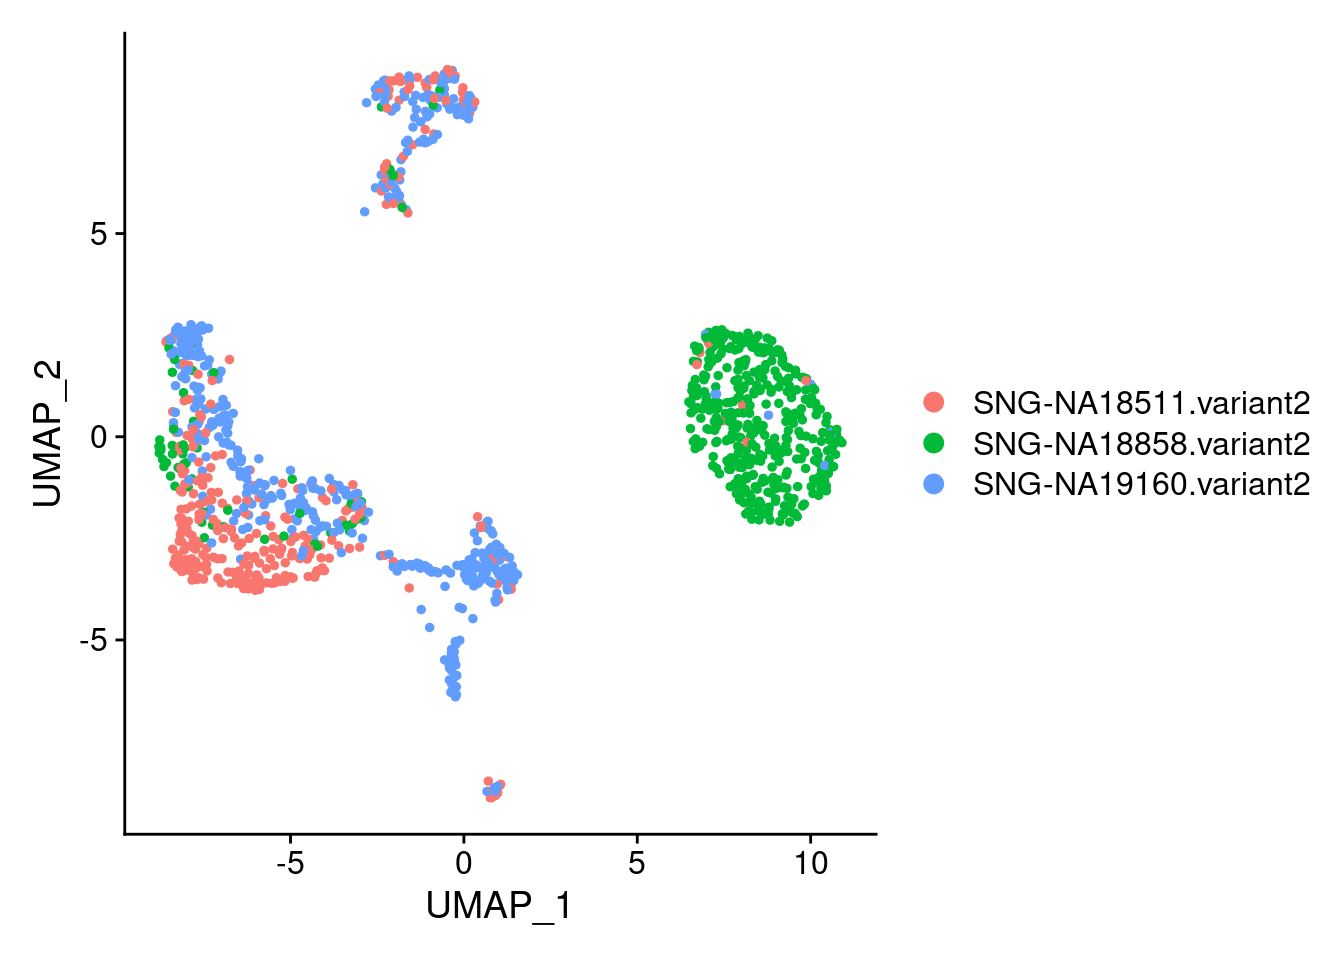
| Version | Author | Date |
|---|---|---|
| 74badaf | KLRhodes | 2020-08-04 |
xlim <- c(min(samp.clust@reductions$umap@cell.embeddings[,'UMAP_1']),
max(samp.clust@reductions$umap@cell.embeddings[,'UMAP_1']))
ylim <- c(min(samp.clust@reductions$umap@cell.embeddings[,'UMAP_2']),
max(samp.clust@reductions$umap@cell.embeddings[,'UMAP_2']))
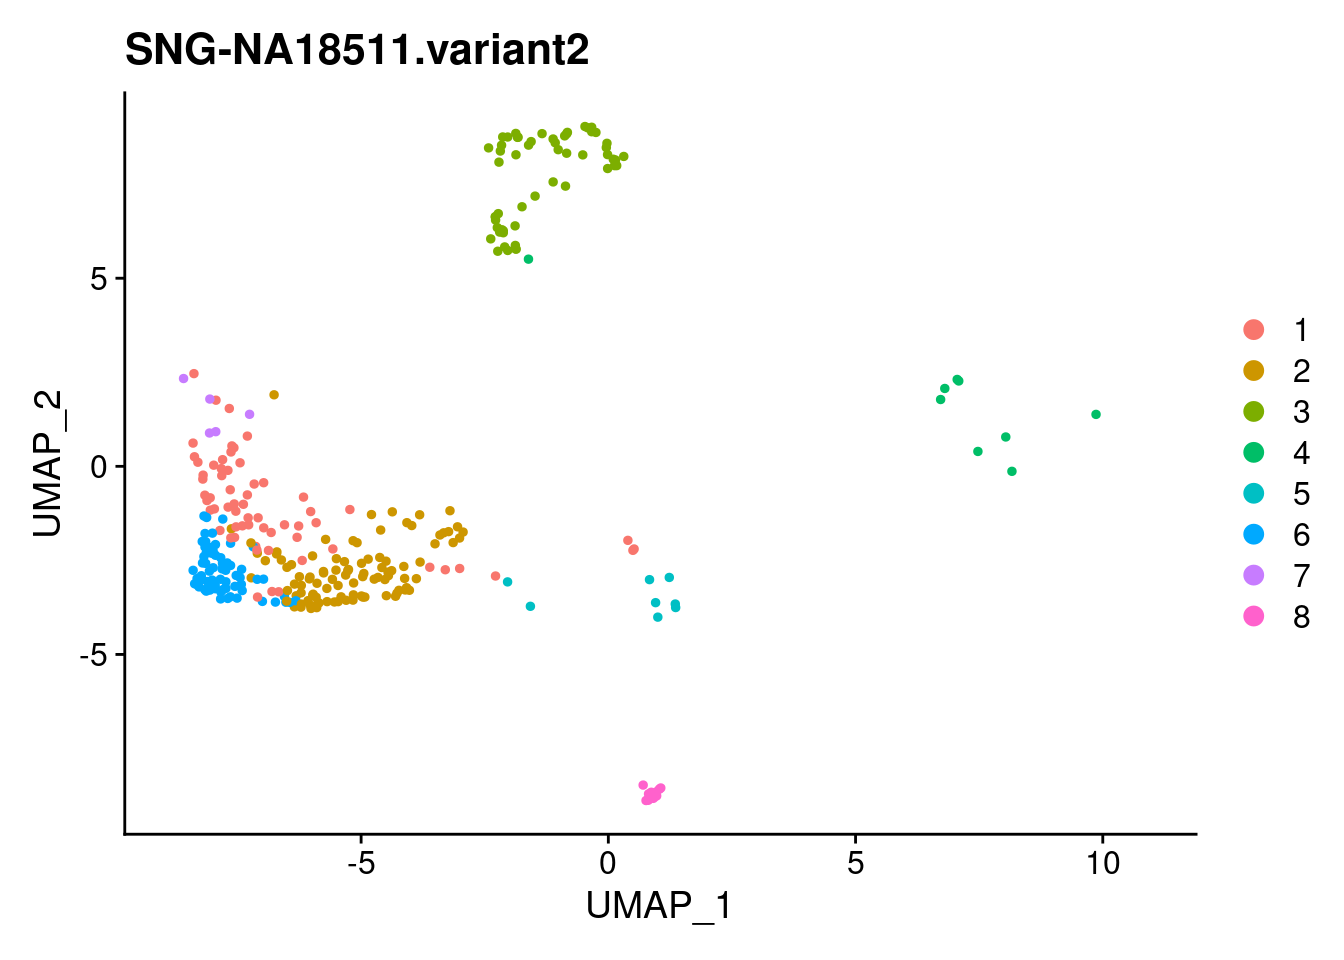
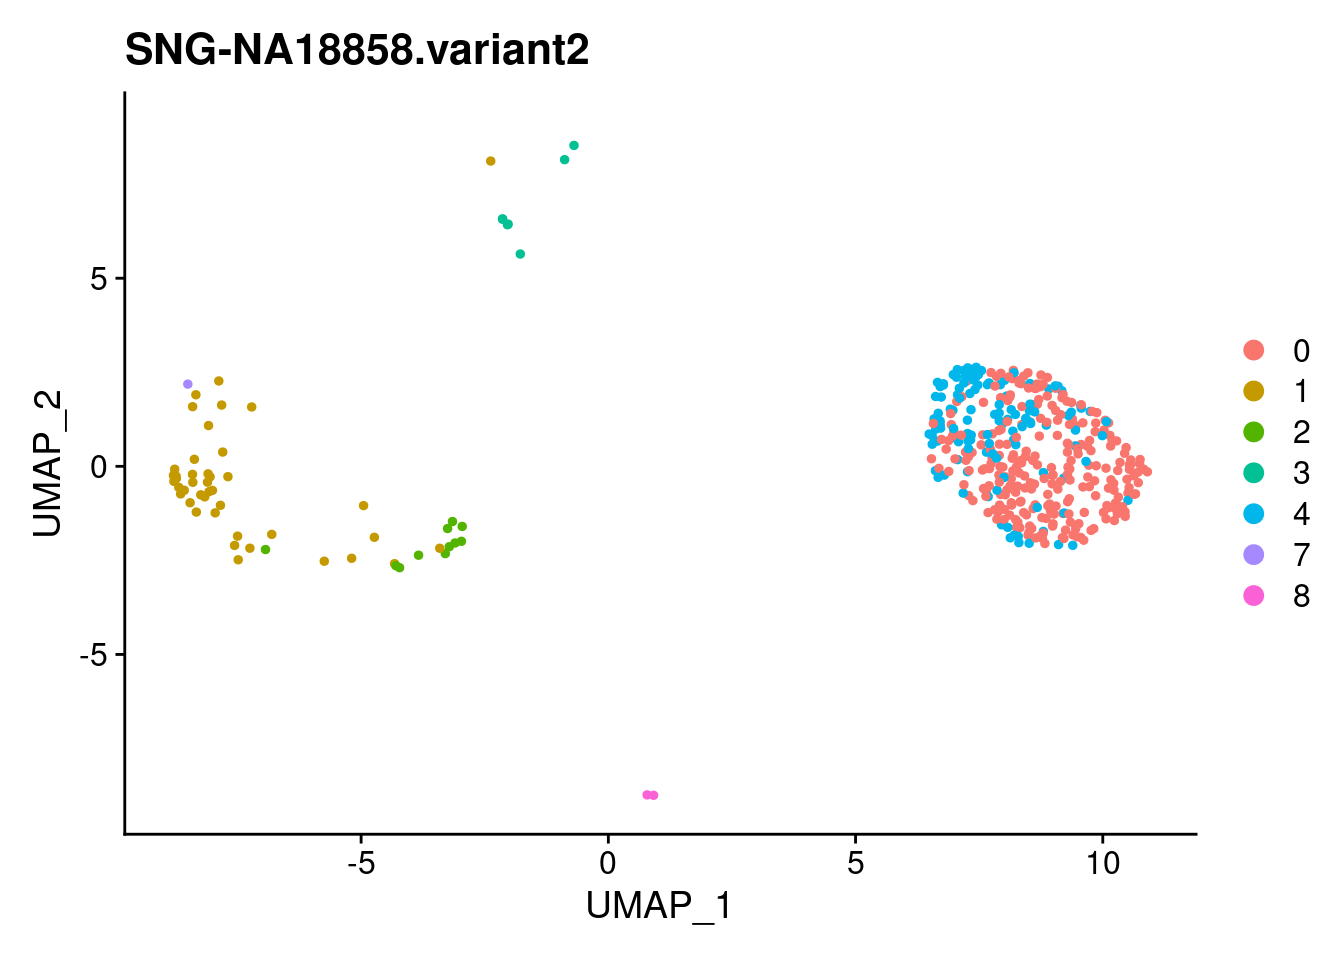
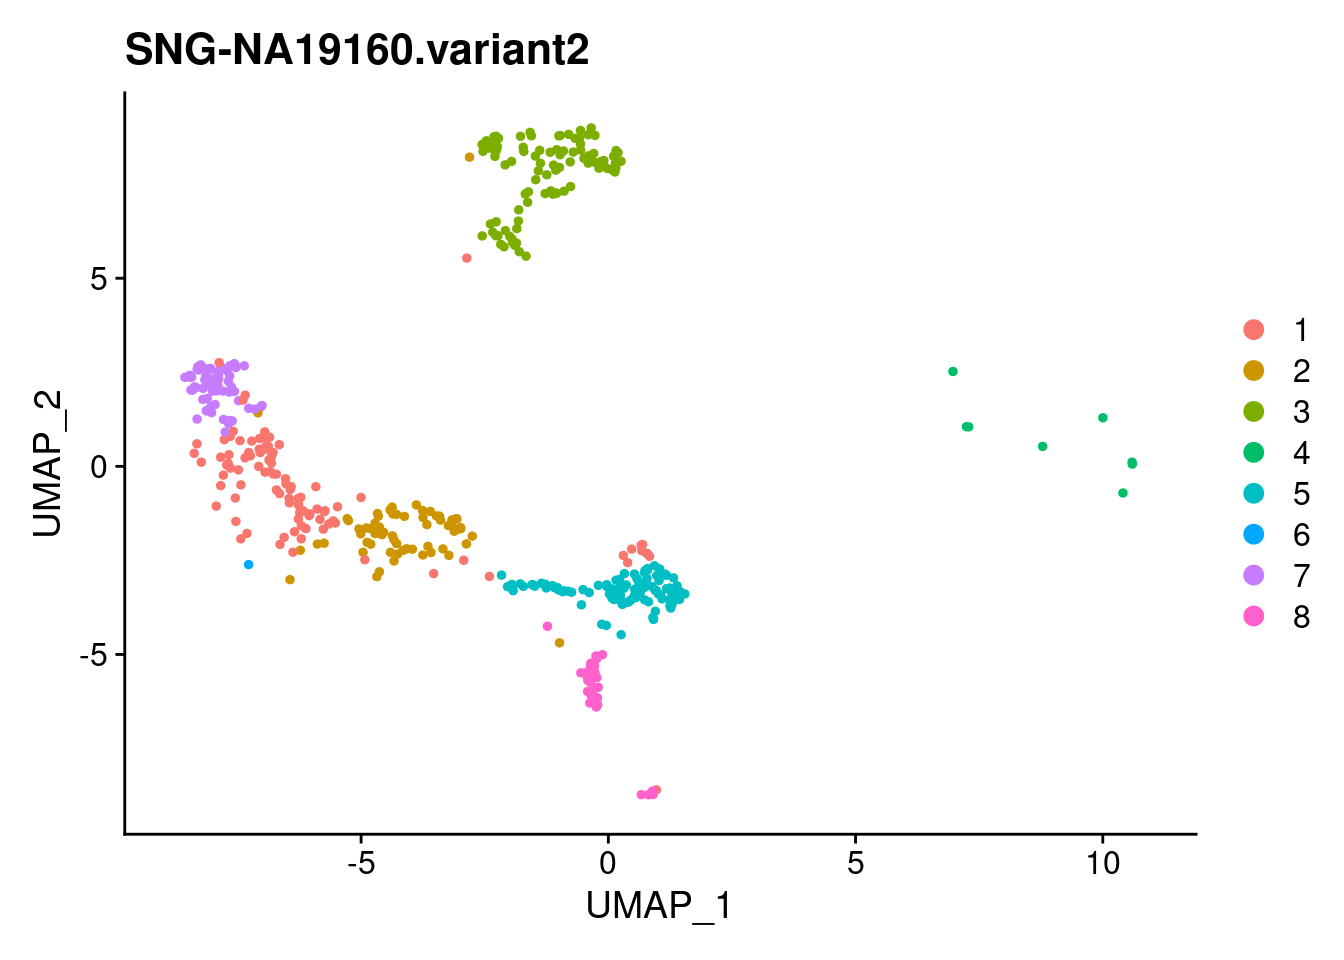
for (i in individuals)
{
print(DimPlot(samp.clust, reduction = "umap",
cells = WhichCells(samp.clust, expression = individual == i)) +
xlim(xlim) + ylim(ylim) + ggtitle(i))
}
| Version | Author | Date |
|---|---|---|
| 74badaf | KLRhodes | 2020-08-04 |
| Version | Author | Date |
|---|---|---|
| 74badaf | KLRhodes | 2020-08-04 |
| Version | Author | Date |
|---|---|---|
| 74badaf | KLRhodes | 2020-08-04 |
FeaturePlot(samp.clust, features = c("POU5F1", "PAX6", "HAND1", "SOX17"), pt.size = 0.2, ncol=3)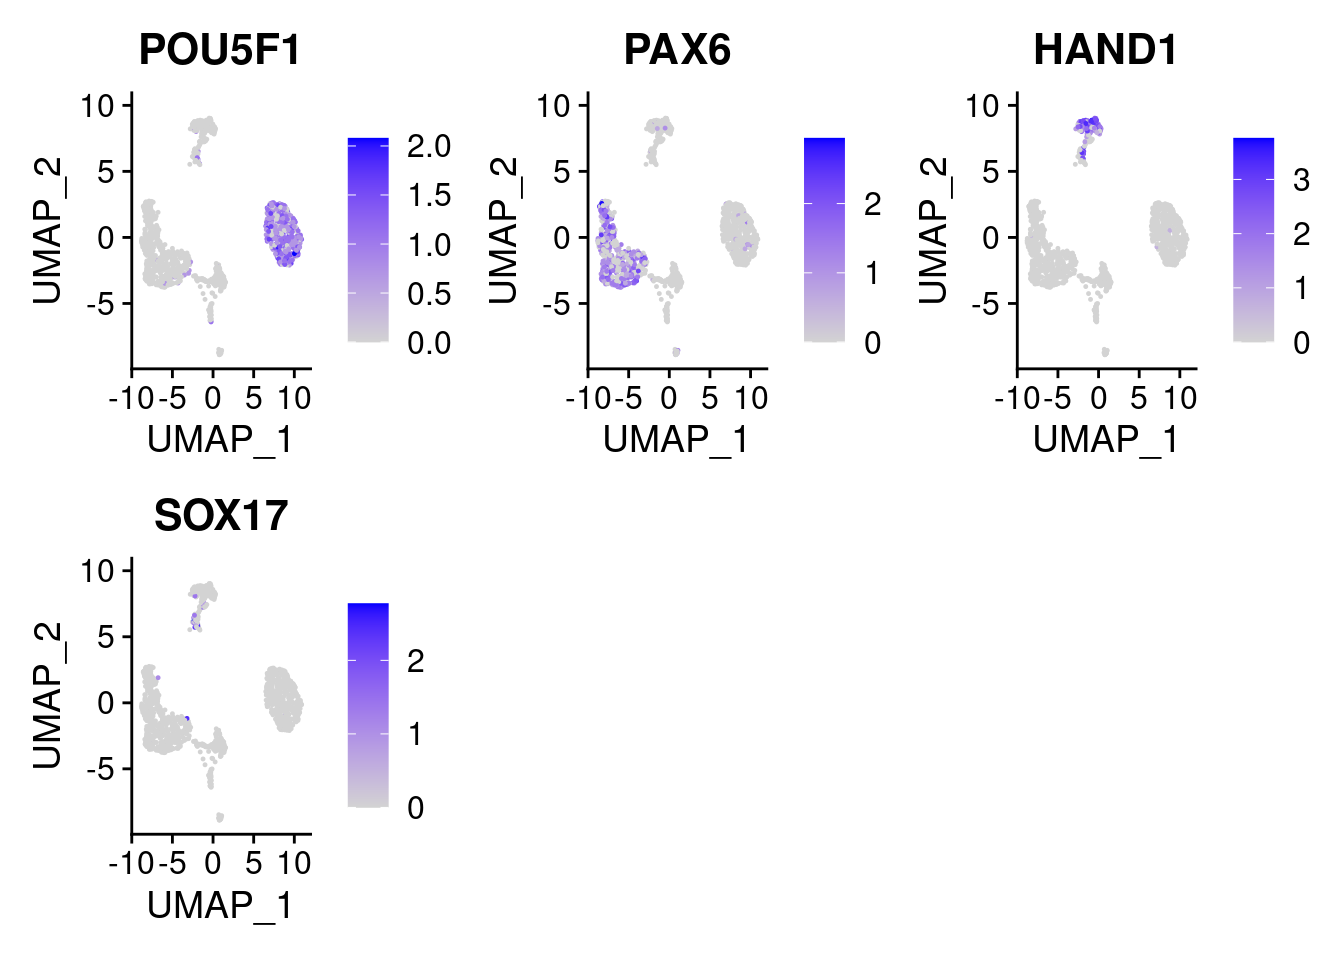
| Version | Author | Date |
|---|---|---|
| 74badaf | KLRhodes | 2020-08-04 |
above shows the expression of marker genes in UMAP space. POU5F1- pluripotent marker SOX17- endoderm marker HAND1- mesoderm marker PAX6- early ectoderm marker
DimPlot(samp.clust, reduction = "tsne")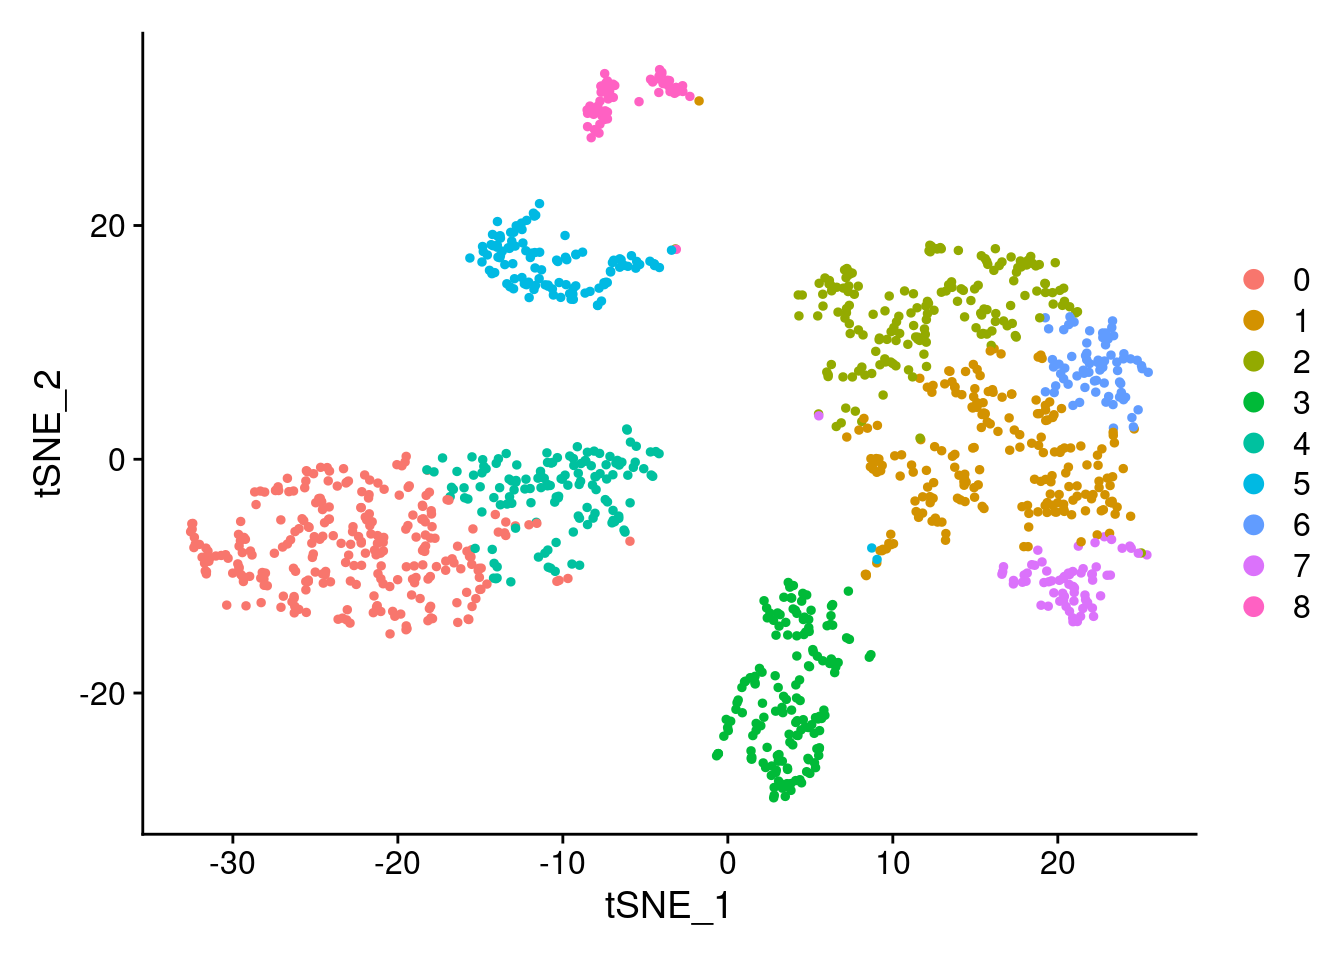
DimPlot(samp.clust, reduction = "tsne", group.by = "orig.ident")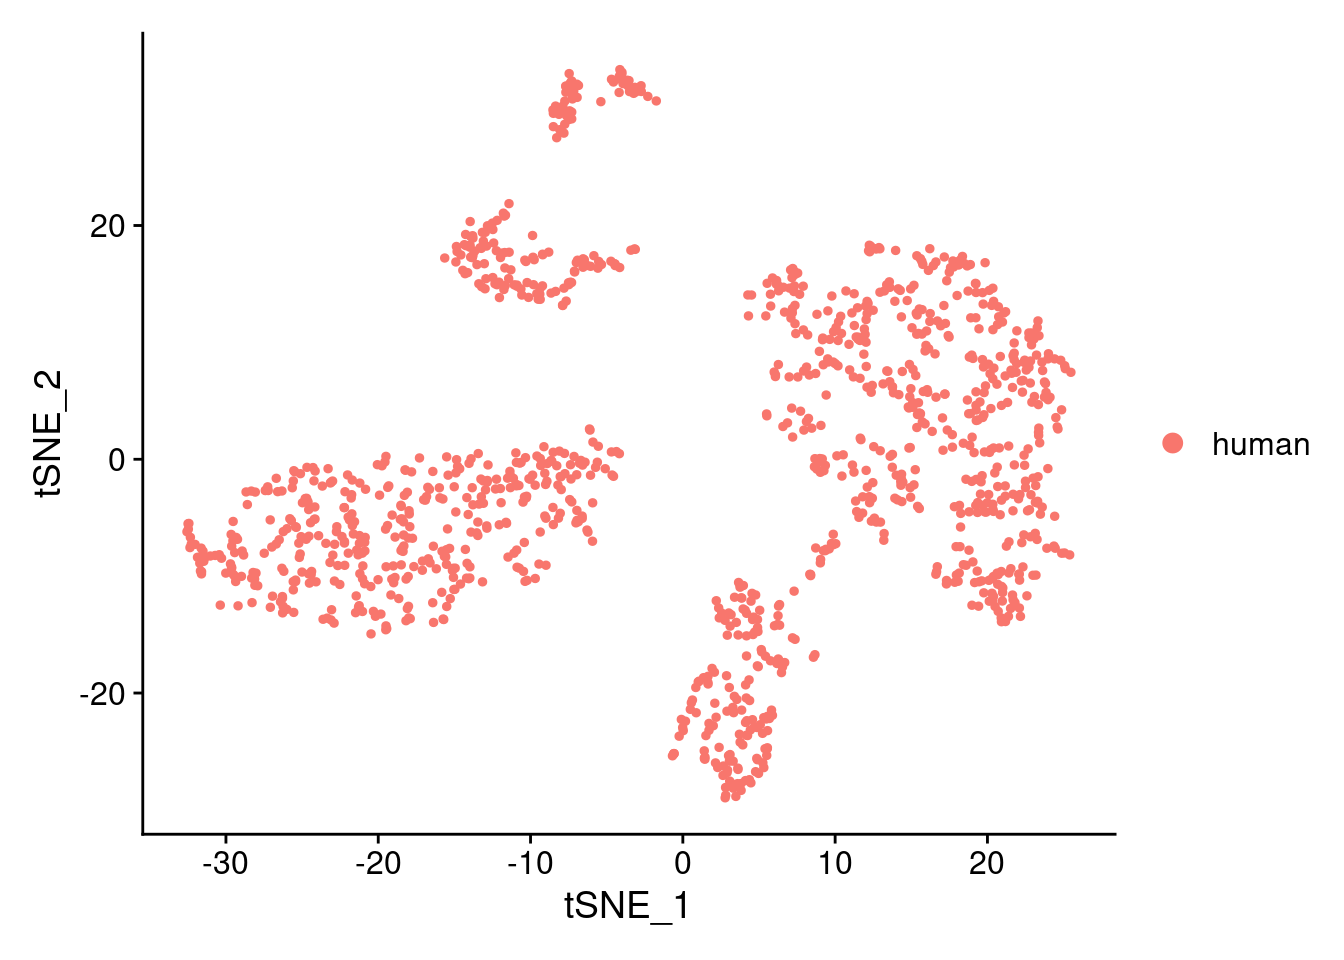
DimPlot(samp.clust, reduction = "tsne", group.by = "individual")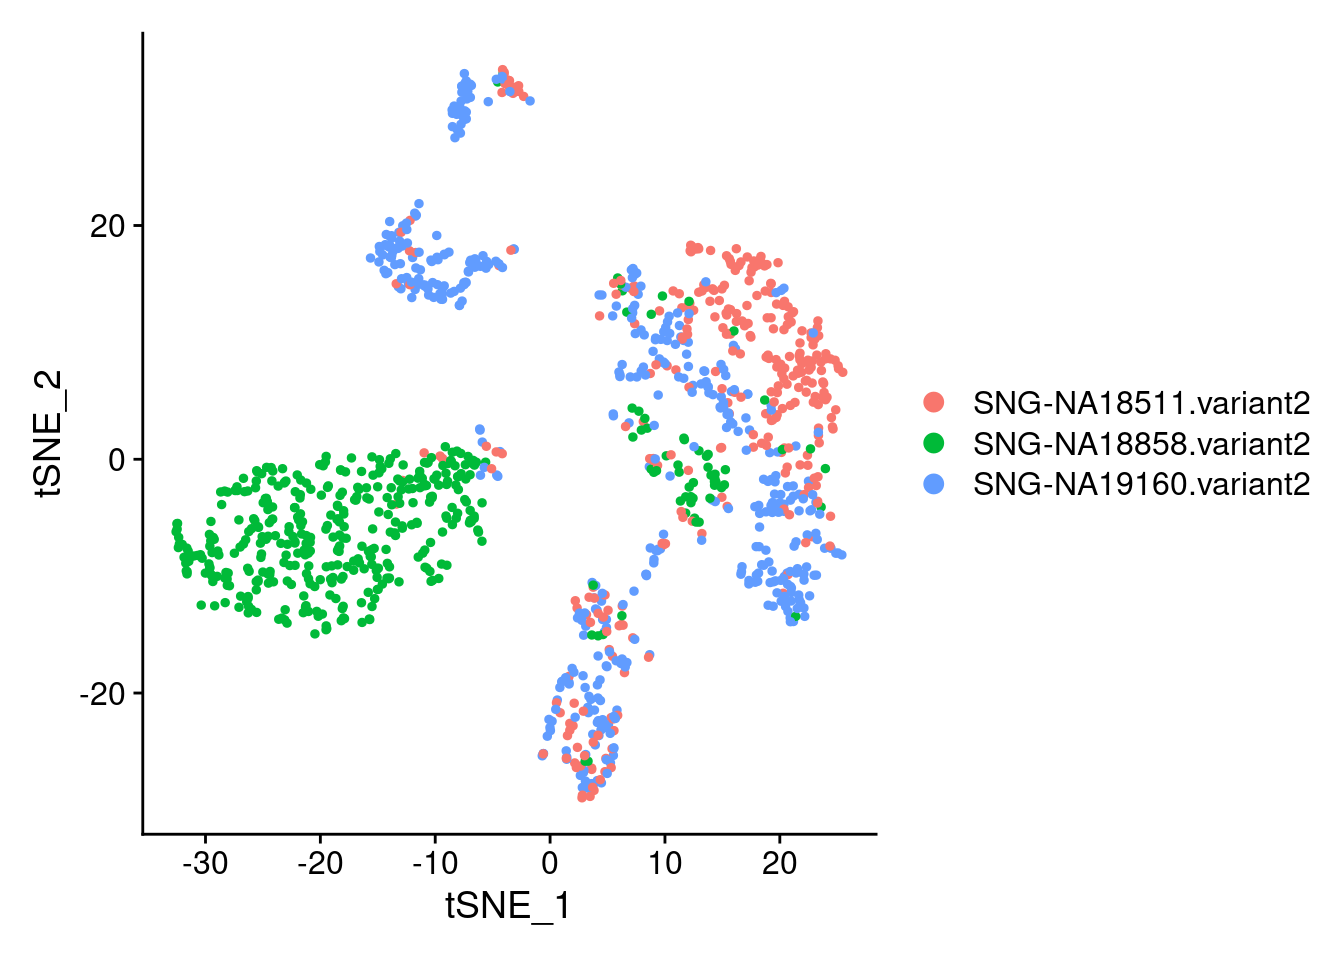
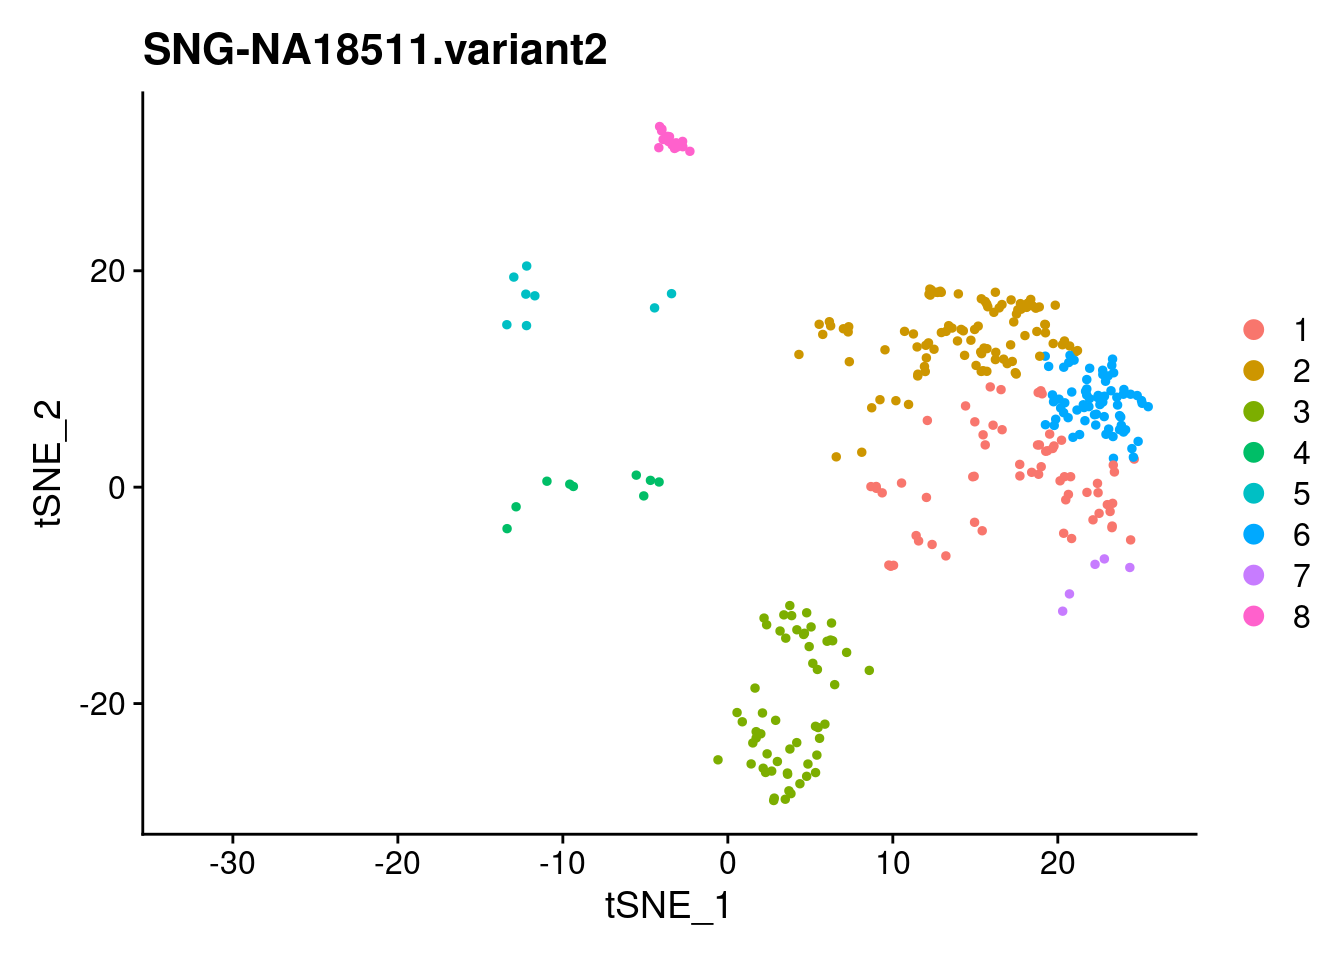
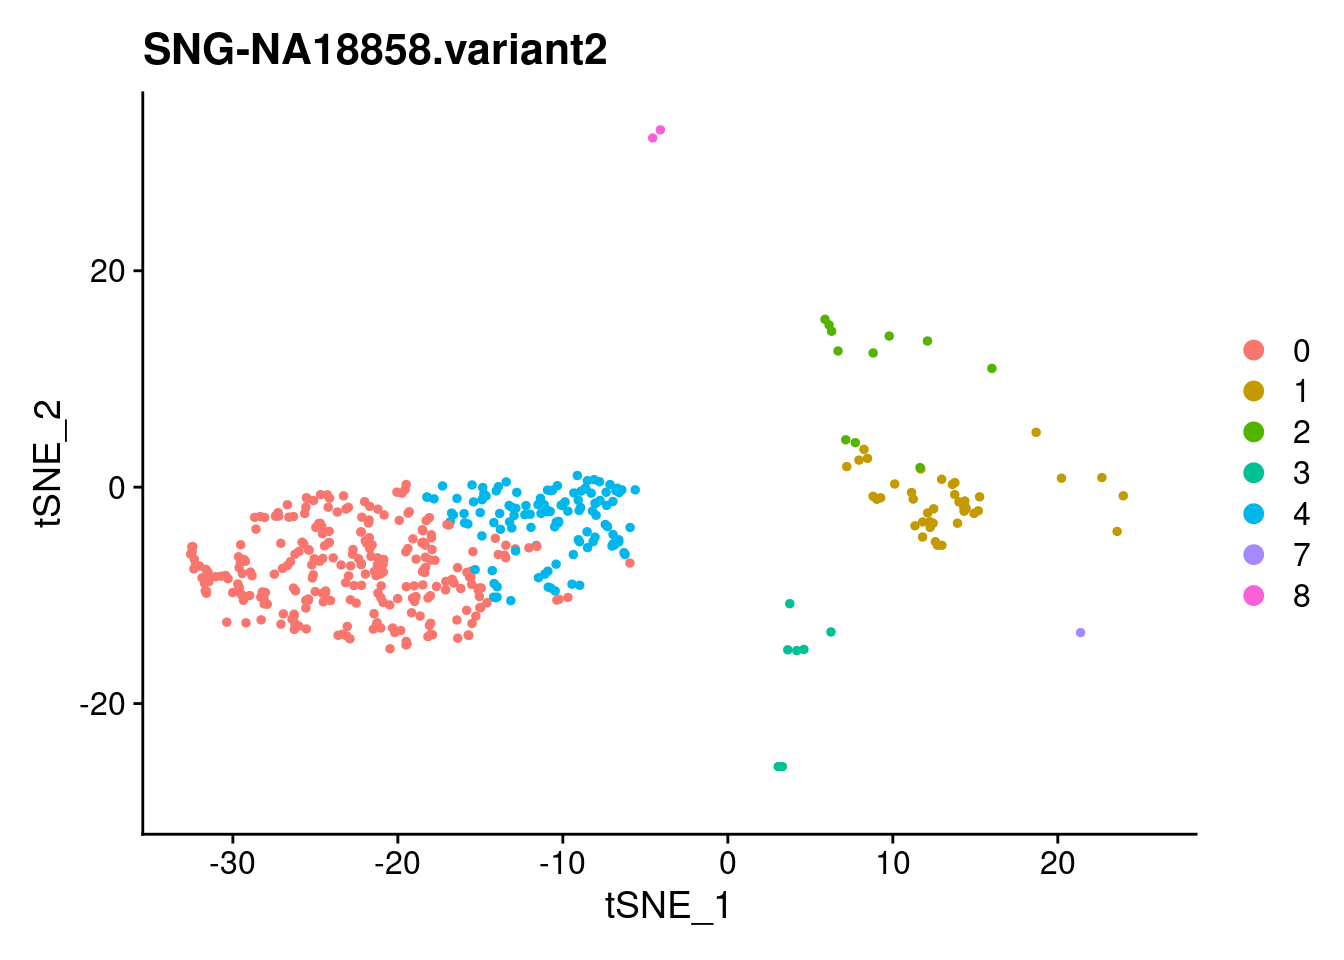
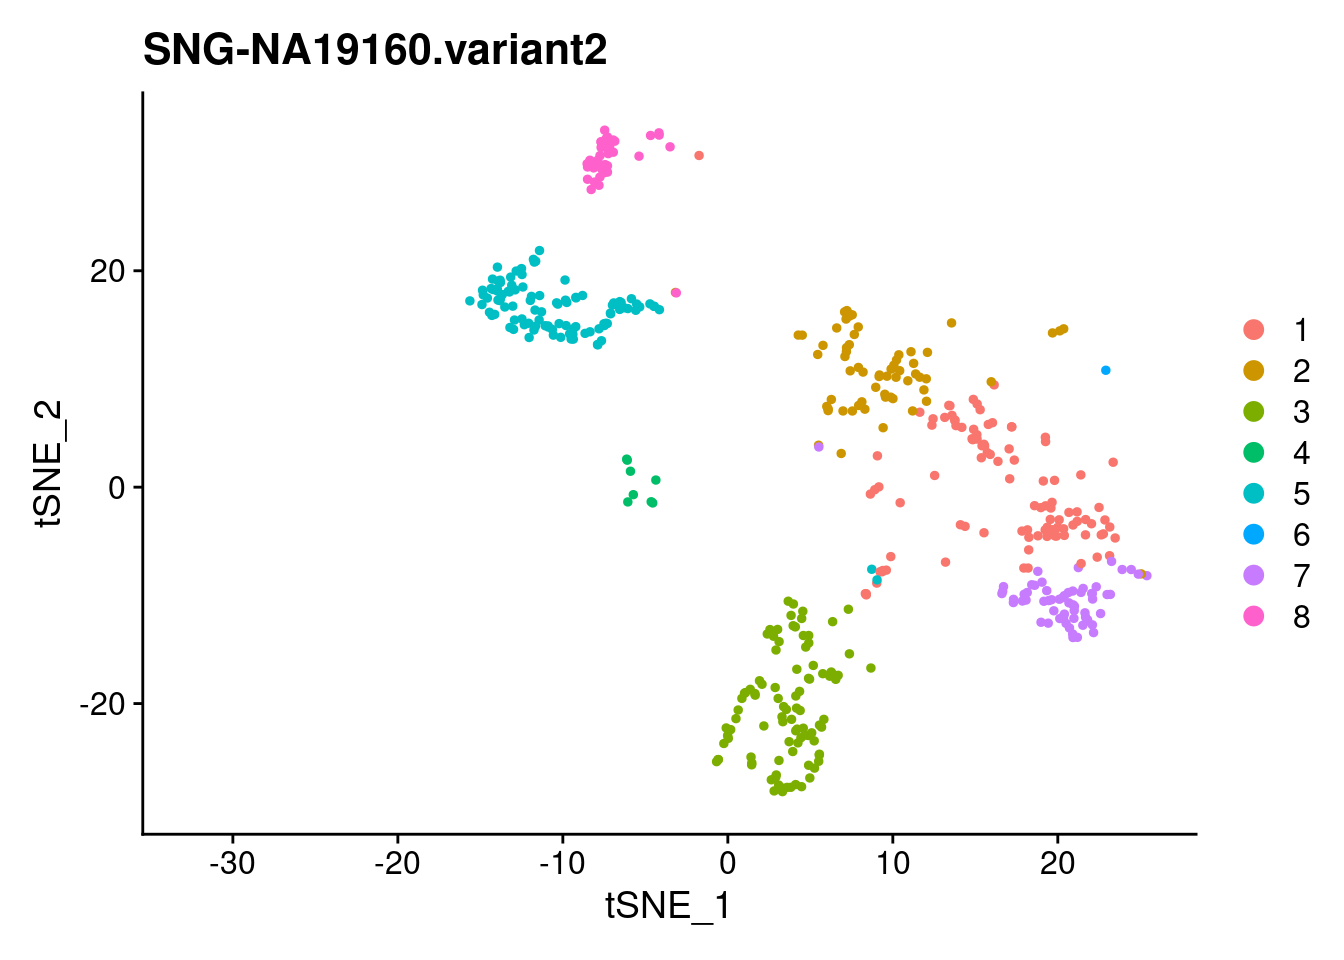
xlim <- c(min(samp.clust@reductions$tsne@cell.embeddings[,'tSNE_1']),
          max(samp.clust@reductions$tsne@cell.embeddings[,'tSNE_1']))
ylim <- c(min(samp.clust@reductions$tsne@cell.embeddings[,'tSNE_2']),
          max(samp.clust@reductions$tsne@cell.embeddings[,'tSNE_2']))
for (i in individuals)
{
  print(DimPlot(samp.clust, reduction = "tsne",
                cells = WhichCells(samp.clust, expression = individual == i)) +
          xlim(xlim) + ylim(ylim) + ggtitle(i))
}
samp<- samp.clust@meta.data$SampleID[1]
path<- here::here("output/sampleQCrds/")
saveRDS(samp.clust, file=paste0(path,samp,'.seurat.rds'))
FeaturePlot(samp.clust, features = "nFeature_RNA")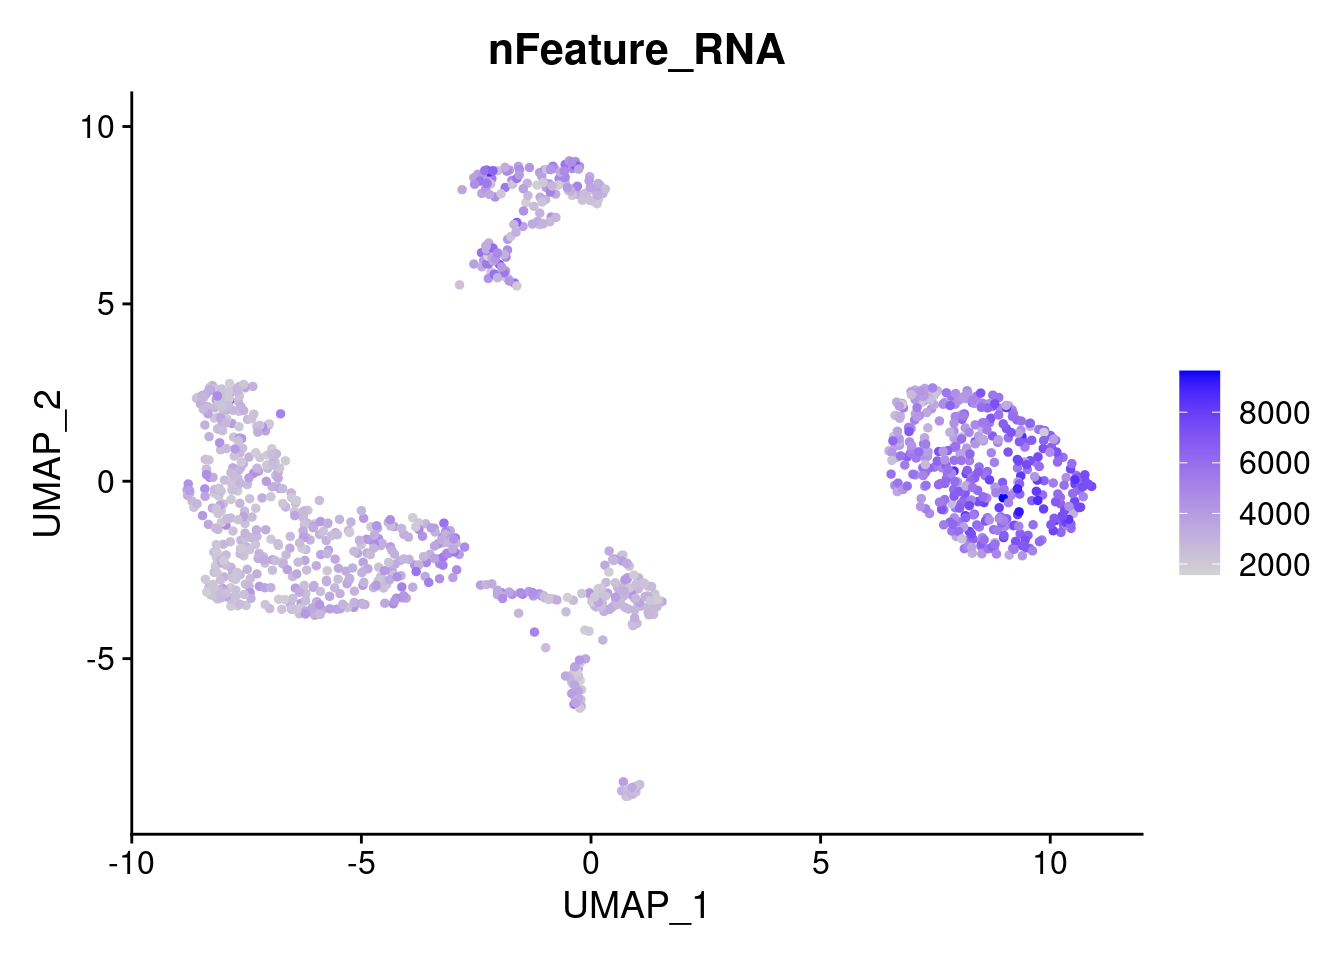
FeaturePlot(samp.clust, features = "nCount_RNA")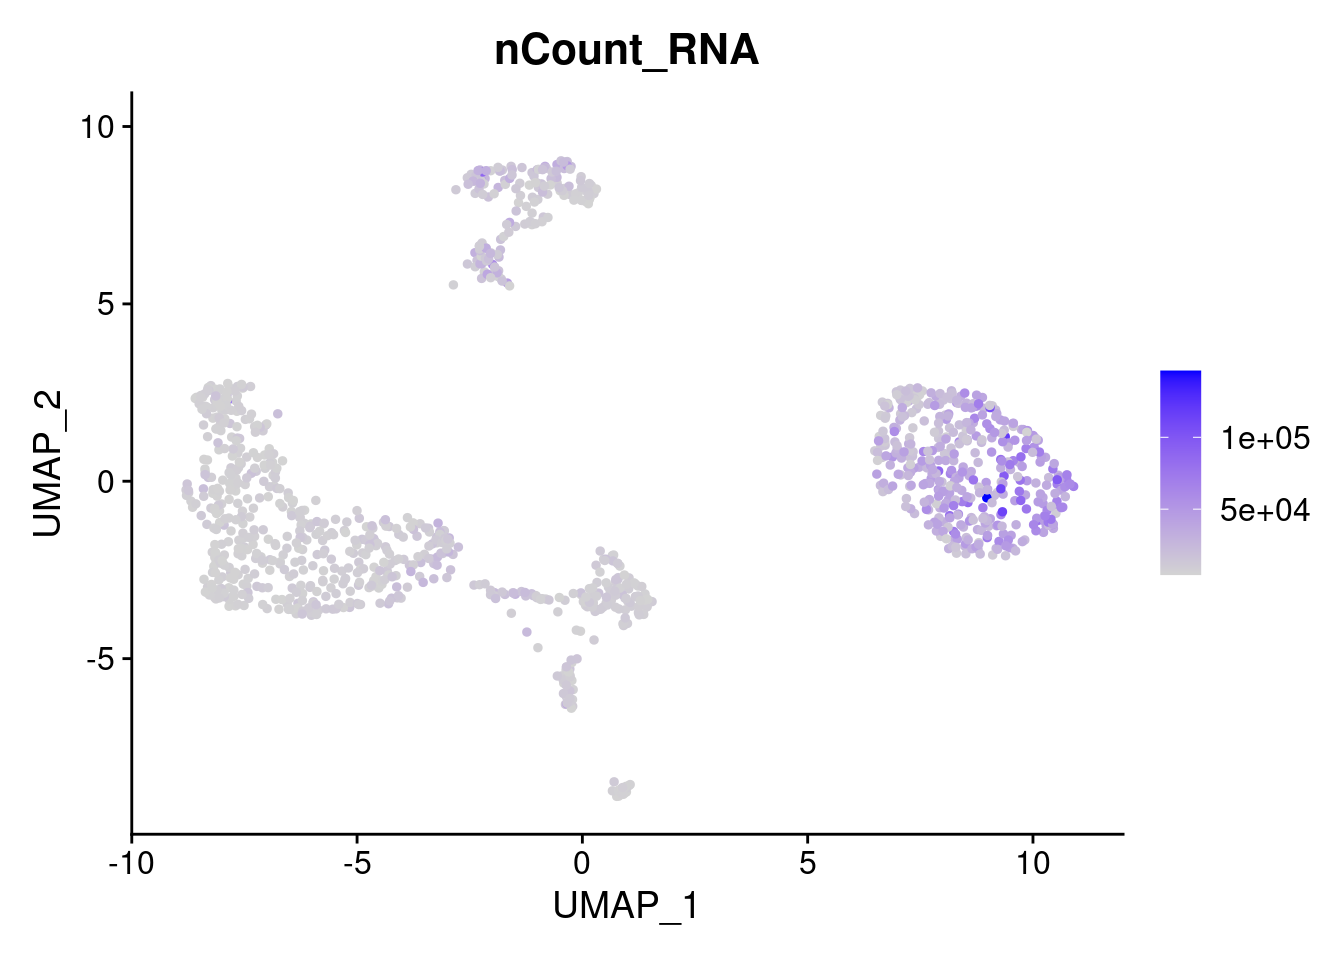
VlnPlot(samp.clust, features = "nFeature_RNA", pt.size = 0)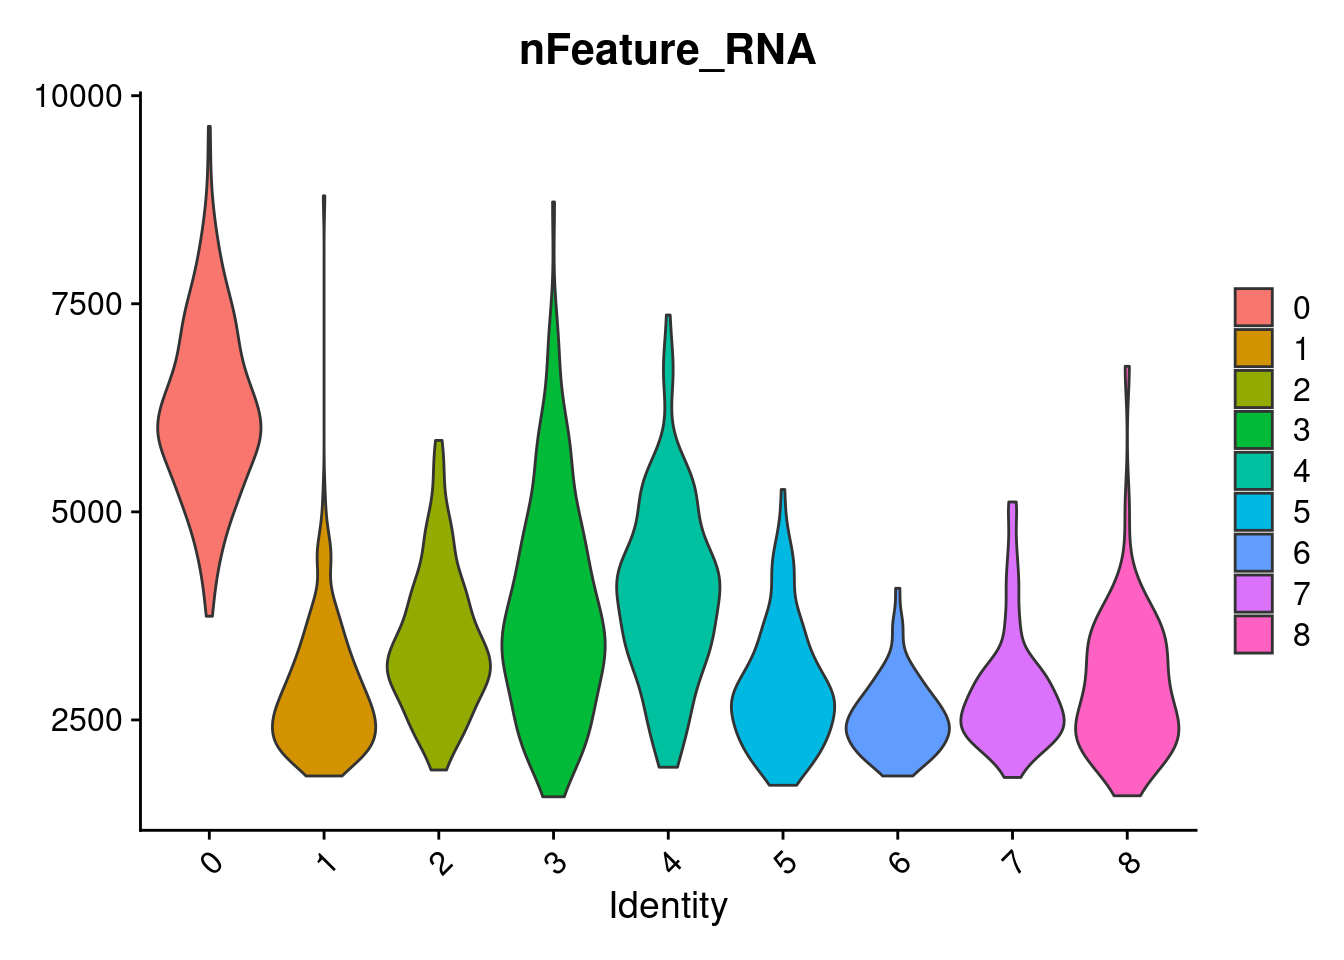
| Version | Author | Date |
|---|---|---|
| 74badaf | KLRhodes | 2020-08-04 |
VlnPlot(samp.clust, features = "percent.mt", pt.size = 0)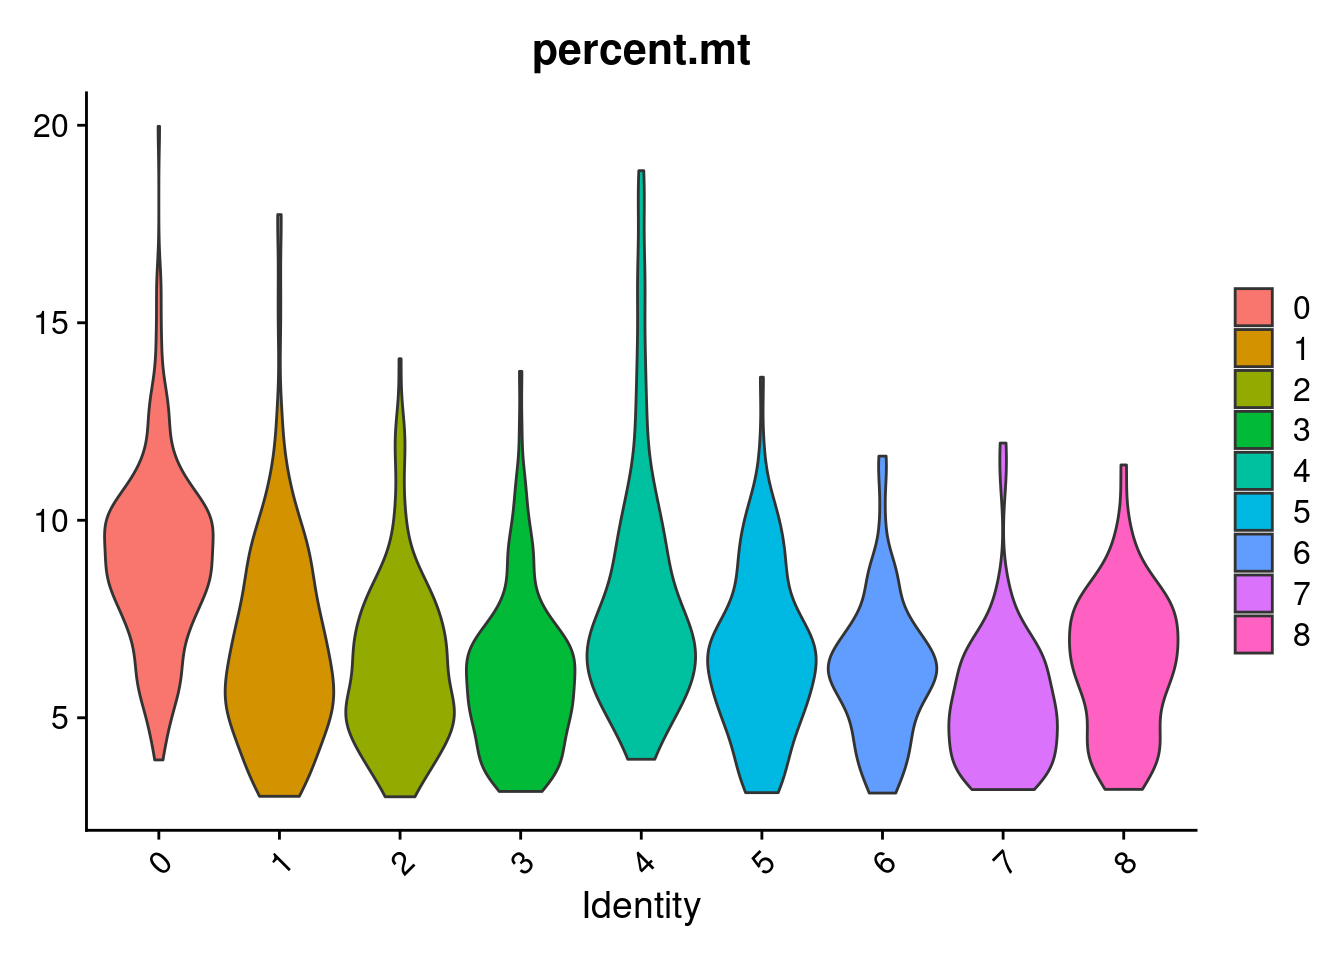
#how many cells per cluster from each individual?
table(samp.clust@meta.data$SCT_snn_res.0.8, samp.clust@meta.data$individual)
    SNG-NA18511.variant2 SNG-NA18858.variant2 SNG-NA19160.variant2
  0                    0                  266                    0
  1                   63                   42                   99
  2                   98                   11                   64
  3                   56                    7                   96
  4                    9                  118                    8
  5                    8                    0                  103
  6                   69                    0                    1
  7                    5                    1                   62
  8                   17                    2                   40
sessionInfo()R version 3.6.1 (2019-07-05)
Platform: x86_64-pc-linux-gnu (64-bit)
Running under: Scientific Linux 7.4 (Nitrogen)
Matrix products: default
BLAS/LAPACK: /software/openblas-0.2.19-el7-x86_64/lib/libopenblas_haswellp-r0.2.19.so
locale:
[1] C
attached base packages:
[1] parallel stats4 stats graphics grDevices utils datasets
[8] methods base
other attached packages:
[1] here_0.1-11 dplyr_1.0.2
[3] ggplot2_3.3.3 DropletUtils_1.6.1
[5] SingleCellExperiment_1.8.0 SummarizedExperiment_1.16.1
[7] DelayedArray_0.12.3 BiocParallel_1.20.1
[9] matrixStats_0.57.0 Biobase_2.46.0
[11] GenomicRanges_1.38.0 GenomeInfoDb_1.22.1
[13] IRanges_2.20.2 S4Vectors_0.24.4
[15] BiocGenerics_0.32.0 Matrix_1.2-18
[17] Seurat_3.2.0 knitr_1.29
[19] workflowr_1.6.2
loaded via a namespace (and not attached):
[1] plyr_1.8.6 igraph_1.2.6 lazyeval_0.2.2
[4] splines_3.6.1 listenv_0.8.0 digest_0.6.27
[7] htmltools_0.5.0 gdata_2.18.0 magrittr_2.0.1
[10] tensor_1.5 cluster_2.1.0 ROCR_1.0-7
[13] limma_3.42.2 globals_0.12.5 R.utils_2.9.2
[16] colorspace_2.0-0 rappdirs_0.3.3 ggrepel_0.9.0
[19] xfun_0.16 crayon_1.3.4 RCurl_1.98-1.2
[22] jsonlite_1.7.2 spatstat_1.64-1 spatstat.data_1.4-3
[25] survival_3.2-3 zoo_1.8-8 ape_5.4-1
[28] glue_1.4.2 polyclip_1.10-0 gtable_0.3.0
[31] zlibbioc_1.32.0 XVector_0.26.0 leiden_0.3.3
[34] Rhdf5lib_1.8.0 future.apply_1.6.0 HDF5Array_1.14.4
[37] abind_1.4-5 scales_1.1.1 edgeR_3.28.1
[40] miniUI_0.1.1.1 Rcpp_1.0.6 viridisLite_0.3.0
[43] xtable_1.8-4 reticulate_1.20 dqrng_0.2.1
[46] rsvd_1.0.3 htmlwidgets_1.5.1 httr_1.4.2
[49] gplots_3.0.4 RColorBrewer_1.1-2 ellipsis_0.3.1
[52] ica_1.0-2 farver_2.0.3 pkgconfig_2.0.3
[55] R.methodsS3_1.8.0 uwot_0.1.10 deldir_0.1-28
[58] locfit_1.5-9.4 labeling_0.4.2 tidyselect_1.1.0
[61] rlang_0.4.10 reshape2_1.4.4 later_1.1.0.1
[64] munsell_0.5.0 tools_3.6.1 generics_0.1.0
[67] ggridges_0.5.2 evaluate_0.14 stringr_1.4.0
[70] fastmap_1.0.1 yaml_2.2.1 goftest_1.2-2
[73] npsurv_0.4-0 fs_1.4.2 fitdistrplus_1.0-14
[76] caTools_1.18.0 purrr_0.3.4 RANN_2.6.1
[79] pbapply_1.4-2 future_1.18.0 nlme_3.1-140
[82] whisker_0.4 mime_0.9 R.oo_1.23.0
[85] compiler_3.6.1 plotly_4.9.2.1 png_0.1-7
[88] lsei_1.2-0 spatstat.utils_1.17-0 tibble_3.0.4
[91] stringi_1.5.3 RSpectra_0.16-0 lattice_0.20-38
[94] vctrs_0.3.6 pillar_1.4.7 lifecycle_0.2.0
[97] lmtest_0.9-37 RcppAnnoy_0.0.18 data.table_1.13.4
[100] cowplot_1.1.1 bitops_1.0-6 irlba_2.3.3
[103] httpuv_1.5.4 patchwork_1.1.1 R6_2.5.0
[106] promises_1.1.1 KernSmooth_2.23-15 gridExtra_2.3
[109] codetools_0.2-16 MASS_7.3-51.4 gtools_3.8.2
[112] rhdf5_2.30.1 rprojroot_2.0.2 withr_2.4.2
[115] sctransform_0.2.1 GenomeInfoDbData_1.2.2 mgcv_1.8-28
[118] grid_3.6.1 rpart_4.1-15 tidyr_1.1.0
[121] rmarkdown_2.3 Rtsne_0.15 git2r_0.26.1
[124] shiny_1.5.0